
Examples
Example 1. A clinical dietician wants to compare two different diets, A and
B, for diabetic patients. She hypothesizes that diet A (Group 1) will be better
than diet B (Group 2), in terms of lower blood glucose. She plans to get a
random sample of diabetic patients and randomly assign them to one of the two
diets. At the end of the experiment, which lasts 6 weeks, a fasting blood
glucose test will be conducted on each patient. She also expects that the
average difference in blood glucose measure between the two group will be about
10 mg/dl. Furthermore, she also assumes the standard deviation of blood glucose
distribution for diet A to be 15 and the standard deviation for diet B to be 17. The dietician wants to know the number of subjects needed in each group assuming
equal sized groups.
Example 2. An audiologist wanted to study the effect of gender on the
response time to a certain sound frequency. He suspected that men were better at
detecting this type of sound then were women. He took a random sample of 20 male
and 20 female subjects for this experiment. Each subject was be given a button
to press when he/she heard the sound. The audiologist then measured the response
time – the time between the sound was emitted and the time the button was
pressed. Now, he wants to know what the statistical power is based on his total
of 40 subjects to detect the gender difference.
Prelude to the power analysis
There are two different aspects of power analysis. One is to calculate the
necessary sample size for a specified power as in Example 1. The other aspect is
to calculate the power when given a specific sample size as in Example 2. Technically, power is the probability of rejecting the null hypothesis when the
specific alternative hypothesis is true. We can also think of this as the
probability of detecting a true effect.
For the power analyses below, we are going to focus on Example 1 and
calculate
the required sample size for a given statistical power when testing the difference in the
effect of diet A and diet B. In order to perform the power analysis, the
dietician has to make some decisions about the precision and sensitivity of the
test and provide some educated guesses about the data distributions. Here is the information we have to know
or estimate or assume in order to perform the power analysis and the values
given for Example 1:
- The expected difference in the average blood glucose; in this case it is
set to 10. - The standard deviations of blood glucose for Group 1 and Group 2; in
this case, they are set to 15 and 17 respectively. - The alpha level, or the Type I error rate, which is the probability of
rejecting the null hypothesis when it is actually true. A common practice
is to set it at the .05 level. - The pre-specified level of statistical power for calculating the sample
size; this will be set to .8. - The pre-specified number of subjects for calculating the statistical
power; this is the situation for Example 2.
Notice that in the first example, the dietician specified the difference
in the two means but didn’t specify the means for
each group. This is
because that she is only interested in the difference and the actual values of
the means will not effect her analysis.
Power analysis
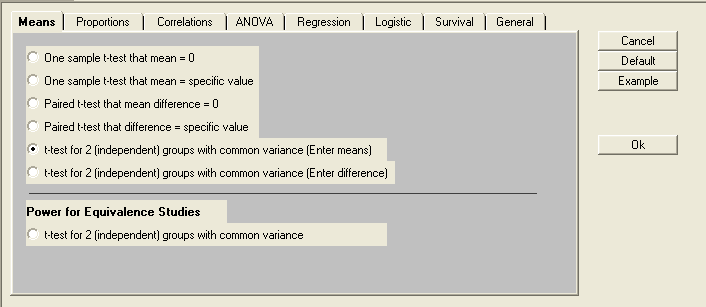
In Sample Power, it is fairly straightforward to perform power analysis for
comparing means. Simply begin a new analysis and select ‘t-test for two
independent groups with common variance [enter means]’.
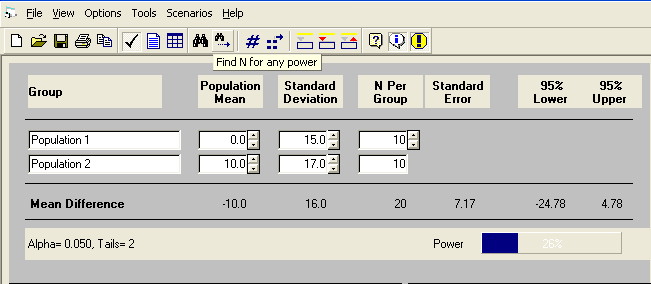
We can then specify the two means, the mean for Group 1 (diet A) and the mean
for Group 2 (diet B). Since what really matters is the difference between the
two values, we can enter a mean of zero for Group 1 and a mean of 10 for Group
2 so that the difference in means will be 10. Next, we specify the standard
deviation for the first population and standard deviation for the second
population. Note that upon entering a value for the second group, the following
window will appear, to which ‘yes’ is the appropriate response.

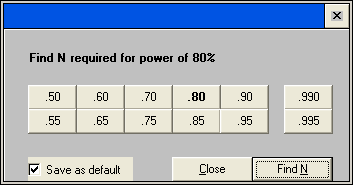
From there, the default significance level (alpha level) is .05. For this
example, we will set the power to be .8 by clicking the ‘Find N for any
power’ button.
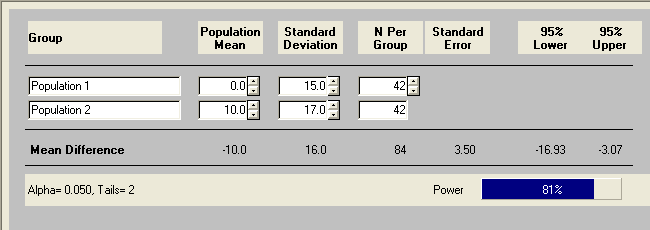
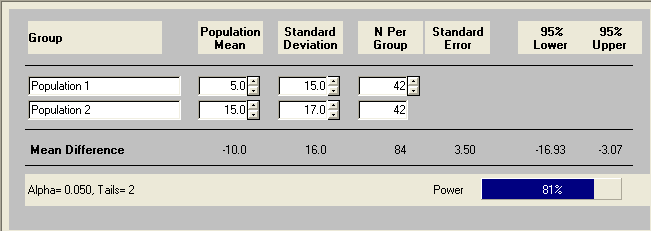
The calculation results indicate that we would need 42 subjects for diet A and
another 42 subject for diet B in our sample in order to detect the specified
difference with the given power. Now, let’s use
another pair of means with the same difference. As we have discussed earlier,
the results should be the same and we can see that they are.
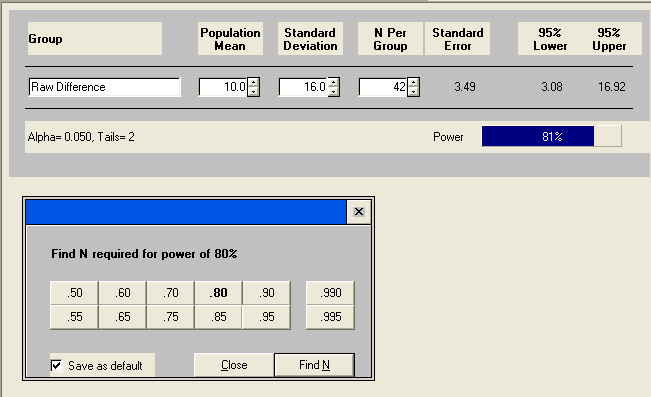
A third way to the same result would be to begin a new project, designate
‘t-test for two independent groups with common variance [enter difference]’, and
enter the difference between the means and the pooled standard deviation, which
is the square root of the average of the two variances (squared standard
deviations). In this case,
it is sqrt((15^2 + 17^2)/2) ≈ 16.0.
Despite the different types of inputs, we see an identical outcome.
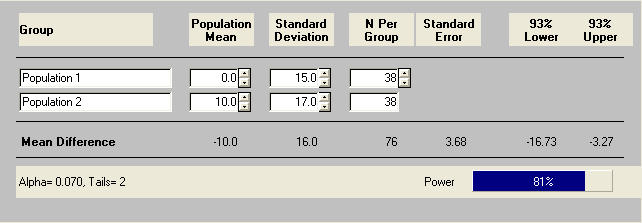
Now the dietician may feel that a total sample size of 82 subjects is beyond
her budget. One way of reducing the sample size is to increase the Type I error
rate, or the alpha level. Let’s say instead of using alpha level of .05 we will
use .07, an adjustment accomplished by clicking the alpha value, then the blank
value, and entering the new alpha value. As a result, our sample size
decreases
by 4 for each group as shown below.
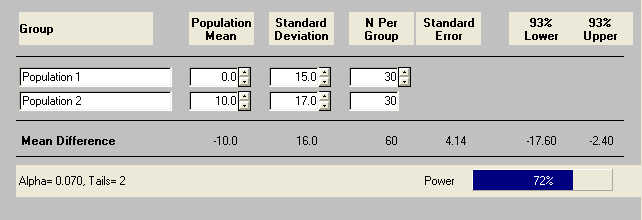
Now suppose the dietician can only collect data on 60 subjects with 30 in
each group. What will the statistical power for her t-test be with respect to
alpha level of .07?
What if she actually collected her data on 60 subjects but with 40 on diet A
and 20 on diet B instead of equal sample sizes in the groups? Note that
the N values will need to be unlinked, like the standard deviations were before.
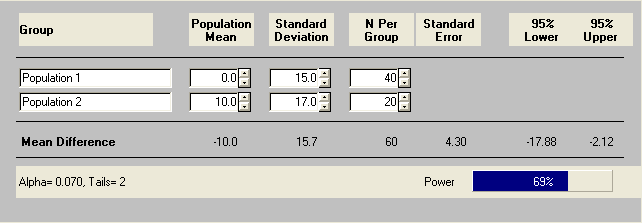
As you can see the power goes down from .72 to .69 even though the total
number of subjects is the same. This is why we always say that a balanced design
is more efficient.
Discussion
An important technical assumption is the normality assumption. If the
distribution is skewed, then a small sample size may not have the power shown in
the results because the power in the results is calculated using the normality
assumption. We have seen that in order to compute the power or the sample
size, we have to make a number of assumptions. These assumptions are used
not only for the purpose of power calculations but in the actual t-test itself. So one important side benefit of performing power
analysis is to help us to better understand our designs and our hypotheses.
We have seen in the power calculation process that what matters in the
two-independent sample t-test is the difference in the means and the standard
deviations for the two groups. This leads to the concept of effect size. In
this case, the effect size will be the difference in means over the pooled
standard deviation. The larger the effect size, the higher the power for a
given sample size. Or the larger the effect size, the smaller the sample size
needed to achieve a given level of power. Given this relationship, we can
see that an accurate estimate of effect size is key
to a good power analysis. However, it is not always an easy task to determine
the effect size prior to collecting data. Good estimates of effect size
often come from the existing
literature or pilot studies.
For more information on power analysis, please visit our
Introduction to Power Analysis
seminar.