
Note: This page uses SAS 9.2.
The tobit model, also called a censored regression model, is designed to estimate
linear relationships between variables when there is either left- or right-censoring
in the dependent variable (also known as censoring from below and above,
respectively). Censoring from above takes place when cases with a value at or
above some threshold, all take on the value of that threshold, so
that the true value might be equal to the threshold, but it might also be higher.
In the case of censoring from below, values those that fall at or below some
threshold are censored.
Please note: The purpose of this page is to show how to use various data analysis commands.
It does not cover all aspects of the research process which researchers are expected to do. In
particular, it does not cover data cleaning and checking, verification of assumptions, model
diagnostics and potential follow-up analyses.
Examples of tobit analysis
Example 1.
In the 1980s there was a federal law restricting speedometer readings to no more than 85 mph. So if
you wanted to try and predict a vehicle’s top-speed from a combination of horse-power and engine size,
you would get a reading no higher than 85, regardless of how fast the vehicle was really traveling.
This is a classic case of right-censoring (censoring from above) of the data. The only thing we are certain of is that
those vehicles were traveling at least 85 mph.
Example 2. A research project
is studying the level of lead in home drinking water as a function of the age of
a house and family income. The water testing kit cannot detect lead
concentrations below 5 parts per billion (ppb). The EPA considers levels above
15 ppb to be dangerous. These data are an example of left-censoring (censoring
from below).
Example 3. Consider the situation in which we have a measure of academic
aptitude (scaled 200-800) which we want to model using reading and math test
scores, as well as, the type
of program the student is enrolled in (academic, general, or vocational). The problem here is that students who answer all questions on
the academic aptitude test correctly receive a score of 800, even though it is likely that these
students are not “truly” equal in aptitude. The same is true of students who
answer all of the questions incorrectly. All such students would have a score of
200, although they may not all be of equal aptitude.
Description of the data
Let’s pursue Example 3 from above. We have a hypothetical data file,
tobit.sas7bdat
with 200 observations with format
defined below. The academic aptitude variable is apt,
the reading and math test scores are read and math respectively.
The variable prog is the type of program the student is in, it is a
categorical (nominal) variable that takes on three values, academic (prog
= 1), general (prog = 2), and vocational (prog = 3). Variable
prog comes with a format provided below.
proc format;
  value proga 1="academic"
              2="general"
     	      3="vocational";
run;
data tobit; set tobit; format prog proga.; run;
Let’s look at the data. Note that in this dataset, the lowest value of apt
is 352. Note that no students received a score of 200 (i.e., the lowest score possible),
meaning that even though censoring from below was possible, it does not occur in
the dataset.
options nolabel nocenter nodate formchar = '|----|+|---+=|-/<>*';
proc means data = tobit maxdec=2 nonobs;
   class prog;
   vars apt read math;
run;
prog          Variable      N            Mean         Std Dev         Minimum         Maximum
---------------------------------------------------------------------------------------------
academic      apt          45          639.02           78.63          454.00          800.00
              read         45           49.76            9.23           28.00           68.00
              math         45           50.02            7.44           35.00           63.00

general       apt         105          677.76           88.21          462.00          800.00
              read        105           56.16            9.59           34.00           76.00
              math        105           56.73            8.73           38.00           75.00

vocational    apt          50          561.72           92.76          352.00          800.00
              read         50           46.20            8.91           31.00           68.00
              math         50           46.42            7.95           33.00           75.00
---------------------------------------------------------------------------------------------
ods graphics  / reset=all imagename='dens' imagefmt=png
width=4in height=4in border=off;
proc sgplot data = tobit noautolegend;
  histogram apt;
  density apt /type = normal lineattrs=(color=blue);
run;
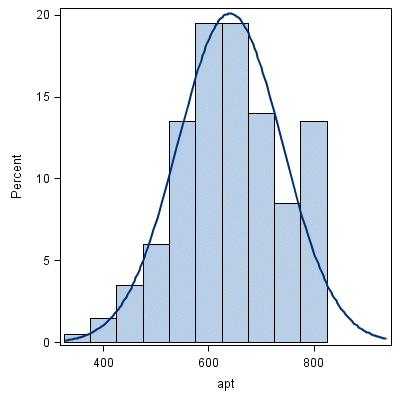
Looking at the above histogram showing the distribution of apt, we can see the
censoring in the data, that is, there are far more cases with scores of 775 to 800 (i.e., the final bin)
than one would expect looking at the rest of the distribution. Below is an alternative
histogram that further highlights the excess of cases where apt=800. In the histogram
below, midpoints option is used to produce a histogram where each unique value of apt has
its own bar by specifying that there should be bins from 350 (the minimum of apt is 352) and a max of 800 in units of 1. Because apt is continuous, most values of apt are
unique in the dataset, although close to the center of the distribution there are a few
values of apt that have two or three cases. The spike on the far right of the histogram is
the bar for cases where apt=800, the height of this bar relative to all the others clearly
shows the excess number of cases with this value.
ods graphics  / reset=all imagename='hist' imagefmt=png
width=4in height=4in border=off;
proc univariate data=tobit noprint;
  histogram apt / midpoints=350 to 800 by 1 normal ;
run;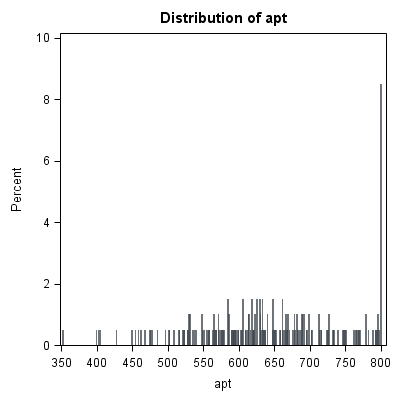
Next we’ll explore the bivariate relationships in our dataset. We make use of the scatter matrix plot created by
proc corr via ods graphics on option.
ods graphics  / reset=all imagename='mat' imagefmt=png
width=4in height=4in border=off;
ods graphics on;
proc corr data = tobit nosimple;
   var read math apt;
run;
ods graphics off;
  Pearson Correlation Coefficients, N = 200
          Prob > |r| under H0: Rho=0

              read          math           apt

read       1.00000       0.66228       0.64512
                          <.0001        <.0001

math       0.66228       1.00000       0.73327
            <.0001                      <.0001

apt        0.64512       0.7332
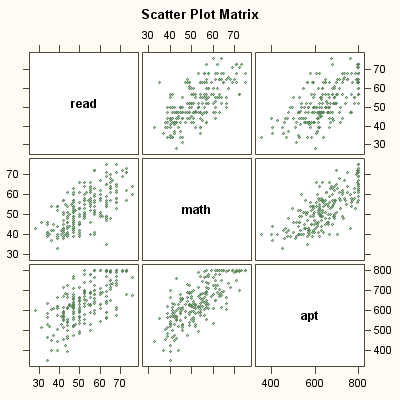
Note the collection of cases at the top of the bottom row of the scatter plots are due to the censoring in the distribution of
apt.
Analysis methods you might consider
Below is a list of some analysis methods you may have encountered.
Some of the methods listed are quite reasonable while others have either
fallen out of favor or have limitations.
- Tobit regression, the focus of this page.
- OLS Regression – You could analyze these data using OLS regression. OLS regression
will treat the 800 as the actual values and not as the upper limit of the top academic
aptitude. A limitation of this approach is that when the variable is censored, OLS provides inconsistent
estimates of the parameters, meaning that the coefficients from the analysis
will not necessarily approach the "true" population parameters as the sample size
increases. See Long (1997, chapter 7) for a more detailed discussion of the problems using OLS regression with censored data. - Truncated Regression – There is sometimes confusion about the difference
between truncated data and censored data. With censored
variables, all of the observations are in the dataset, but we don’t know the "true"
values of some of them. With truncation some of the observations are not
included in the analysis because of the value of the variable. When a
variable is censored, regression models for truncated data provide inconsistent estimates of the parameters. See Long
(1997, chapter 7) for a more detailed discussion of problems of using
regression models for truncated data to analyze censored data.
Tobit analysis
Below we use proc qlim to fit a tobit regression model. Note that proc qlim is part of the ETS module for SAS. It is also possible to fit a
tobit model using proc lifereg (part of the STAT module), although the syntax to do so is somewhat different from the example shown below.
The class statement identifies prog as a categorical variable, and the
model statement specifies that apt should be modeled using read,
math,
and prog. The endogenous statement specifies that the outcome variable
apt is censored, with an upper bound of 800 (i.e., ub=800).
proc qlim data = tobit ;
  class prog;
  model apt = read math prog;
  endogenous apt ~ censored (ub=800);
run;<
The QLIM Procedure

                 Summary Statistics of Continuous Responses

                                                                  N Obs N Obs
                      Standard                     Lower    Upper Lower Upper
Variable     Mean        Error       Type          Bound    Bound Bound Bound

  apt     640.035    99.219030     Censored                   800          17


             Class Level Information

Class       Levels    Values

prog             3    academic general vocational


              Model Fit Summary

Number of Endogenous Variables               1
Endogenous Variable                        apt
Number of Observations                     200
Log Likelihood                           -1041
Maximum Absolute Gradient           8.40561E-7
Number of Iterations                        26
Optimization Method               Quasi-Newton
AIC                                       2094
Schwarz Criterion                         2114
- The top of the output provides a summary of the number of left- and right-censored values.
- The section labeled Model Fit Summary includes information on the number of observations
(200), the number
of iterations it took the model to converge, the final log likelihood, and the AIC and Schwarz
Criterion (also known as the BIC). - The final log likelihood of -1041 can be used to compare nested models, but
we won't show an example of that here. - The AIC and Schwarz Criterion can be used to compare nested and non-nested models.
                             Parameter Estimates

                                                 Standard               Approx
Parameter                DF       Estimate          Error   t Value   Pr > |t|

Intercept                 1     163.422155      30.408580      5.37    <.0001
read                      1       2.697939       0.618806      4.36    <.0001
math                      1       5.914484       0.709818      8.33    <.0001
prog        academic      1      46.143900      13.724195      3.36    0.0008
prog        general       1      33.429162      12.955628      2.58    0.0099
prog        vocational    0              0              .       .       .
_Sigma                    1      65.676720       3.481423     18.86    <.0001
Under the heading Parameter Estimates we see the coefficients, their standard errors, the t-statistics, and associated p-values. The coefficients for
read and math are statistically significant, as are the terms for
prog="academic" and prog="general" (with prog="vocational" as the reference category). Tobit regression coefficients are
interpreted in the similiar manner to OLS regression coefficients; however, the linear effect
is on the uncensored latent variable, not the observed outcome. See McDonald and Moffitt, (1980) for more details.
- A one unit increase in read is associated with a 2.7 point increase in the predicted
value of apt. - A one unit increase in math is associated with a 5.9 point increase in the predicted
value of apt. - The terms for prog have a slightly different interpretation. The predicted value of apt is 46.14 higher for students in an academic program (prog="academic") than for
students in a vocational program (prog="vocational"). The
predicted value of apt is 33.43 points higher for students in a general
program (prog="general") than for students in a vocational program (prog="vocational"). - The ancillary statistic _sigma is equivalent to the square root of the
residual variance in OLS regression. The value of 65.67 can be compared
to the standard deviation of academic aptitude which was 99.21, a
substantial reduction. That _sigma is statistically significant means that
the estimated coefficient (65.67) is statistically significantly different
from 0. The validity of this test of _sigma is a matter of debate
among statisticians, and some programs will produce the estimate and
standard error, but not the test of statistical significance.
We can include a test of the overall effect of prog, by testing whether the coefficients for
prog="academic" and prog="general" are simultaneously equal to 0. To do this we add a
test statement to the proc qlim code. To figure out how SAS names the dummy variables for a class variable, it is usually a good idea to output the parameter estimates as a data set (in this example, we named it as t) and print it out to see how internally SAS names these variables. In our example, we see that SAS has appended the value label
to prog in naming the dummy variables for prog.
proc qlim data = tobit outest=t;
  class prog;
  model apt = read math prog;
  endogenous apt ~ censored (ub=800);
run;
proc print data = t noobs;
run;
                                                            prog_    prog_      prog_
_NAME_  _TYPE_   _STATUS_    Intercept    read     math   academic  general  vocational   _Sigma

         PARM   0 Converged   163.422   2.69794  5.91448   46.1439  33.4292       .      65.6767
         STD    0 Converged    30.409   0.61881  0.70982   13.7242  12.9556       .       3.4814
proc qlim data = tobit ;
  class prog;
  model apt = read math prog;
  endogenous apt ~ censored (ub=800);
  test 'prog' prog_academic=0,
              prog_general =0;
run;
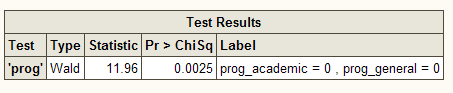
Because the model is the same, the output for this syntax is the same as
before, except for the addition section shown showing the results of the
test statement. Under Test Results, we see
that the overall effect of prog is statistically significant.
We can also test additional hypotheses about the differences in the coefficients
for different levels of prog. Below we test that the coefficient for prog="academic" is equal
to the coefficient for prog="general".
proc qlim data = tobit;
  class prog;
  model apt = read math prog;
  endogenous apt ~ censored (ub=800);
  test 'academic vs. general' prog_academic - prog_general = 0;
run;
We may also wish to evaluate how well our model fits. This can be
particularly useful when comparing competing models. One method of assessing
model fit is to compare the predicted values based on the tobit model to the observed values
in the dataset. Below we use proc qlim to generate predicted values along with the data via the output statement. Then proc corr is used to estimate the
correlation between the predicted and observed values of apt. The output from proc corr gives the correlation between the predicted and observed values of apt,
which is 0.78094. If we square this
value, we get the squared multiple correlation, this indicates that the predicted values
share about 61% (0.78094^2 = .6099) of their variance with the observed values
of apt.
proc qlim data=tobit ;
  model apt = read math prog;
  endogenous apt ~ censored (ub=800);
  output out = temp1 predicted;
run;

proc corr data = temp1 nosimple;
  var apt p_apt;
run;

Pearson Correlation Coefficients, N = 200
        Prob > |r| under H0: Rho=0

                apt         P_apt

apt         1.00000       0.78094
                           <.0001

P_apt       0.78094       1.00000
             <.0001
See also
- References
- Long, J. S. and Freese, J. 2006.
Regression Models for Categorical and Limited Dependent Variables Using Stata.
Second Edition . College Station, TX: Stata Press. - Long, J. S. 1997. Regression Models for Categorical and Limited Dependent Variables.
Thousand Oaks, CA: Sage Publications. - Tobin, J. 1958. Estimation of relationships for limited dependent variables.
Econometrica 26: 24-36. - The sas program used for this page can be downloaded following the link.
- A translation of this page into Romanian by Alexander Ovsov is available here.
McDonald, J. F. and Moffitt, R. A. 1980. The Uses of Tobit Analysis. The Review of Economics and Statistics
Vol 62(2): 318-321.