
Figure 5.1, using data file davis. We create a dataset containing
observations just on women. Then use proc gplot to create the graph.
We also fix the error on case 12 in the data file. The measured weight (measwt)
and measured height (measht) were switched.
data davis_co;
  set davis;
  if _n_=12 then do
  temp=measht;
  measht=measwt;
  measwt=temp;
  end;
  drop temp male;
  if male =0;
run;
proc reg data=davis_co noprint;
  model measwt = reptwt;
  output out=dvs_reg p=p;
  proc sort data=dvs_reg;
  by reptwt;
proc sort data=davis_co;
  by reptwt;
data dvs_all;
  merge davis_co dvs_reg;
  by reptwt;
run;
symbol1 color=black i=none v=star height=0.5;
symbol2 color=blue i=join v=none height=1;
symbol3 color=black i=join v=none height=1;
axis1 order=(40 to 80 by 20);
axis2 order=(40 to 80 by 20) label=(r=0 a=90);
filename outfiles 'https://stats.idre.ucla.edu/wp-content/uploads/2016/02/chap5ex1.gif';
goptions gsfname=outfiles dev=gif373;
proc gplot data=dvs_all;
  plot measwt*reptwt=1 p*reptwt=2 reptwt*reptwt=3
  /overlay haxis=axis1 vaxis=axis2 hminor=0 vminor=0;
run;
quit;
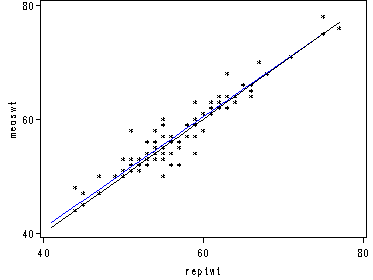
The following shows how to get the regression equation shown on
page 89 using proc reg that has been used in last example to get
the least-square fit. This still uses the davis data file we
previously used and fixed.
proc reg data=davis_co usscp;
model measwt=reptwt;
run;
quit;The REG Procedure
Uncorrected Sums of Squares and Crossproducts
Variable Intercept reptwt measwt
Intercept 101 5731 5780
reptwt 5731 329731 332408
measwt 5780 332408 335530The REG Procedure
Model: MODEL1
Dependent Variable: measwtAnalysis of Variance
Sum of Mean
Source DF Squares Square F Value Pr > FModel 1 4334.88935 4334.88935 1024.54 <.0001
Error 99 418.87303 4.23104
Corrected Total 100 4753.76238Root MSE 2.05695 R-Square 0.9119
Dependent Mean 57.22772 Adj R-Sq 0.9110
Coeff Var 3.59432Parameter Estimates
Parameter Standard
Variable DF Estimate Error t Value Pr > |t|Intercept 1 1.77750 1.74441 1.02 0.3107
reptwt 1 0.97722 0.03053 32.01 <.0001
In the output above,
Root MSE is the standard error of regression and it also show
TSS, RSS, Regss and R-Square on page 94.The following example is based on data file prestige for the result
on page 102 and 103. The option outsscp is used to produce Table 5.2
proc reg data=prestige outsscp=temp;
model prestige=educat income percwomn;
run;
quit;
proc print data=temp;
run;The REG Procedure
Model: MODEL1
Dependent Variable: prestigeAnalysis of Variance
Sum of Mean
Source DF Squares Square F Value Pr > FModel 3 23862 7953.95216 129.19 <.0001
Error 98 6033.57019 61.56704
Corrected Total 101 29895Root MSE 7.84647 R-Square 0.7982
Dependent Mean 46.83333 Adj R-Sq 0.7920
Coeff Var 16.75402Parameter Estimates
Parameter Standard
Variable DF Estimate Error t Value Pr > |t|Intercept 1 -6.79433 3.23909 -2.10 0.0385
educat 1 4.18664 0.38870 10.77 <.0001
income 1 0.00131 0.00027778 4.73 <.0001
percwomn 1 -0.00891 0.03041 -0.29 0.7702
Obs _TYPE_ _NAME_ Intercept educat income percwomn prestige
1 SSCP Intercept 102.00 1095.28 693386.00 2955.86 4777.00
2 SSCP educat 1095.28 12513.04 8121410.14 32280.89 55326.38
3 SSCP income 693386.00 8121410.14 6534383460.00 14093096.74 37748108.50
4 SSCP percwomn 2955.86 32280.89 14093096.74 187311.52 131909.38
5 SSCP prestige 4777.00 55326.38 37748108.50 131909.38 253618.26
6 N 102.00 102.00 102.00 102.00 102.00
Results on page 108 for standardized partial regression coefficient
using option stb in model statement.
proc reg data=prestige;
model prestige = educat income percwomn /stb;
run;
quit;The REG Procedure
Model: MODEL1
Dependent Variable: prestigeAnalysis of Variance
Sum of Mean
Source DF Squares Square F Value Pr > FModel 3 23862 7953.95216 129.19 <.0001
Error 98 6033.57019 61.56704
Corrected Total 101 29895Root MSE 7.84647 R-Square 0.7982
Dependent Mean 46.83333 Adj R-Sq 0.7920
Coeff Var 16.75402Parameter Estimates
Parameter Standard Standardized
Variable DF Estimate Error t Value Pr > |t| EstimateIntercept 1 -6.79433 3.23909 -2.10 0.0385 0
educat 1 4.18664 0.38870 10.77 <.0001 0.66396
income 1 0.00131 0.00027778 4.73 <.0001 0.32418
percwomn 1 -0.00891 0.03041 -0.29 0.7702 -0.01642