
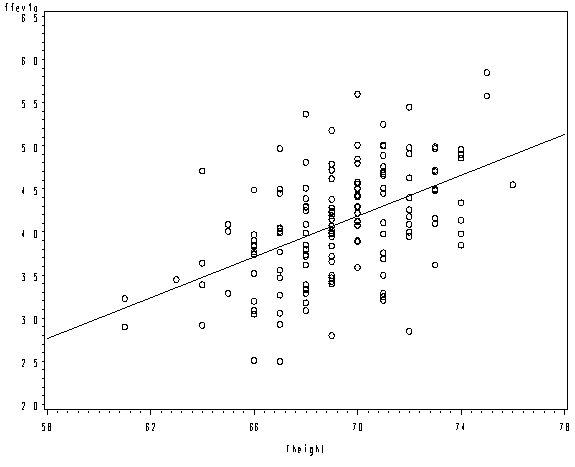
Page 87 Figure 6.1 Scatter diagram and regression line of FEV1 versus
height for fathers in lung function data.NOTE: Throughout this chapter
and the next, the variables FFEV1 and MFEV1 have been divided by
100 before use in analyses. We have named these modified variables
FFEV1a and MFEV1a, respectively.
data lung;
set "c:\cama4\lung";
ffev1a = ffev1/100;
run;
goptions reset = all;
symbol1 i=r v=circle;
axis1 order=(58 to 78 by 4) label=('fheight');
axis2 order=(2 to 6.5 by .5);
proc gplot data = lung;
plot ffev1a*fheight / haxis=axis1 vaxis=axis2;
run;
quit;
Page 88 The descriptive statistics at the top of the page.
proc means data = lung mean std;
var ffev1a fheight;
run;
The MEANS Procedure

Variable    Label                                 Mean         Std Dev
----------------------------------------------------------------------
ffev1a                                       4.0932667       0.6507523
FHEIGHT     height of father in inches      69.2600000       2.7791892
----------------------------------------------------------------------
Page 98 The correlation in the middle of the page
proc corr data = lung;
var ffev1a fheight;
run;
<some output omitted>
      Pearson Correlation Coefficients, N = 150
              Prob > |r| under H0: Rho=0

                                  ffev1a       FHEIGHT

ffev1a                           1.00000       0.50440
                                                <.0001

FHEIGHT                          0.50440       1.00000
height of father in inches        <.0001
Page 100 Table 6.2 ANOVA example from Figure 6.1.
NOTE: We need to generate the residuals for use in the next figure.
proc reg data = lung;
model ffev1a = fheight;
output out = resid r=resid;
run;
quit;
<some output omitted>
The REG Procedure
Model: MODEL1
Dependent Variable: ffev1a

                             Analysis of Variance

                                    Sum of           Mean
Source                   DF        Squares         Square    F Value    Pr > F

Model                     1       16.05317       16.05317      50.50    <.0001
Error                   148       47.04513        0.31787
Corrected Total         149       63.09830
Page 112 Figure 6.10 This has been skipped for now.
Page 116 Figure 6.12 Normal probability plot of the residuals of the
regression of FEV1 on height for fathers in the lung function data.NOTE: The graph produced by proc univariate has the axes
reversed from that shown in the text.
proc univariate data = resid plots;
var resid;
run;
The UNIVARIATE Procedure
Variable:  resid  (Residual)

                       Normal Probability Plot
     1.5+                                                * *
        |                                              *+++
        |                                          ****+
     0.9+                                        **+
        |                                    ****
        |                                 ****
     0.3+                             *****
        |                        *****
        |                     ****
    -0.3+                  ****
        |               ****
        |           *****
    -0.9+        +**
        |    +****
        | +*+*
    -1.5+*
         +----+----+----+----+----+----+----+----+----+----+
             -2        -1         0        +1        +2