
1. A standard ANOVA
2. A standard ANCOVA
3. Estimate slopes for each diet group
4. Test equality of slopes across diet groups
5. Perform tests with separate slopes for all diet groups
5.1 Comparing diet 1 with diet 2
5.2 Comparing diets 1 and 2 to the control group
6. Testing to pool slopes
7. Perform tests with some pooled slopes
7.1 Overall analysis pooling slopes for diet groups 2 and 3
7.2 Comparing diet groups 1 and 2 when pooling slopes for diet groups 2 and 3
7.3 Comparing diet groups 2 and 3 when pooling slopes for diet groups 2 and 3
8. Summary
Analysis of covariance (ANCOVA) is a statistical procedure that allows you to
include both categorical and continuous variables in a single model.
ANCOVA assumes that the regression coefficients are homogeneous (the same)
across the categorical variable. Violation of this assumption can
lead to incorrect conclusions. This page will explore what happens
when you have heterogeneous (different) regressions across groups
and show some strategies for dealing with them. This involves some complex topics in the use of
proc glm, especially the estimate statement.
Here is an example data file we will use. It contains 30 subjects
who used one of three diets, diet 1 (diet=1), diet 2 (diet=2) and
a control group (diet=3). Before the start of the study, the
height of the subject was measured, and after the study the
weight of the subject was measured.
DATA htwt;
  INPUT id diet height weight ;
CARDS;
 1 1  56 140
 2 1  60 155
 3 1  64 143
 4 1  68 161
 5 1  72 139
 6 1  54 159
 7 1  62 138
 8 1  65 121
 9 1  65 161
10 1  70 145
11 2  56 117
12 2  60 125
13 2  64 133
14 2  68 141
15 2  72 149
16 2  54 109
17 2  62 128
18 2  65 131
19 2  65 131
20 2  70 145
21 3  54 211
22 3  58 223
23 3  62 235
24 3  66 247
25 3  70 259
26 3  52 201
27 3  59 228
28 3  64 245
29 3  65 241
30 3  72 269
;
RUN;
1. A standard ANOVA
You could analyze this data with a standard ANOVA, as shown below.
This analysis compares the weights of the three groups. It also uses
the contrast statement to compare the two diets (1 and 2) to the control
group (diet 3). We also want to compare diet 1 with diet 2.
PROC GLM DATA=htwt;
  CLASS diet ;
  MODEL weight = diet ;
  MEANS diet / deponly ;
  CONTRAST 'compare 1&2 with control' diet  1  1 -2 ;
  CONTRAST 'compare diet 1 with 2   ' diet  1 -1  0 ;
RUN;
QUIT;
General Linear Models Procedure Class Level InformationClass Levels Values
DIET 3 1 2 3
Number of observations in data set = 30
General Linear Models Procedure
Dependent Variable: WEIGHT
Sum of Mean
Source DF Squares Square F Value Pr > FModel 2 64350.600000 32175.300000 128.48 0.0001
Error 27 6761.400000 250.422222
Corrected Total 29 71112.000000
R-Square C.V. Root MSE WEIGHT Mean
0.904919 9.254231 15.824735 171.00000
Source DF Type I SS Mean Square F Value Pr > F
DIET 2 64350.600000 32175.300000 128.48 0.0001
Source DF Type III SS Mean Square F Value Pr > F
DIET 2 64350.600000 32175.300000 128.48 0.0001
General Linear Models Procedure
Level of ————WEIGHT———–
DIET N Mean SD1 10 146.200000 12.8391762
2 10 130.900000 12.2424580
3 10 235.900000 20.8936460
General Linear Models ProcedureDependent Variable: WEIGHT
Contrast DF Contrast SS Mean Square F Value Pr > F
compare 1&2 with con 1 63180.150000 63180.150000 252.29 0.0001
compare diet 1 with 1 1170.450000 1170.450000 4.67 0.0397
The ANOVA results show an overall difference among all of the diets
and the contrasts show a difference between the control group and
the two diets, and a difference between diet 1 and diet 2. The ANOVA disregards the information that we have about the subject’s
height. As height is probably correlated with weight, this could
be useful as a covariate in an ANCOVA.
2. A standard ANCOVA
Below we perform a standard ANCOVA.
PROC GLM DATA=htwt; CLASS diet ; MODEL weight = diet height / SOLUTION ; LSMEANS diet ; CONTRAST 'compare control with 1,2' diet 1 1 -2 ; CONTRAST 'compare 1 with 2 ' diet 1 -1 0 ; RUN; QUIT;
The results are consistent with those of the ANOVA.
There is an overall effect of diet. Also, the control group is
significantly different from the two diets, and diet 1 is different
from diet 2. The significance level for the comparison of diet 1 versus diet 2 is smaller than the standard ANOVA.
General Linear Models Procedure
Class Level Information
Class Levels Values
DIET 3 1 2 3
Number of observations in data set = 30
General Linear Models Procedure
Dependent Variable: WEIGHT
Sum of Mean
Source DF Squares Square F Value Pr > F
Model 3 67409.811075 22469.937025 157.80 0.0001
Error 26 3702.188925 142.391882
Corrected Total 29 71112.000000
R-Square C.V. Root MSE WEIGHT Mean
0.947939 6.978250 11.932807 171.00000
Source DF Type I SS Mean Square F Value Pr > F
DIET 2 64350.600000 32175.300000 225.96 0.0001
HEIGHT 1 3059.211075 3059.211075 21.48 0.0001
Source DF Type III SS Mean Square F Value Pr > F
DIET 2 66726.086524 33363.043262 234.30 0.0001
HEIGHT 1 3059.211075 3059.211075 21.48 0.0001
T for H0: Pr > |T| Std Error of
Parameter Estimate Parameter=0 Estimate
INTERCEPT 126.1382736 B 5.26 0.0001 23.97915732
DIET 1 -92.1705212 B -17.19 0.0001 5.36306483
2 -107.4705212 B -20.04 0.0001 5.36306483
3 0.0000000 B . . .
HEIGHT 1.7646580 4.64 0.0001 0.38071364
NOTE: The X’X matrix has been found to be singular and a generalized inverse
was used to solve the normal equations. Estimates followed by the
letter ‘B’ are biased, and are not unique estimators of the parameters.
General Linear Models Procedure
Least Squares Means
DIET WEIGHT
LSMEAN
1 145.376493
2 130.076493
3 237.547014
General Linear Models Procedure
Dependent Variable: WEIGHT
Contrast DF Contrast SS Mean Square F Value Pr > F
compare control with 1 65555.636524 65555.636524 460.39 0.0001
compare 1 with 2 1 1170.450000 1170.450000 8.22 0.0081
Because we used the solution
option, we are shown the regression
coefficients and see the coefficient (slope) between height
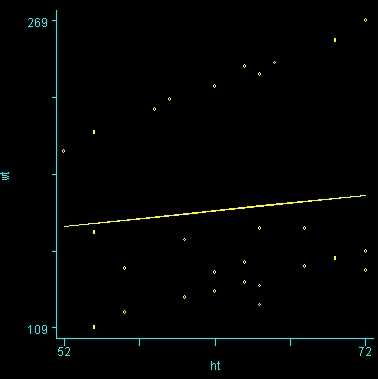
and weight is 1.76. Figure 1 below shows the scatterplot between height and
weight and the line of best fit with slope 1.76.
Figure 1. Scatterplot of
weight by height with overall regression line
3. Estimate slopes for each diet group
One assumption of ANCOVA is that the slope between height and weight
is the same for the three diet groups. This is called the homogeneity of
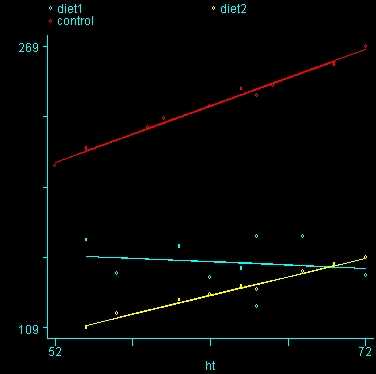
regression assumption. Below we show a scatterplot like the one above; however, this one shows the
three diet groups in different colors and
shows a separate regression line for each diet group (diet 1=blue, diet
2=yellow, diet 3=red). As you can see
the blue regression line looks like it has a very different slope
from the other two regression lines.
Figure 2. Scatterplot of
weight by height with separate regression lines for each group (diet 1=blue,
diet 2=yellow, diet 3=red)
Below we perform an analysis that shows the slopes of each of the
lines. Even if we found the slope between height and weight to be 0 in the
prior analysis, this is still a useful analysis to perform. It is
possible that the overall slope for the entire sample was 0, but the
slopes for some groups were positive and the others were negative and
they cancelled each other out. This analysis would help you see if
such a pattern was occurring.
PROC SORT DATA=htwt; BY diet; RUN; PROC GLM DATA=htwt; BY diet ; MODEL weight = height / SOLUTION ; RUN; QUIT;
We indeed see below that the slopes seem very different.
(Note that the output has been abbreviated.) The slope
for diet 1 (-.37) is much smaller than the slope for diet 2 (2.095) and the control group,
diet=3 (3.189). We need to check into this further and test whether
these slopes are significantly different from each other.
diet=1
Dependent Variable: weight
Standard
Parameter Estimate Error t Value Pr > |t|
Intercept 170.1664447 49.43018216 3.44 0.0088
height -0.3768309 0.77433413 -0.49 0.6396
diet=2
Dependent Variable: weight
Standard
Parameter Estimate Error t Value Pr > |t|
Intercept -2.397470040 7.05327189 -0.34 0.7427
height 2.095872170 0.11049098 18.97 <.0001
diet=3
Dependent Variable: weight
Standard
Parameter Estimate Error t Value Pr > |t|
Intercept 37.49895178 7.70303233 4.87 0.0012
height 3.18972746 0.12323669 25.88 <.0001
4. Test equality of slopes across diet groups
We can test to see if the slopes for the three
diet groups are equal, as shown
below. The diet*height effect tests if the three slopes are equal.
PROC GLM DATA=htwt; CLASS diet ; MODEL weight = diet height diet*height ; RUN; QUIT;
The diet*height effect is indeed significant, indicating that the
slopes do differ across the three diet groups. (Note that we look at the Type III
SS, consistent with our general recommendations to use Type III instead of
Type I SS.) The output is abbreviated to save space.
<some output omitted> Source DF Type III SS Mean Square F Value Pr > F DIET 2 1224.0043440 612.0021720 9.68 0.0008 HEIGHT 1 2597.0189017 2597.0189017 41.10 0.0001 HEIGHT*DIET 2 2185.5435689 1092.7717845 17.29 0.0001
5. Perform tests with separate slopes for all diet groups
Because the slopes for the three diet groups
are not the same, we should not use a traditional ANCOVA model that assumes
the slopes for the three diet groups are the same. Instead, we can use a model that estimates
separate slopes for all three diet groups. Because the diet groups will have
different slopes, we must be very cautious in interpreting adjusted
means. One way of thinking about this is to focus on the fact that
we have a diet*height interaction. This means that we cannot
interpret the relationship between height and weight without referring
to diet.
Likewise, if we want to talk about the effect of diet we need to
specify what height we are talking about. For example, in comparing
diets 1 and 2 (in Figure 2) it looks like there is no difference between
diets 1 and 2 (blue and yellow) for tall people, but there may be a difference for shorter
people. Below, we will see how to make these comparisons.
5.1 Comparing diet 1 with diet 2
Let us compare diet 1 versus diet 2 at three different levels of height, for those
who are 59 inches tall, 64
inches and
68 inches tall. These correspond to the 25th, 50th and 75th percentiles
for height. We can then evaluate separately for each height group
the difference between diet 1 and diet 2.
The model used in this analysis is the same as the model from
section
4 where we estimated separate slopes. In addition we use the estimate
statement for comparing the
diets 1 and 2 at the
three levels of height, and for obtaining the adjusted mean for weight.
The first three estimate statements compare diet 1 with diet 2 at
59, 64, and 68 inches. The next three estimate statements request
the predicted value of weight for people on diet 1 who are 59 inches,
64 inches, and 68 inches tall. The next three estimate statements requests the weight for people on diet
2 who are 59 inches,
64 inches, and 68 inches tall.
PROC GLM DATA=htwt;
CLASS diet ;
MODEL weight = diet height diet*height ;
ESTIMATE 'diet 1 vs 2 at 59 in' diet -1 1 0 diet*height -59 59 0 ;
ESTIMATE 'diet 1 vs 2 at 64 in' diet -1 1 0 diet*height -64 64 0 ;
ESTIMATE 'diet 1 vs 2 at 68 in' diet -1 1 0 diet*height -68 68 0 ;
ESTIMATE 'wt for diet 1 at 59 in' intercept 1 diet 1 0 0 height 59 diet*height 59 0 0 ;
ESTIMATE 'wt for diet 1 at 64 in' intercept 1 diet 1 0 0 height 64 diet*height 64 0 0 ;
ESTIMATE 'wt for diet 1 at 68 in' intercept 1 diet 1 0 0 height 68 diet*height 68 0 0 ;
ESTIMATE 'wt for diet 2 at 59 in' intercept 1 diet 0 1 0 height 59 diet*height 0 59 0 ;
ESTIMATE 'wt for diet 2 at 64 in' intercept 1 diet 0 1 0 height 64 diet*height 0 64 0 ;
ESTIMATE 'wt for diet 2 at 68 in' intercept 1 diet 0 1 0 height 68 diet*height 0 68 0 ;
RUN;
QUIT;
For the sake of saving space, we show just the output related to the
estimate statements.
<output omitted to save space>
Standard
Parameter Estimate Error t Value Pr > |t|
diet 1 vs 2 at 59 in -26.674434 4.64126551 -5.75 <.0001
diet 1 vs 2 at 64 in -14.310919 3.56455159 -4.01 0.0005
diet 1 vs 2 at 68 in -4.420107 4.55895082 -0.97 0.3419
wt for diet 1 at 59 in 147.933422 3.28187031 45.08 <.0001
wt for diet 1 at 64 in 146.049268 2.52051860 57.94 <.0001
wt for diet 1 at 68 in 144.541944 3.22366504 44.84 <.0001
wt for diet 2 at 59 in 121.258988 3.28187031 36.95 <.0001
wt for diet 2 at 64 in 131.738349 2.52051860 52.27 <.0001
wt for diet 2 at 68 in 140.121838 3.22366504 43.47 <.0001
Focusing on the comparison of diets 1 and 2, these results indicate
a significant difference between diet 1 and diet 2 for those 59 inches tall
(t=-5.75, p < .0001) and a significant difference for those 64 inches tall
(t=-4.01, p=0.0005). For those who are tall (i.e., 68 inches), diet 1 and diet 2 are about equally effective.
This corresponds with what we saw in Figure 2.
You will notice that if you take the parameter estimate for “wt for diet 1 at 59
in” minus the parameter estimate for “wt for
diet 2 at 59 in”, you get -26.67, which is the parameter estimate for
“diet 1 vs. 2 at 59 in” (147.93 – 121.25 = -26.67). Likewise, taking
the parameter estimate
for “wt for diet 1 at 64 in” minus the parameter estimate for “wt
for diet 2 at 64in” yields the parameter estimate for “diet 1
vs. 2 at 64 in” (146.04-131.73 = -14.31). You can do a similar
computation for the weights for those 68 inches tall.
It can be very difficult to construct
estimate
statements, so here is
a shortcut that works when you want to compare one group versus another
group using the lsmeans statement.
PROC GLM DATA=htwt; CLASS diet ; MODEL weight = diet height diet*height ; LSMEANS diet / AT height=59 PDIFF ; LSMEANS diet / AT height=64 PDIFF ; LSMEANS diet / AT height=68 PDIFF ; RUN; QUIT;
For the sake of saving space, we show just the output
related to the lsmeans statements. As you can see, the results comparing diet 1 and 2 are
the same using lsmeans as using estimate. For example, for those 59 inches tall,
the adjusted mean for diet 1 is 147.93 and the adjusted mean for diet 2 is
121.25, and this is significant with p<.0001 (see italics in output).
<some output omitted to save space>
The GLM Procedure
Least Squares Means at height=59
weight LSMEAN
diet LSMEAN Number
1 147.933422 1
2 121.258988 2
3 225.692872 3
Least Squares Means for effect diet
Pr > |t| for H0: LSMean(i)=LSMean(j)
Dependent Variable: weight
i/j 1 2 3
1 <.0001 <.0001
2 <.0001 <.0001
3 <.0001 <.0001
NOTE: To ensure overall protection level, only probabilities associated with pre-planned
comparisons should be used.
The GLM Procedure
Least Squares Means at height=64
weight LSMEAN
diet LSMEAN Number
1 146.049268 1
2 131.738349 2
3 241.641509 3
Least Squares Means for effect diet
Pr > |t| for H0: LSMean(i)=LSMean(j)
Dependent Variable: weight
i/j 1 2 3
1 0.0005 <.0001
2 0.0005 <.0001
3 <.0001 <.0001
NOTE: To ensure overall protection level, only probabilities associated with pre-planned
comparisons should be used.
The GLM Procedure
Least Squares Means at height=68
weight LSMEAN
diet LSMEAN Number
1 144.541944 1
2 140.121838 2
3 254.400419 3
Least Squares Means for effect diet
Pr > |t| for H0: LSMean(i)=LSMean(j)
Dependent Variable: weight
i/j 1 2 3
1 0.3419 <.0001
2 0.3419 <.0001
3 <.0001 <.0001
NOTE: To ensure overall protection level, only probabilities associated with pre-planned
comparisons should be used.
It each much easier to use lsmeans for comparing
groups than estimate, however lsmeans can only make pairwise
comparisons. But we are also
interested in comparing the two diets (diet 1 and
diet 2) combined to the control group (diet 3).
For that, we must use estimate since lsmeans will not do that kind
of comparison, as shown below.
5.2 Comparing diets 1 and 2 to the control group
The analysis below compares diets 1 and 2 to the
control group (group 3) at
the three different heights: 59 inches, 64 inches and 68 inches. The
first three estimate commands compare diets 1 and 2 to the control
group at these three different heights. The next three estimate
commands estimate the weight for the diet 1 and diet 2 groups combined at the
three heights. The following estimate commands estimate the
weight for the control group at the three heights.
PROC GLM DATA=htwt; CLASS diet ; MODEL weight = diet height diet*height ; ESTIMATE 'diet 1&2 vs 3 at 59in' diet .5 .5 -1 diet*height 29.5 29.5 -59 ; ESTIMATE 'diet 1&2 vs 3 at 64in' diet .5 .5 -1 diet*height 32 32 -64 ; ESTIMATE 'diet 1&2 vs 3 at 68in' diet .5 .5 -1 diet*height 34 34 -68 ; ESTIMATE 'wt diet 1&2 at 59in' intercept 1 diet .5 .5 0 height 59 diet*height 29.5 29.5 0 ; ESTIMATE 'wt diet 1&2 at 64in' intercept 1 diet .5 .5 0 height 64 diet*height 32 32 0 ; ESTIMATE 'wt diet 1&2 at 68in' intercept 1 diet .5 .5 0 height 68 diet*height 34 34 0 ; ESTIMATE 'wt control at 59in' intercept 1 diet 0 0 1 height 59 diet*height 0 0 59 ; ESTIMATE 'wt control at 64in' intercept 1 diet 0 0 1 height 64 diet*height 0 0 64 ; ESTIMATE 'wt control at 68in' intercept 1 diet 0 0 1 height 68 diet*height 0 0 68 ; RUN; QUIT;
For the sake of saving space, we show just the output
related to the estimate statements.
<some output omitted to save space>
Standard
Parameter Estimate Error t Value Pr > |t|
diet 1&2 vs 3 at 59in -91.096667 3.66066279 -24.89 <.0001
diet 1&2 vs 3 at 64in -102.747701 3.16739826 -32.44 <.0001
diet 1&2 vs 3 at 68in -112.068528 4.13354574 -27.11 <.0001
wt diet 1&2 at 59in 134.596205 2.32063275 58.00 <.0001
wt diet 1&2 at 64in 138.893808 1.78227579 77.93 <.0001
wt diet 1&2 at 68in 142.331891 2.27947541 62.44 <.0001
wt control at 59in 225.692872 2.83109796 79.72 <.0001
wt control at 64in 241.641509 2.61837826 92.29 <.0001
wt control at 68in 254.400419 3.44821580 73.78 <.0001
The output indicates the difference
in weight between diet groups 1 and 2 combined and the control group is -91.0967 pounds at 59
inches, and this difference is significant. We could obtain that difference by
taking 134.59 (the average for diet groups 1 and 2 at 59 inches) minus 225.69 (the
average for diet group 3 at 59 inches). Likewise, the difference between diet groups 1 and 2 versus
diet group 3 is significant at 64 inches (with a difference of -102.74 pounds) and at
68 inches (with a difference of -112.069 pounds). Despite the interaction, the
control group (diet 3) always weighs more than the two diet groups combined.
This is consistent with what we saw in figure 2.
6. Testing to pool slopes
You may have noticed that the slope for diet group 1 was quite different
from 2 and 3, but 2 and 3 were not so different from each other (see the graph
from figure 2 and output in section
4) Rather than estimating three separate slopes, maybe it would be
better if we estimated a slope for diet group 1, and one combined slope
for diet groups 2 and 3. Let’s compare the slopes for diet groups 2
and 3 to see if they are different (and if they are not different they can be combined), and also
test to see if the slope for diet group 1 is really different from the
combined slopes for diet groups 2 and 3.
PROC GLM DATA=htwt; CLASS diet ; MODEL weight = diet height diet*height ; ESTIMATE 'compare 1 vs 2&3' diet*height -2 1 1 ; ESTIMATE 'compare 2 vs 3' diet*height 0 -1 1 ; RUN; QUIT;
For the sake of saving space, we show just the output
related to the estimate statements.
<some output omitted to save space> Parameter Estimate Error t Value Pr > |t| compare 1 vs 2&3 6.03926142 1.10336987 5.47 <.0001 compare 2 vs 3 1.09385529 0.61316088 1.78 0.0871
As we expected, the test comparing the slopes of
diet group 1
versus 2 and 3 was
significant, and the test comparing the slopes for diet groups 2 versus 3 was not significant.
Because the slopes for diet groups 2 and 3 do not significantly differ, we can simplify our
model by including one slope for diet group 1, and one combined slope for diet
groups 2 and 3. This model has two benefits: 1) The estimate of the
slope for diet groups 2 and 3 will be more stable (because it is based on
more cases) than slopes computed separately. Second, as we will
see later, comparisons between diet groups 2 and 3 are greatly simplified
since they will have a common slope.
7. Perform tests with some pooled slopes
7.1 Overall analysis pooling slopes for diet groups 2 and 3
Let’s see how we can can estimate a model with one slope for
diet group 1,
and another slope for diet groups 2 and 3.
First, we will make a dummy variable that is 0 for diet group 1, and 1 for diet
groups 2 and 3, called diet23.
data htwt2; set htwt; if diet = 1 then diet23 = 0; if diet in (2,3) then diet23 = 1; run; PROC FREQ DATA=htwt2; TABLES diet*diet23 / LIST MISSING ; RUN;
The diet23 variable has been created successfully.
Cumulative Cumulative DIET DIET23 Frequency Percent Frequency Percent --------------------------------------------------------- 1 0 10 33.3 10 33.3 2 1 10 33.3 20 66.7 3 1 10 33.3 30 100.0
Now, we can use diet23 in our model. Both diet and
diet23 are
included as class variables. The variable diet is included in the
model statement to indicate the mean differences among the
three different diet groups, and diet23*height is used to indicate that we want to estimate
two slopes.
PROC GLM DATA=htwt2; CLASS diet diet23 ; MODEL weight = diet height diet23*height ; RUN; QUIT;
Notice that diet has 2 df (since it has
three levels) but the interaction of diet23*height has only 1 df (since
diet23
has only two levels), whereas in section 4 the diet*height
interaction had 2 df (since diet has three levels).
General Linear Models Procedure
Class Level Information
Class Levels Values
DIET 3 1 2 3
DIET23 2 0 1
Number of observations in data set = 30
The GLM Procedure
Dependent Variable: weight
Sum of
Source DF Squares Mean Square F Value Pr > F
Model 4 69394.24001 17348.56000 252.49 <.0001
Error 25 1717.75999 68.71040
Corrected Total 29 71112.00000
R-Square Coeff Var Root MSE weight Mean
0.975844 4.847470 8.289174 171.0000
Source DF Type I SS Mean Square F Value Pr > F
diet 2 64350.60000 32175.30000 468.27 <.0001
height 1 3059.21107 3059.21107 44.52 <.0001
height*diet23 1 1984.42894 1984.42894 28.88 <.0001
Source DF Type III SS Mean Square F Value Pr > F
diet 2 58738.39848 29369.19924 427.43 <.0001
height 1 1133.21656 1133.21656 16.49 0.0004
height*diet23 1 1984.42894 1984.42894 28.88 <.0001
7.2 Comparing diet groups 1 and 2 when pooling slopes for diet groups 2 and 3
Even though we have pooled the slopes for groups 2
and 3, when we want to compare groups 1 and 2 we are comparing across groups
with different slopes so we still need to use estimate to
compare the diets at the different levels of heights and obtain the adjusted means.
The first three estimate statements below compare diet groups 1 with 2 at the three levels of height (59, 64 and 68 inches). The next three
estimate statements obtain adjusted means for diet 1 at the three heights, and
the next three estimate statements obtain adjusted means for
diet 2 at the three heights.
PROC GLM DATA=htwt2;
  CLASS diet diet23 ;
  MODEL weight = diet height diet23*height  ;

  ESTIMATE 'diet 1 vs 2 at 59in' diet 1 -1 0 diet23*height  59 -59 ;
  ESTIMATE 'diet 1 vs 2 at 64in' diet 1 -1 0 diet23*height  64 -64 ;
  ESTIMATE 'diet 1 vs 2 at 68in' diet 1 -1 0 diet23*height  68 -68 ;

  ESTIMATE 'wt for diet 1 at 59in' intercept 1 diet 1 0 0 height 59 diet23*height 59  0 ;
  ESTIMATE 'wt for diet 1 at 64in' intercept 1 diet 1 0 0 height 64 diet23*height 64  0 ;
  ESTIMATE 'wt for diet 1 at 68in' intercept 1 diet 1 0 0 height 68 diet23*height 68  0 ;

  ESTIMATE 'wt for diet 2 at 59in' intercept 1 diet 0 1 0 height 59 diet23*height  0 59 ;
  ESTIMATE 'wt for diet 2 at 64in' intercept 1 diet 0 1 0 height 64 diet23*height  0 64 ;
  ESTIMATE 'wt for diet 2 at 68in' intercept 1 diet 0 1 0 height 68 diet23*height  0 68 ;

RUN;
QUIT;
We have omitted the portion of the output that was
the same as that in section 7.1 to save space.
<some output omitted to save space>
                                             Standard
Parameter                    Estimate           Error    t Value    Pr > |t|

diet 1 vs 2 at 59in         29.489844      4.55124555       6.48      <.0001
diet 1 vs 2 at 64in         14.066100      3.71413467       3.79      0.0009
diet 1 vs 2 at 68in          1.727105      4.48561874       0.39      0.7035
wt for diet 1 at 59in      147.933422      3.42212803      43.23      <.0001
wt for diet 1 at 64in      146.049268      2.62823833      55.57      <.0001
wt for diet 1 at 68in      144.541944      3.36143523      43.00      <.0001
wt for diet 2 at 59in      118.443578      3.00047926      39.47      <.0001
wt for diet 2 at 64in      131.983167      2.62433986      50.29      <.0001
wt for diet 2 at 68in      142.814839      2.97010584      48.08      <.0001
We can compare the results here with those of section
5.1 (which also compared groups 1 and 2, but estimated separate slopes for
all three groups). We see that the results are quite consistent, i.e., the
difference between diet groups 1 and 2 are different at 59 inches, 64 inches,
but not at 68 inches.
7.3 Comparing diet groups 2 and 3 when pooling slopes for diet groups 2 and 3
Because we have estimated a common slope for
diet groups 2 and 3, it is
easier to compare diet groups 2 and 3. Since the slopes for these
two groups are parallel, we can compare these two groups at any
value for height and the difference between the regression lines
will remain constant. Hence, to compare diets 2 and 3, we only need diet 0 1
-1 in the estimate statement. To obtain traditional adjusted
means for each diet, you would estimate the adjusted mean at the overall mean value of
height
(in this case 63.13) as shown below.
PROC GLM DATA=htwt2;
  CLASS diet diet23 ;
  MODEL weight = diet height diet23*height ;
  ESTIMATE 'diet 2 vs 3' diet 0 1 -1  ;
  ESTIMATE 'diet 2 at xbar' intercept 1 diet 0 1 0 height 63.13 diet23*height 0 63.13 ;
  ESTIMATE 'diet 3 at xbar' intercept 1 diet 0 0 1 height 63.13 diet23*height 0 63.13 ;
RUN;
QUIT;
We have omitted the portion of the output that was
the same as that in section 7.1 to save space. The
comparison of diets 2 and 3 is significant, and this holds true across all
levels of height. Those in diet group 2 weighed about 108.8 pounds less
than those in diet group 3. For those of average height, the adjusted
mean for diet 2 was 129.6 and for diet 3 was 238.4 (and 129.6 – 238.4 =
-108.8).
                                            Standard
Parameter                   Estimate           Error    t Value    Pr > |t|
diet 2 vs 3              -108.791085      3.73357024     -29.14      <.0001
diet 2 at xbar            129.627279      2.62550857      49.37      <.0001
diet 3 at xbar            238.418364      2.63783571      90.38      <.0001
8. Summary
We have seen that in ANCOVA it is important to test the homogeneity of
regression assumption, and if this assumption is violated we then need to
estimate models that have separate slopes across groups. This amounts to
having an interaction between your covariate and your group variable, which
means that when you estimate differences among the groups, you need to take the
level of the covariate into consideration. One strategy, as illustrated
here, is to look at the effect of your group variable at different levels of
your covariate. In our example, when we compared the control group to
diets 1 and 2, we found that the control group weighed more at 3 different
levels of height (59 inches, 64 inches and 68 inches). However, when we
compared diets 1 and 2, we found diet 2 to be more effective at 59 and 64
inches, but there was no difference at 68 inches. Had we not done this
further investigation, we may have concluded that diet 1 was superior to diet
2 for people of all heights, not realizing that the effectiveness of the diet depended
on height.