
The main seminar page is here.
Introduction
Welcome to the first of three seminars on power analysis
- This is the introductory seminar and will discuss, on a conceptual and
mechanical level, many of the factors that affect power. - We
encourage everyone to review the material in this seminar before moving
onto the intermediate power seminar, as that seminar builds on the material
presented in this one.
Power is the probability of detecting an effect,
given that the effect is really there. In other words, it is the probability of
rejecting the null hypothesis when it is in fact false.
- Example: Drug A and placebo
- run experiment 1000 times, holding everything constant
- If the power was in fact .8, 800 times out of the 1000, we would see a
statistically significant difference between the two groups.
Power is a probability, not a certainty:
just because you have a power of .8 or .9 does not guarantee that you will
obtain a statistically significant result.
Several of reasons why
one might do a power analysis:
- determine the necessary number of subjects needed to detect an effect of
a given size - trying to find the
absolute, bare minimum number of subjects needed in the study is usually not a
good idea (pop quiz at the end of the seminar) - determine power, given an effect size and the number of
subjects available (to decide if you should do the study) - In most cases, there is really no point to conducting a study that is
seriously underpowered. - often required as part of a grant proposal
- often just part of doing good research
- Power analysis as a planning tool: A power analysis is a
good way of making sure that you have thought through every aspect of the study
and the statistical analysis before you start collecting data.
Some limitations of power analysis:
- typically does not generalize very well
- might suggest a number of subjects that is inadequate for the
statistical procedure - Best case scenario: most important
limitation is that a standard power analysis gives you a best case scenario estimate of
the necessary number of subjects needed to detect the effect. In most cases,
this best case scenario is based on assumptions and educated guesses. If any
of these assumptions or guesses are incorrect, you may have less power than you
need to detect the effect. One of the assumptions is that all of the
assumptions of the statistical procedure have been met. - often get a range of the number of subjects needed, not a precise number
- can’t blindly accept the number output by the power analysis program –
more on this later
Power is not the only consideration when determining the necessary sample
size:
- different reasons for conducting an analysis: coefficient different from zero versus precise point estimate
- statistical procedure that is going to be used (maximum likelihood
techniques usually need a large number of subjects) - the representativeness of the sample and the generalizability of the
results (may need a larger N to increase the representativeness and hence
the generalizability of the results) - how many statistical tests will be run on the data set
Most of what is in this presentation does not readily apply to people who
are developing a sampling plan for a survey or psychometric analyses.
Definitions
Before we move on, let s make sure we are all
using the same definitions.
- power is the probability of
detecting a true effect, given that the effect exists - most recommendations for power fall between .8 and .9
- effect size
- the current APA
manual has a list of more than 15 effect sizes - one of the simplest definitions is that an effect size
is the difference of two group means divided by the pooled standard deviation. - example: suppose the mean of the outcome variable
for the drug A group was 10 and it was 5 for the placebo group. If the pooled
standard deviation was 2.5, we would have and effect size which is equal to (10-5)/2.5 = 2 (which is a large
effect size).
- the current APA
- statistically significance versus clinically relevant :
important when estimating effect size for the power analysis - Other definitions that we will need later on include Type I and II
errors and alpha inflation. These are discussed on the main seminar page.
When discussing statistical power, we have four inter-related concepts:
alpha, effect size, sample size and power.
- These four things are related such that each is a function of the other
three. - Increasing alpha (for example, from .01 to .05), effect size or sample
size will increase power. - Not all increases are created equal.
Let’s take a quick look at a standard power graph.
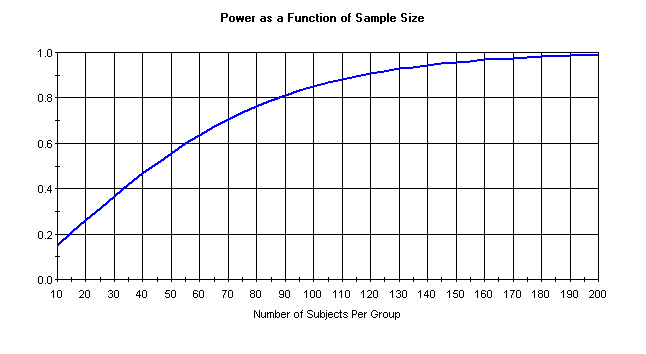
What we like about these kinds of graphs, is that they make clear the diminishing returns
you get for adding more and more subjects.
For example, let s say that we have
only 10 subjects per group. We can see that we have a power of .15, which is
really, really low. We add 50 subjects per group, now we have a power of .6, an
increase of .45. However, if we started with 100 subjects per group (which
would give me a power of about .8) and added 50 per group, we would have a power
of .95, an increase of only .15. So each additional subject gives you less
additional power.
- Going back to our power recommendations, we can see that increasing from
.8 to .9 can be very costly (an additional 30 subjects per group).
Knowing your research project
As we mentioned before, one of the big benefits of doing a power analysis is
making sure that you have thought through every detail of the research project.
In general terms, there are three topic areas that you need to consider when
doing a power analysis.
- substantive area, experimental design issues and statistical
technique- Want to be familiar with the statistical procedure before doing a power
analysis.- Make sure that you can use the necessary software.
- Do your research on experimental design issues, the statistical
technique and software, before you do your research project.
What you need to know to do a power analysis
In this section we will discuss some of the actual quantities that you need
to know to do a power analysis for some simple statistics. The point is to
give
you a flavor of the types of things that you will need to know (or guess at) in
order to be ready for a power analysis.
- For an independent samples t test, you will need to know the population means of the two
groups (or the difference between the means), and the population standard deviations of the
two groups. - We
always recommend that you use several different values, such as decreasing the
difference in the means and increasing the standard deviations, so that you get
a range of values for the number of necessary subjects.
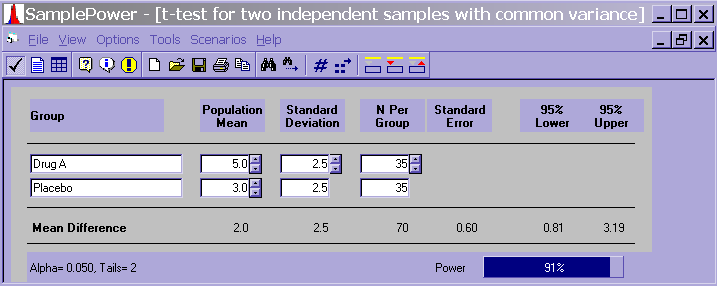
In SPSS Sample Power, we would have a screen that looks like the one below.
- We would need a
total of 70 subjects (35 per group) to have a power of .91 if we had a mean of 5
and a standard deviation of 2.5 in the drug A group, and a mean of 3 and a
standard deviation of 2.5 in the placebo group. - If we decreased the
difference in the means and increased the standard deviations such that for the
drug A group, we had a mean of 4.5 and a standard deviation of 3, and for the
placebo group a mean of 3.5 and a standard deviation of 3 (decrease the
difference in means from 2 to 1 and increase the standard deviation from 2.5
to 3), we would need 190
subjects per group, or a total of 380 subjects, to have a power of .9. - Seemingly small differences in means and standard deviations can
have a huge effect on the number of subjects required.
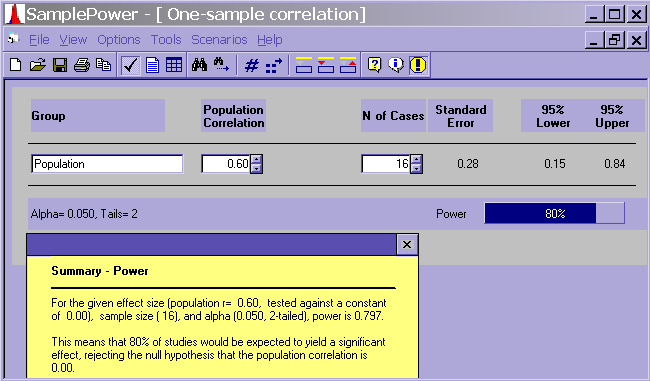
For a correlation, you need to know/guess at the correlation in the
population.
- If you guess that the population correlation is .6, a power analysis
would suggest (with an alpha of .05 and for a power of .8) that you would need
16 subjects. - Correlation is a large N procedure
- N = 16 is pretty low.
- a population correlation of .6 is
pretty high, especially in the social sciences. - the power analysis assumes that all of the assumptions of the
correlation have been met (outliers, restriction of range, linear
relationship between the variables, etc.).
For a chi-square test, you will need to know the proportion positive for
both populations (i.e., rows and columns). Please see the main seminar
page for a description of what is involved here.
For an ordinary least squares regression, you would need to know things like the
R2
for the full and reduced model.
For a simple logistic regression analysis
with only one continuous predictor variable, you would need to know the
probability of a positive outcome (i.e., the probability that the outcome equals
1) at the mean of the predictor variable, and the probability of a positive
outcome at one standard deviation above the mean of the predictor variable.
Obtaining the necessary numbers to do a power analysis
There are at least three ways to guestimate the values that are needed to do
a power analysis: a literature review, a pilot study and using Cohen s
recommendations.
- pros and cons of each of these three methods
- focus on determining effect size
Literature review:
- Similar studies
- meta-analysis to get a robust effect size
Limitations to a literature review:
- oftentimes there are no studies similar enough to your study to get a
good estimate of the effect size
Pilot studies:
- rough estimate of the effect size, as well as a rough estimate of the
variability in your measures - ideas about where missing data might occur, and hopefully ideas about
how to minimize the amount of missing - identify coding problems, setting up the data base, and inputting the
data for a practice analysis
Limitations to the information that you can get from a pilot study:
- When
estimating effect sizes based on nonsignificant results, the effect size
estimate will necessarily have an increased error (not a very precise estimate). - The effect size estimate that you obtain may be unduly influenced by
some peculiarity of the small sample.
Despite these limitations, we strongly
encourage researchers to conduct a pilot study.
- The opportunity to identify and
correct bugs before collecting the real data is often invaluable. - Because of the number of values that need to be guestimated in a power
analysis, the precision of any one of these values is not that important.
If you can estimate the effect size to within 10% or 20% of the true value,
that is probably sufficient for you to conduct a meaningful power analysis.
Cohen s
recommendations:
Many researchers (including Cohen) consider the use of such
recommendations as a last resort, when a thorough literature review has
failed to reveal any useful numbers and a pilot study is not possible or
feasible.– Small effect: 1% of the variance; d = 0.25 (too small to detect other
than statistically; lower limit of what is clinically relevant)– Medium effect: 6% of the variance; d = 0.5 (apparent with careful
observation)– Large effect: at least 15% of the variance; d = 0.8 (apparent with a
superficial glance; unlikely to be the focus of research because it is too
obvious)
- According to Keppel and Wickens (2004), when you
really have no idea what the effect size is, go with the smallest effect size of
practical value. In other words, you need to know how small of a
difference is meaningful to you. - Research suggests that most researchers are overly optimistic about the
effect sizes in their research, and that most research studies are under
powered.
Factors that affect power
From the preceding discussion, you might be
starting to think that the number of subjects and the effect size are the most important factors, or
even the only factors, that affect power.
- There are at least a dozen other factors that can influence the power of a study, and
many of these factors should be considered not only from the point of doing a
power analysis, but also as part of doing good research. - The first couple
of factors that we will discuss are more "mechanical" ways of increasing power
(e.g., alpha level, sample size and effect size).
After that, the discussion will turn to more methodological issues that affect
power.
1. Alpha level: One obvious way to increase your power is to
increase your alpha (from .05 to say, .1). This might be more appropriate
for a pilot study rather than the actual study. Reducing alpha from .05 to
.01 reduces power (crude attempt to ensure that results are clinically relevant).
2. Sample size: A second obvious way to increase power is simply
collect data on more subjects. Subjects can be "expensive"; add some to
the control group.
3. Effect size: Another obvious way to increase your power is to
increase the effect size (often by increasing the experimental manipulation).
4. Experimental task: If you can not increase the
experimental manipulation, perhaps you can change the experimental task, if
there is one.
5. Response variable: How you measure your
response variable(s) is just as important as what task you have the subject
perform. You want to use a measure that is as high in sensitivity and low in
measurement error as is possible. Minimizing the measurement error in your predictor variables will also help
increase your power. Modify the procedure so that all instructions are
clear and question are unambiguous to all subjects. Use direct instead of
indirect measures. While multiple DV’s are very good methodologically and provides marked benefits for
certain analyses and missing data, it does complicate the power analysis.
The next seminar will discuss this issue.
6. Experimental design: Another thing to consider is that some
types of experimental designs are more powerful than others (repeated measures).
7. Groups: Another point to consider is the number and types of
groups that you are using. Drug example with 4 groups: placebo, low dose,
medium dose and high dose. Reduce the number of groups and/or make
comparisons among the extremes. May affect generalizability.
8. Statistical procedure: Changing the type of statistical
analysis may also help increase power, especially when some of the assumptions
of the test are violated.
- Maxwell and Delaney (2004) noted that
Even when ANOVA is robust, it may not provide the most powerful test available
when its assumptions have been violated. In particular, violations of
assumptions regarding independence, normality and heterogeneity can reduce power.
In such cases, nonparametric alternatives may be more powerful. - You have to know about the statistical procedure and its assumptions.
9. Statistical model: You can also modify the
statistical model. For example, interactions often require more power than main
effects; if you don’t have much power, you may need to use a main effects model.
Consider using covariates or blocking variables. Ideally, both covariates
and blocking variables reduce the variability in the response variable, but
these kinds of variables can be difficult to find.
10. Modify response variable: Besides modifying your statistical
model, you might also try modifying your response variable. Possible
benefits of this strategy include reducing extreme scores and/or meeting the
assumptions of the statistical procedure. Categorizing the response
variable can be problematic.
11. Purpose of the study: Different researchers have different
reasons for conducting research. Drug A example: estimate different
from 0 versus precise point estimate.
- Tversky and
Kahneman (1971) pointed out that we often need more subjects in a replication
study than were in the original study. They also noted that researchers are often too optimistic
about how much power they really have. - Most power analysis programs do not take into account the purpose of the
study; rather, they assume that you are trying to determine if the estimate
is different from 0. - Tversky and
Kahneman also claim that researchers too readily assign causal
reasons to explain differences between studies, instead of sampling error.
They also mentioned that researchers
tend to underestimate the impact of sampling and think that results will
replicate more often than is the case.
12. Missing data: A final point that we would like to make here
regards missing data. Do everything possible to minimize missing data. Casewise deletion,
which is the default setting in most statistical packages, is one of the biggest contributors
to loss of power. Poor imputation methods can greatly reduce power.
Conclusions:
- Most of these issues are not black and white .
- There is a close relationship between the experimental design, the statistical
analysis and power.
Cautions about small sample sizes and sampling variation
Issues that frequently arise when using small samples:
- Considerations of time and effort argue for
running as few subjects as possible versus difficulties associated
with small sample sizes - One obvious problem with small sample sizes is that
they have low power. This means that you need to have a large effect size
to detect anything. - You will also have fewer options with respect to
appropriate statistical procedures, as many common procedures, such as
correlations, logistic regression and multilevel modeling, are not appropriate with small
sample sizes. - One is also more likely to violate the assumptions of the
statistical procedure that is used (especially assumptions like normality). In most
cases, the statistical model must be smaller when the data set is small. - Interaction terms, which often test interesting hypotheses, are frequently the
first casualties. - Generalizability of the results may also be comprised.
- Missing data are also more problematic; there are a reduced number of imputations methods
available to you, and these are not considered to be desirable imputation
methods (such as mean imputation).
Sampling variation:
- While the issue of sampling
variability is relevant to all research, it is especially relevant to studies
with small sample sizes.- To quote Murphy and Myors (2004, page 59), The lack of
attention to power analysis (and the deplorable habit of placing too much weight
on the results of small sample studies) are well documented in the literature,
and there is no good excuse to ignore power in designing studies.
- To quote Murphy and Myors (2004, page 59), The lack of
- In an early
article entitled The Law of Small Numbers, Tversky and Kahneman (1971) stated
that many researchers act like the Law of Large Numbers applies to small
numbers. People often believe that small samples are more representative of the
population than they really are.
Underpowered studies:
- There is usually no point to conducting an
underpowered study. - Underpowered studies can cause chaos in the literature because studies
that are similar methodologically may report conflicting results.
Software
We will briefly discuss some of the programs
that you can use to assist you with your power analysis. Most programs are
fairly easy to use, but you still need to know effect sizes, means, standard
deviations, etc.
- Specialty packages: SPSS Sample Power, PASS and Optimal Design
- General use packages: SAS proc power and Stata sampsi, user
written commands, Statistica add-on module - free programs on the web
- Mplus
Multiplicity
This issue of multiplicity arises when a researcher has more than one outcome
of interest in a given study.
- While it is often good methodological
practice to have more than one measure of the response variable of interest,
additional response variables mean more statistical tests need to be conducted
on the data set, and this leads to question of experimentwise alpha control. - Example: Drug A and placebo
- The
question is how to control the Type I error (AKA false alarm) rate. Most
researchers are familiar with Bonferroni correction, which calls for dividing
the prespecified alpha level (usually .05) by the number of tests to be
conducted. In our example, we would have .05/3 = .0167. Hence, .0167
would be our new critical alpha level, and statistics with a p value greater
than .0167 would be classified as not statistically significant. - It is
well-known that the Bonferroni correction is very conservative, so in our next
seminar, we will discuss other ways of adjusting the alpha level.
Afterthoughts: A post-hoc power analysis
Just say "No!" to post-hoc analyses. There are many reasons, both
mechanical and theoretical, why good researchers should not do post-hoc power
analyses.
- Excellent summaries can be found in Hoenig and Heisey (2001) The Abuse of Power: The Pervasive Fallacy of Power Calculations for
Data Analysis and Levine and Ensom (2001) Post Hoc Power Analysis: An Idea
Whose Time Has Passed?. - As Hoenig and Heisey show, power is mathematically
directly related to the p-value; hence, calculating power once you know the
p-value associated with a statistic adds no new information. - Furthermore,
as Levine and Ensom clearly explain, the logic underlying post-hoc power
analyses is fundamentally flawed.
How good was your guess about the means and standard deviations of your
variables? If the variability in your measures is substantially higher
than you thought, you may want to use different measures in future research.
Conclusions
- Conducting research is kind of like buying a car.
- Don’t be afraid of what you don’t know. Get in there and try it BEFORE you collect your
data. - Power analysis = planning (for all things)
- Correcting things is easy at this stage; after you collect your data, all
you can do is damage control. - UCLA researchers are always welcome
and strongly encouraged to come into our walk-in consulting and discuss their
research before they begin the project.
The take-home message from
this seminar is do your research before you do your research.