Version info: Code for this page was tested in R Under development (unstable) (2012-07-05 r59734)

 On: 2012-08-08

With: knitr 0.6.3
There are times when you want to do correspondence analysis and the data have been
collapsed into a summary with counts for each of the categories. For example, here is a text table
with the number of degrees given in 12 disciplines over eight different years.
degrees <- read.table(text = "
disc   v60  v65  v70  v71  v72  v73  v74  v75
Eng    794 2073 3432 3495 3475 3338 3144 2959
Math   291  685 1222 1236 1281 1222 1196 1149
Phy    530 1046 1655 1740 1635 1590  134 1293
Chem  1078 1444 2234 2204 2011 1849 1792 1762
Earth  253  375  511  550  580  577  570  556
Bio   1245 1963 3360 3633 3580 3636 3473 3498
Agri   414  576  803  900  855  853  830  904
Psych  772  954 1888 2116 2262 2444 2587 2749
Soc    162  239  504  583  638  599  645  680
Econ   341  538  826  791  863  907  833  867
Anth    69   82  217  240  260  324  381  385
Oth    314  502 1079 1392 1500 1609 1531 1550",
  row.names = 1, header = TRUE)

## print the data frame
degrees
##        v60  v65  v70  v71  v72  v73  v74  v75
## Eng    794 2073 3432 3495 3475 3338 3144 2959
## Math   291  685 1222 1236 1281 1222 1196 1149
## Phy    530 1046 1655 1740 1635 1590  134 1293
## Chem  1078 1444 2234 2204 2011 1849 1792 1762
## Earth  253  375  511  550  580  577  570  556
## Bio   1245 1963 3360 3633 3580 3636 3473 3498
## Agri   414  576  803  900  855  853  830  904
## Psych  772  954 1888 2116 2262 2444 2587 2749
## Soc    162  239  504  583  638  599  645  680
## Econ   341  538  826  791  863  907  833  867
## Anth    69   82  217  240  260  324  381  385
## Oth    314  502 1079 1392 1500 1609 1531 1550
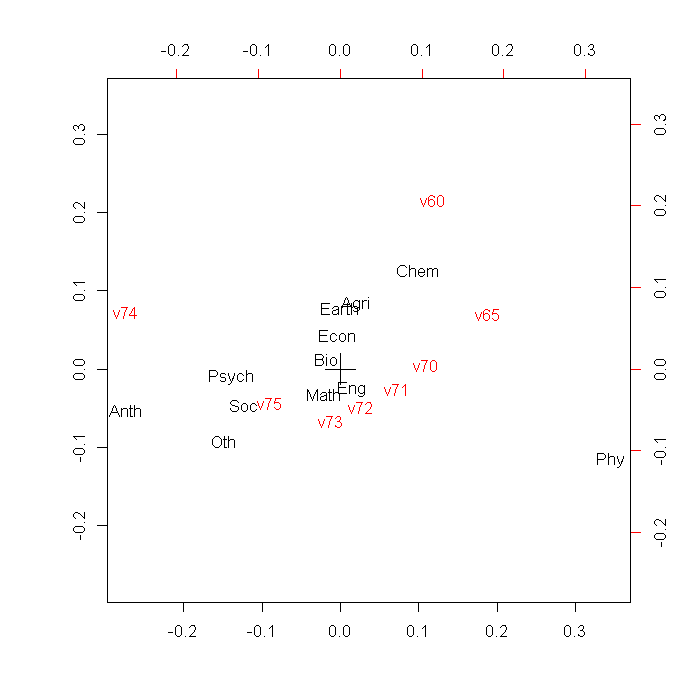
Now, we will run the actual correspondence analysis using the corresp() functions
from the MASS package. This will be followed by the biplot() function.
library(MASS)

corresp(degrees)
## First canonical correlation(s): 0.127
##
##  Row scores:
##      Eng     Math      Phy     Chem    Earth      Bio     Agri    Psych
##  0.11919 -0.16049  2.73374  0.79224  0.00146 -0.14336  0.16112 -1.09433
##      Soc     Econ     Anth      Oth
## -0.96228 -0.02684 -2.15293 -1.16465
##
##  Column scores:
##     v60     v65     v70     v71     v72     v73     v74     v75
##  0.9020  1.4345  0.8278  0.5481  0.1992 -0.0903 -2.0635 -0.6783
biplot(corresp(degrees, nf = 2))