
1. Introduction
This module will explore missing data in SPSS, focusing
on numeric missing data. We will describe how to indicate missing data in your raw data
files, how missing data are handled in SPSS procedures, and how to handle missing data in a
SPSS data transformations. There are two types of missing values in SPSS: 1)
system-missing values,
and 2) user-defined missing values. We will demonstrate reading data containing each kind of missing value.
Both data sets are identical except for the coding of the missing values. For both data sets,
suppose we did a reaction time study with 6 subjects, and the subjects
reaction time was measured three times.
2. System-missing values
System-missing
values are values automatically recognized as missing by SPSS.
You might notice that some of the reaction times are left blank in the data below. That is
the accepted way of indicating system missing data in the data set.
For example, for subject 2, the second trial is blank.
The only way to read raw data with fields left blank is with fixed field input.
The values left blank automatically are treated as system-missing values.
Note:
It is possible to hold the missing place with a single dot in the field, but if you do
you will get a warning message each time SPSS encounters one of these values. The resulting
variable is coded with system-missing values.
DATA LIST FIXED/
  id 1 trial1 3-5 (1) trial2 6-8 (1)
       trial3 11-13 (1).

BEGIN DATA .
1 1.5 1.4 1.6
2 1.5     1.9
3     2.0 1.6
4         2.2
5 2.1 2.3 2.2
6 1.8 2.0 1.9
END DATA .

LIST .
One reason for missing data might be that the equipment
failed for that trial was missing.
The result of the list follows, notice that SPSS marks
system-missing values with a dot in the listing.
There is a dot everywhere in the listing that there was a
blank in the data.
ID TRIAL1 TRIAL2 TRIAL3

 1   1.5    1.0    1.6
 2   1.5     .     1.9
 3    .     2.0    1.6
 4    .      .     2.2
 5   2.1    2.0    2.2
 6   1.8    2.0    1.9

Number of cases read:  6    Number of cases listed:
3. User-defined missing values
User-defined
missing
values are numeric values that need to be defined as missing for SPSS.
You might notice that some of the reaction times are -9 in the data below.
You may use any value you choose to stand for a missing value, but be careful that you
don’t choose a value for missing that already exists for the variable in the data set.
For that reason many people choose negative numbers or large numbers to represent
missing values.
For example, for subject 2, the second trial is -9.
You may read raw data with user-missing values either as fixed field input or
as free field input. We will read it as free field input in this example.
When defined as such on a missing values command these values of -9 are treated as
user-missing
values.
DATA LIST FREE/
      id trial1 trial2 trial3 .
MISSING VALUES trial1 TO trial3 (-9).
COMPUTE  trialr1=trial1.
COMPUTE  trialr2=trial2.
COMPUTE  trialr3=trial3.
VARIABLE LABELS trial1 "Trial 1 User Miss"
                   trialr1 "Trial 1 Sys Miss".

BEGIN DATA .

1 1.5 1.4 1.6
2 1.5  -9 1.9
3  -9 2.0 1.6
4  -9  -9 2.2
5 2.1 2.3 2.2
6 1.8 2.0 1.9
END DATA .

LIST .
The compute command is used to create the new variables trialr1
through trialr3, which will contain
system-missing values where there were user-defined missing values
in the original variables.
User-defined missing values on the original variable become
system-missing values on the
new variables.
The result of the list follows, notice that SPSS marks
user-missing values with a -9 in the listing.
There is a -9 everywhere in the listing that there was a
-9 in the data, so the value of the user-defined missing is
preserved for the original variables ().
  ID   TRIAL1   TRIAL2   TRIAL3  TRIALR1  TRIALR2  TRIALR3

1.00     1.50     1.40     1.60     1.50     1.40     1.60
2.00     1.50    -9.00     1.90     1.50      .       1.90
3.00    -9.00     2.00     1.60      .       2.00     1.60
4.00    -9.00    -9.00     2.20      .        .       2.20
5.00     2.10     2.30     2.20     2.10     2.30     2.20
6.00     1.80     2.00     1.90     1.80     2.00     1.90

Number of cases read:  6    Number of cases listed:  6
Let’s examine how SPSS handles missing data in analysis commands.
4. How SPSS handles missing data in analysis commands
As a general rule, SPSS analysis commands that perform
computations handle missing data by omitting the missing values. (We say analysis
commands to indicate that we are not addressing commands like sort.)
The way that missing values are eliminated is not always the same among SPSS
commands, so let’s us look at some examples. First, use the descriptives
command
on our data file and see how this command handles the missing values.
DESC
  /VAR= trial1 trial2 trial3
        trialr1 trialr2 trialr3.
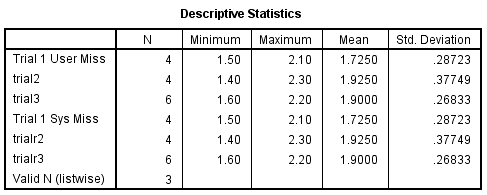
As you see in the output below, descriptives computed the
means using four observations for trial1 and trial2
and six observations for trial3. In short, descriptives used all of the valid
data and performed the computations on all of the available data.
This was also true for the next three variables containing user-missing values.
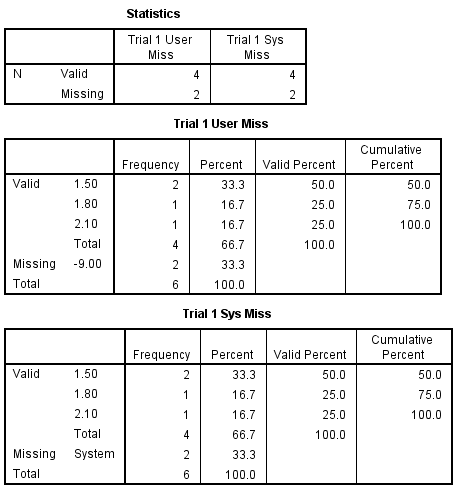
As you see below, frequencies likewise performed its
computations using just the available data. Note that the percentages are computed based
on just the total number of non-missing cases.
But the missing values do appear in the tables and they are marked as missing.
This is true for both types of missing values.
FREQ
  /VAR= trial1 trialr1 .
It is possible that you might want the valid percentages
to be computed on the total number of values, and even report the percentage missing
in the table itself. You can request this using the missing=include
subcommand on the freq command. This is shown below for
trial1 and trialr1.
FREQ
  /VAR= trial1 trialr1
  /MISSING= INCLUDE.
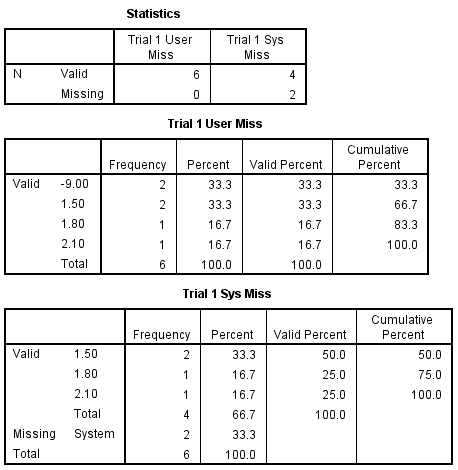
As you see, now the valid percentages are computed out of the
total number of observations, and the percentage missing are shown right in the table as
well for the variable trial1 which contained user-missing values.
For trialr1, the
system-missing values are not used to compute percents even with
missing=include specified.
The crosstabs command only includes valid (non-missing data) in
its tables. Cases containing a missing value
for even one of the variables are not included in the table.
Note that the percentages are computed based
on just the non-missing cases.
This is true for both types of missing values.
CROSS
  /TAB= trial1 BY trial2 / trialr1 BY trialr2.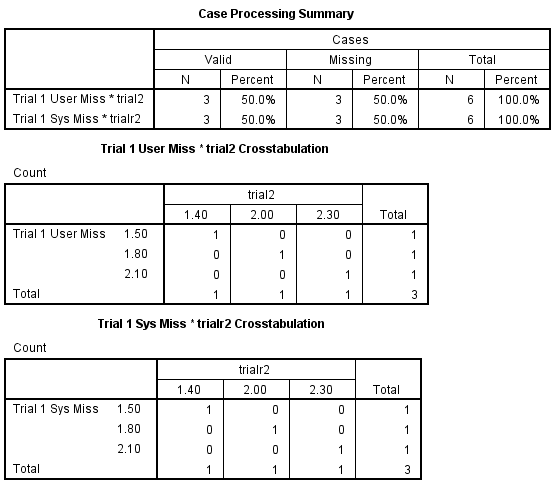
It is possible that you might want the missing values included in the tables.
This is especially true when you are using crosstabs to verify
your transformations.
You can request this using the missing=include
subcommand on the crosstabs command. This is shown below for
trial1 and trialr1.
Here again, you will only be successful for user-missing values.
CROSS
  /TAB= trial1 BY trial2 / trialr1 BY trialr2
  /MISSING= INCLUDE.
The user-missing values are
included in the table for the variable trial1.
For trialr1, the
system-missing values are not included in the table even with
missing=include specified. There is no subcommand that
will enable the inclusion of system-missing values in the
crosstabs table.
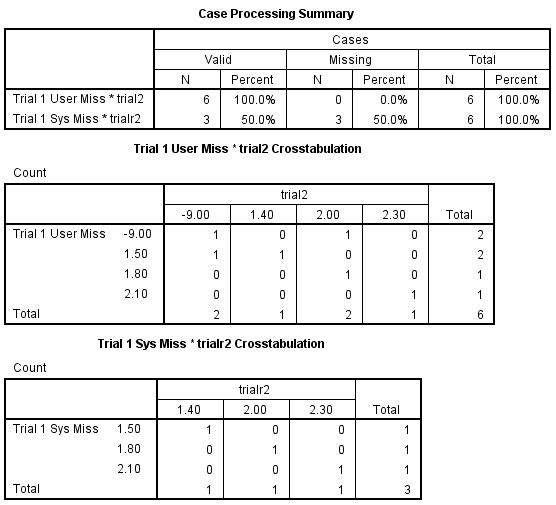
There is no way to get a system missing value to
appear in a crosstabs table. The closest you will come is to change the
system-missing value
to a user-missing value.
This can be accomplished with a recode command, as is shown below.
The keyword sysmis can be used on the recode command, and it stands for the system-missing value.
RECODE trialr1 trialr2
           (SYSMIS=-1) (ELSE=COPY)
            INTO trialb1 trialb2 .
MISSING VALUES trialb1 trialb2 (-1).

CROSS
  /TAB= trialb1 BY trialb2
  /MISSING= INCLUDE.
Let’s look at how corr handles
missing data. We would expect that it would do the computations based on the available
data, and omit the missing values for each pair of variables.
Because two variables are necessary to compute each correlation.
Here is an example program.
CORR
  VAR trial1 trial2 trial3 .
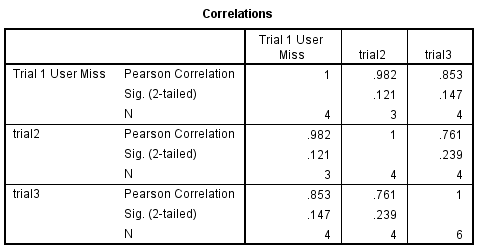
The output of this command is shown
below. Note how the missing values were excluded. For each pair
of variables, corr used the number of pairs that had valid data. For
the pair formed by trial1 and trial2, there were three pairs with valid
data. For the pairing of trial1 and trial3 there were four valid pairs,
and likewise there were four valid pairs for trial2 and trial3.
Since this used all of the valid pairs
of data, this is often called pairwise deletion of missing data.
It is possible to specify that the
correlations run only on observations that had complete data for all of the variables listed on the
var subcommand.
You might want the correlations of the reaction times just for
the observations that had non-missing data on all of the trials. This is called
listwise
deletion of missing data meaning that when any of the variables are missing, the
entire observation is omitted from the analysis. You can request listwise deletion
within corr with the mssing=listwise subcommand,
as shown in the example below.
CORR
  /VAR= trialr1 trialr2 trialr3
  /MISSING=LISTWISE.
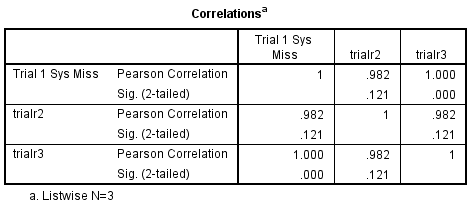
As you see in the results below, the N for all the
simple statistics is the same, 3, which corresponds to the number of cases with complete
non-missing data for trial1, trial2 and trial3. Since the N is the same for all of the
correlations (i.e., 3), the N is not displayed along with the correlations in SPSS 7.5
and higher.
5. Summary of how missing values are handled in SPSS analysis commands
It is important to understand how SPSS commands
used to analyze data treat
missing data. To know how any one command handles missing data, you
should consult the SPSS manual. Here is a brief overview of how some common SPSS procedures
handle missing data.
- DESCRIPTIVES
For each variable, the number of non-missing values are used.
You can specify the missing=listwise subcommand to exclude data
if there is a missing value on any variable in the list.- FREQUENCIES
By default, missing values are excluded and percentages are based on the number of
non-missing values. If you use the missing=listwise subcommand
on the frequencies
command, the percentages are based on the total number of non-missing and
user-missing values and the percentage of user-missing values
are reported in the table.- CORRELATIONS
By default, correlations are computed based on the number of pairs with non-missing data (pairwise
deletion of missing data). The missing=listwise subcommand
can be used on the corr command to request that
correlations be computed only on observations
with complete valid data for all variables on the var subcommand
(listwise deletion of missing data).- REGRESSION
If values of any of the variables on the var subcommand
are missing, the entire case is excluded from the analysis (i.e., listwise deletion of missing
data).
It is possible to further control the treatment of missing data with the
missing subcommand
and one of the following keywords: pairwise, meansubstitution,
or include.- FACTOR
Cases with missing values are deleted listwise, i.e., observations with missing
values on any of the variables in the analysis are omitted from the analysis.- ANOVA
Cases with any missing value are excluded from any single complete ANOVA design in which
the missing value is encountered. It is possible to specify more than one
ANOVA design
with a single anova command.- For other commands, see the SPSS manual for information on how missing data
are handled.
6. Missing values in assignment expressions
An assignment expression may appear on a compute or an if command.
It is important to understand how missing values are
handled in assignment statements. Consider the example shown below.
COMPUTE  avg = (trial1 + trial2 + trial3) / 3 .
COMPUTE  avgr = (trialr1 + trialr2 + trialr3) / 3 .

LIST
   /VAR = trial1 TO trial3 avg.
LIST
   /VAR = trialr1 TO trialr3 avgr.
The list below illustrates how
missing values are handled in assignment statements. The variable avg
is based on the
variables trial1 trial2 and trial3,
and the variable avgr
is based on the
variables trialr1 trialr2 and trialr3. If
any of the component variables were missing, the value for avg or
avgr was set to
missing. This means that both were missing for observations 2, 3 and 4.
  TRIAL1   TRIAL2   TRIAL3      AVG

    1.50     1.40     1.60     1.50
    1.50    -9.00     1.90      .
   -9.00     2.00     1.60      .
   -9.00    -9.00     2.20      .
    2.10     2.30     2.20     2.20
    1.80     2.00     1.90     1.90

Number of cases read:  6    Number of cases listed:  6

 TRIALR1  TRIALR2  TRIALR3     AVGR

    1.50     1.40     1.60     1.50
    1.50      .       1.90      .
     .       2.00     1.60      .
     .        .       2.20      .
    2.10     2.30     2.20     2.20
    1.80     2.00     1.90     1.90

Number of cases read:  6    Number of cases listed:  6
Both system-missing and user-defined missing values
yield the same results.
As a general rule, computations involving missing values yield missing
values, as shown below.
2 + 2 yields 4
2 + . yields .
2 / 2 yields 1
. / 2 yields .
2 * 3 yields 6
2 * . yields .
Whenever you add, subtract, multiply divide etc., values
that involve missing data, the result is usually system-missing.
An exception is a value that is defined regardless of one of the values, for example
zero divided by missing is zero.
In our reaction time experiment, the average reaction
time avg is missing for thee out of six cases. We could try just averaging the
data for the non-missing trials by using the mean function as shown in the example
below.
COMPUTE  avg = MEAN(trial1, trial2, trial3) .
COMPUTE  avgr = MEAN(trialr1, trialr2, trialr3) .

LIST
   /VAR = trial1 TO trial3 avg.

LIST
   /VAR = trialr1 TO trialr3 avgr.
The results below show that avg now
contains the average of the non-missing trials, even if there is only one.
  TRIAL1   TRIAL2   TRIAL3      AVG

    1.50     1.40     1.60     1.50
    1.50    -9.00     1.90     1.70
   -9.00     2.00     1.60     1.80
   -9.00    -9.00     2.20     2.20
    2.10     2.30     2.20     2.20
    1.80     2.00     1.90     1.90

Number of cases read:  6    Number of cases listed:  6

 TRIALR1  TRIALR2  TRIALR3     AVGR

    1.50     1.40     1.60     1.50
    1.50      .       1.90     1.70
     .       2.00     1.60     1.80
     .        .       2.20     2.20
    2.10     2.30     2.20     2.20
    1.80     2.00     1.90     1.90

Number of cases read:  6    Number of cases listed:  6
Had there been a large number of trials, say 50 trials,
then it would be annoying to have to type
avg = mean(trial1, trial2, trial3 …. trial50)
Here is a shortcut you could use in this kind of situation
avg = mean(trial1 to trial50)
providing that the trial variables are contiguous in the file.
Also, if we wanted to get the sum of the times instead
of the average, then we could just use the sum function instead of the
mean
function. The syntax of the sum function is just like the mean
function, but it returns the sum of the non-missing values.
Finally, you can use the nvalid function to
determine the number of non-missing values in a list of variables, as illustrated below.
COMPUTE  n = NVALID(trial1, trial2, trial3).

LIST
   /VAR = trial1 TO trial3 avg n.
As you see below, observations 1, 5 and 6 had three valid
values, observations 2 and 3 had two valid values, and observation 4 had only
one valid value.
These results are the same regardless of the type of missing value.
  TRIAL1   TRIAL2   TRIAL3      AVG        N

    1.50     1.40     1.60     1.50     3.00
    1.50    -9.00     1.90     1.70     2.00
   -9.00     2.00     1.60     1.80     2.00
   -9.00    -9.00     2.20     2.20     1.00
    2.10     2.30     2.20     2.20     3.00
    1.80     2.00     1.90     1.90     3.00

Number of cases read:  6    Number of cases listed:  6
You might feel uncomfortable with the variable avg
for observation 4 since it is not really an average at all. We can use the
mean.n form of the function to control the number of valid
values required to compute a mean.
COMPUTE avg = MEAN.2(trial1 TO trial3).

LIST
   /VAR = trial1 TO trial3 avg n.
The mean.2 function requires at least two valid values for a mean to be calculated.
In the output below, you see that avg
now contains the average reaction time for the non-missing values, except for observation
4 where the value is assigned to missing because it had only one valid observation.
  TRIAL1   TRIAL2   TRIAL3      AVG        N

    1.50     1.40     1.60     1.50     3.00
    1.50    -9.00     1.90     1.70     2.00
   -9.00     2.00     1.60     1.80     2.00
   -9.00    -9.00     2.20      .       1.00
    2.10     2.30     2.20     2.20     3.00
    1.80     2.00     1.90     1.90     3.00
7. Missing values in recoding commands
Using IF.
Suppose you wanted to create a dummy variable from trial1
with a cutpoint of 2.
We can use the if command to create the variable hit1.
The same is true for creating hirt1 from trialr1.
IF trial1  > 2    hit1 = 1.
IF trial1 <= 2    hit1 = 0.

IF trialr1  > 2    hirt1 = 1.
IF trialr1 <= 2    hirt1 = 0.

VARIABLE LABELS hit1  "Tran T1 User Miss"
                hirt1 "Tran T1 Sys Miss".

FREQ
  /VAR= hit1 hirt1.
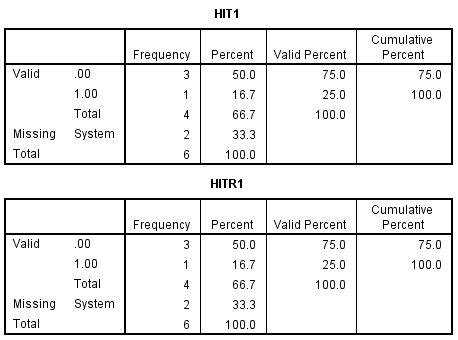
The frequencies shows the result of
these transformations as they affect the missing values.
Both system-missing and user-defined missing values
result in correct classification.
Now, suppose you wanted to create a dummy variable from trial1
in combination with trial2
with a cutpoint of two for each.
We can use the if command to create the variable hit12.
The same is true for creating hirt12 from trialr1 and
trialr2.
IF trial1  > 2  and trial2>2       hit12 = 1.
IF not(trial1  > 2  and trial2>2)  hit12 = 0.

VARIABLE LABELS hit12  "Tran T1 AND T2".

FREQ
  /VAR= hit12 .

LIST
    /VAR = trial1 trial2 hit12.
The frequencies and list shows the result of
these transformations as they affect the missing values.
Both system-missing and user-defined missing values
result in the same output, so only the output for user-defined missing values
will be shown.
  TRIAL1   TRIAL2    HIT12

    1.50     1.40      .00
    1.50    -9.00      .00
   -9.00     2.00      .00
   -9.00    -9.00      .
    2.10     2.30     1.00
    1.80     2.00      .00
There is only one missing value in the created variable hit12,
but we know that there are at least two missing values for trial1
alone.
If SPSS can resolve the logic based on a single variable, then it will.
Since not(trial1 > 2 and trial2>2) is true if either of the conditions
is false, this can be resolved. This is the result that most people would prefer.
If you prefer to have the result missing if either of the component variables are
missing then that can be accomplished by adding the
following if command. As is shown by the results of the
frequencies and list commands.
IF MISSING(trial1) OR MISSING(trial2)
          hit12 = $SYSMIS.

FREQ
  /VAR= hit12 .

LIST
    /VAR = trial1 trial2 hit12.
Note that the missing function is evaluated as
true if the variable in the argument contains any kind of
missing value. If you are exclusively concerned with
system-missing values you may want to use the
sysmis function.
Consider the following results. Any missing value for
one of the component variables results in a missing
for hit12 .
  TRIAL1   TRIAL2    HIT12

    1.50     1.40      .00
    1.50    -9.00      .
   -9.00     2.00      .
   -9.00    -9.00      .
    2.10     2.30     1.00
    1.80     2.00      .00
Using RECODE
The recode command can be used to accomplish the dummy coding task discussed
at the beginning of the section. Once again,
suppose you wanted to create a dummy variable from trial1
with a cutpoint of 2. We can use the recode command to create the variable hit1.
The same is true for creating hirt1 from trialr1. However, this command functions differently with respect to
system-missing and user-defined missing values.
RECODE trial1  (LO THRU 2=0)
               (2 THRU HI=1) INTO  hi2t1.

RECODE trialr1 (LO THRU 2=0)
               (2 THRU HI=1) INTO  hi2rt1.

VARIABLE LABELS hi2t1  "Tran T1 User Miss"
                hi2rt1 "Tran T1 Sys Miss".

FREQ
  /VAR= hi2t1 hi2rt1.
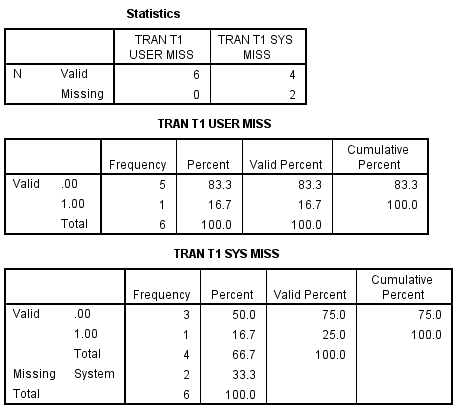
The frequencies shows the result of
these transformations as they affect the missing values.
The answer is correct with respect to system-missing values and
incorrect with respect to user-missing values.
The user-defined missing values are classified according to
their value, as if they were not missing.
Now we can examine recode with the else keyword.
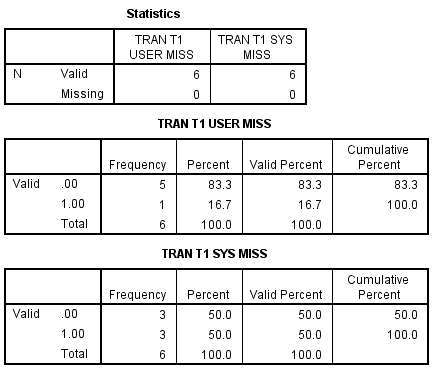
This affects both
system-missing and user-defined missing values the same,
but unfortunately neither are correct. The else keyword
will include both types of missing values, and mis-classify them.
RECODE trial1  (LO THRU 2=0)
               (ELSE=1) INTO  hi3t1.

RECODE trialr1 (LO THRU 2=0)
               (ELSE=1) INTO  hi3rt1.

VARIABLE LABELS hi3t1  "Tran T1 User Miss"
                hi3rt1 "Tran T1 Sys Miss".

FREQ
  /VAR= hi3t1 hi3rt1.
The frequencies result follows.
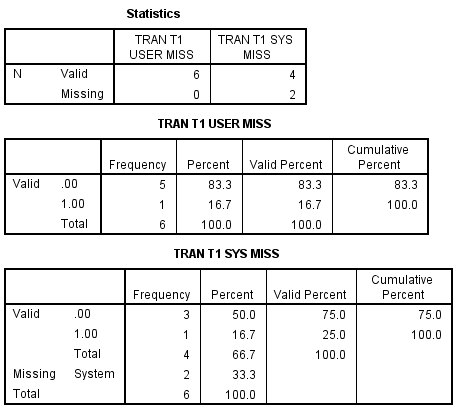
If we add the (missing=sysmis) to the recode
the problem is alleviated for system-missing ,
but not for user-defined missing values.
RECODE trial1  (LO THRU 2=0) (MISSING=SYSMIS)
               (ELSE=1) INTO  hi4t1.

RECODE trialr1 (LO THRU 2=0) (MISSING=SYSMIS)
               (ELSE=1) INTO  hi4rt1.

VARIABLE LABELS hi4t1  "Tran T1 User Miss"
                hi4rt1 "Tran T1 Sys Miss".

FREQ
  /VAR= hi4t1 hi4rt1.
The frequencies result follows.
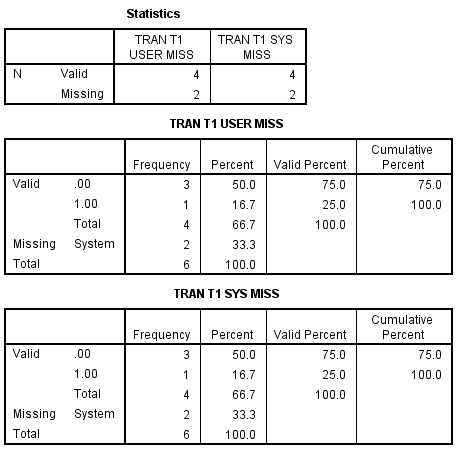
Changing the order of (missing=sysmis) and (lo thru 2=0) alleviates the problem for
user-defined missing too.
RECODE trial1  (MISSING=SYSMIS) (LO THRU 2=0)
               (ELSE=1) INTO  hi5t1.

RECODE trialr1 (MISSING=SYSMIS) (LO THRU 2=0)
               (ELSE=1) INTO  hi5rt1.

VARIABLE LABELS hi5t1  "Tran T1 User Miss"
                hi5rt1 "Tran T1 Sys Miss".

FREQ
  /VAR= hi5t1 hi5rt1.
The frequencies result follows.
8. Problems to look out for
- When creating or recoding variables,
it is always good practice to test the resulting variables, especially for missing
values. - The type of missing value can make a difference in
recode results, and in most cases sytem missing values are more likely to yield the
correct results. - Be aware how the use of and and or
work with the if command, as the expression is evaluated, and
if a logical conclusion can be made, it will be made. This happens even
though one or more of the component variables may be missing.
9. For more information
- See Subsetting data in SPSS for
information about subsetting data with variables that are missing. - For more information about missing values, see
the SPSS Command Syntax Reference Guide .