
Weighted least squares provides one method for dealing with heteroscedasticity. The wls0
command can be used to compute various WLS solutions. You can
download wls0 over the internet by typing search wls0 (see
How can I use the search command to search for programs and get additional
help? for more information about using search).
Let’s use an example dataset that exhibits heteroscedasticity, hetdata.
use https://stats.idre.ucla.edu/stat/stata/ado/analysis/hetdata, clearregress exp age ownrent income incomesq
Source | SS df MS Number of obs = 72
-------------+------------------------------ F( 4, 67) = 5.39
Model | 1749357.01 4 437339.252 Prob > F = 0.0008
Residual | 5432562.03 67 81083.0153 R-squared = 0.2436
-------------+------------------------------ Adj R-squared = 0.1984
Total | 7181919.03 71 101153.789 Root MSE = 284.75------------------------------------------------------------------------------
exp | Coef. Std. Err. t P>|t| [95% Conf. Interval] -------------+----------------------------------------------------------------
age | -3.081814 5.514717 -0.56 0.578 -14.08923 7.925606
ownrent | 27.94091 82.92232 0.34 0.737 -137.5727 193.4546
income | 234.347 80.36595 2.92 0.005 73.93593 394.7581
incomesq | -14.99684 7.469337 -2.01 0.049 -29.9057 -.0879859
_cons | -237.1465 199.3517 -1.19 0.238 -635.0541 160.7611
------------------------------------------------------------------------------rvpplot income, yline(0) scheme(lean1)
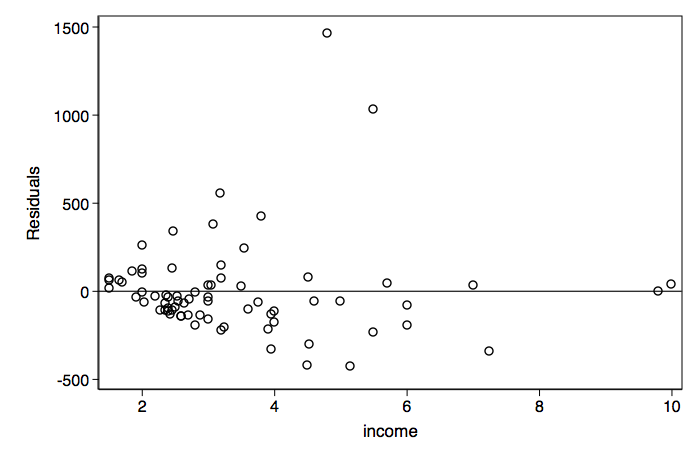
The residual versus income plot shows clear evidence of heteroscedasticity. Let's try a WLS
weighting proportional to income. The WLS type, abse, uses the absolute value of the
residuals and in this case no constant.
wls0 exp age ownrent income incomesq, wvar(income) type(abse) noconst graphWLS regression - type: proportional to abs(e)
(sum of wgt is 5.1961e-03)
Source | SS df MS Number of obs = 72
-------------+------------------------------ F( 4, 67) = 5.73
Model | 818838.784 4 204709.696 Prob > F = 0.0005
Residual | 2393372.07 67 35721.9713 R-squared = 0.2549
-------------+------------------------------ Adj R-squared = 0.2104
Total | 3212210.86 71 45242.4065 Root MSE = 189------------------------------------------------------------------------------
exp | Coef. Std. Err. t P>|t| [95% Conf. Interval] -------------+----------------------------------------------------------------
age | -2.694186 3.807306 -0.71 0.482 -10.2936 4.905229
ownrent | 60.44878 58.55088 1.03 0.306 -56.41928 177.3168
income | 158.427 76.39115 2.07 0.042 5.949594 310.9044
incomesq | -7.249289 9.724337 -0.75 0.459 -26.65915 12.16057
_cons | -114.1089 139.6875 -0.82 0.417 -392.9263 164.7085
------------------------------------------------------------------------------
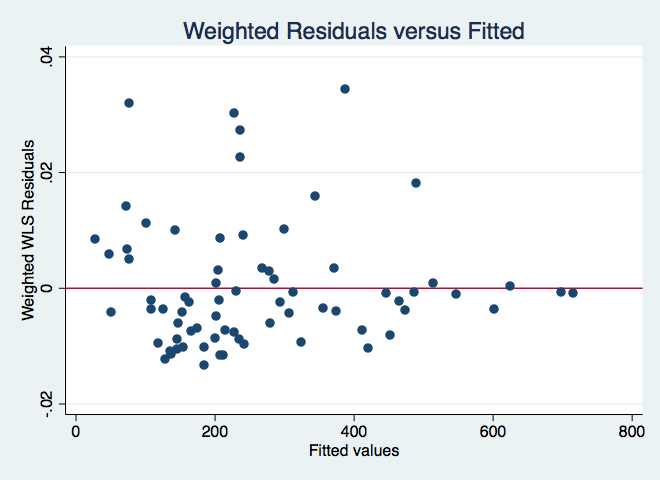
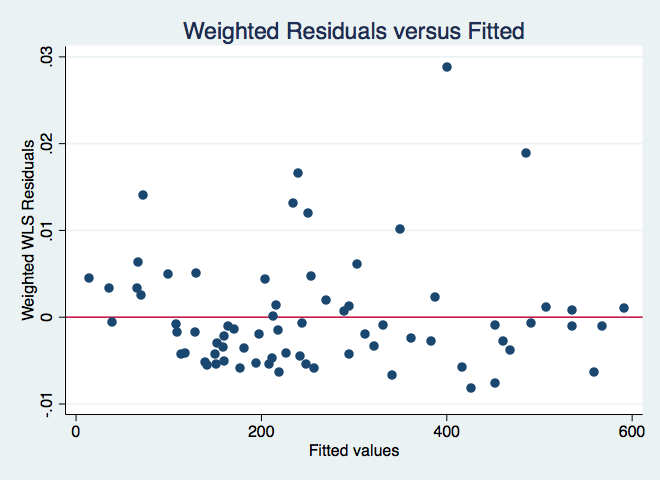
The residual plot is better. We can try other possibilities, such as, weighting proportional to
income and income squared.
wls0 exp age ownrent income incomesq, wvar(income incomesq) type(abse) noconst graphWLS regression - type: proportional to abs(e)
(sum of wgt is 2.7071e-03)
Source | SS df MS Number of obs = 72
-------------+------------------------------ F( 4, 67) = 7.60
Model | 1481099.44 4 370274.86 Prob > F = 0.0000
Residual | 3265263.26 67 48735.2725 R-squared = 0.3120
-------------+------------------------------ Adj R-squared = 0.2710
Total | 4746362.7 71 66850.1788 Root MSE = 220.76------------------------------------------------------------------------------
exp | Coef. Std. Err. t P>|t| [95% Conf. Interval] -------------+----------------------------------------------------------------
age | -2.927867 4.412377 -0.66 0.509 -11.73501 5.879275
ownrent | 51.12242 67.95408 0.75 0.455 -84.51449 186.7593
income | 196.4813 62.26251 3.16 0.002 72.20479 320.7578
incomesq | -11.95962 5.511042 -2.17 0.034 -22.95971 -.9595377
_cons | -166.6852 145.0887 -1.15 0.255 -456.2834 122.913
------------------------------------------------------------------------------
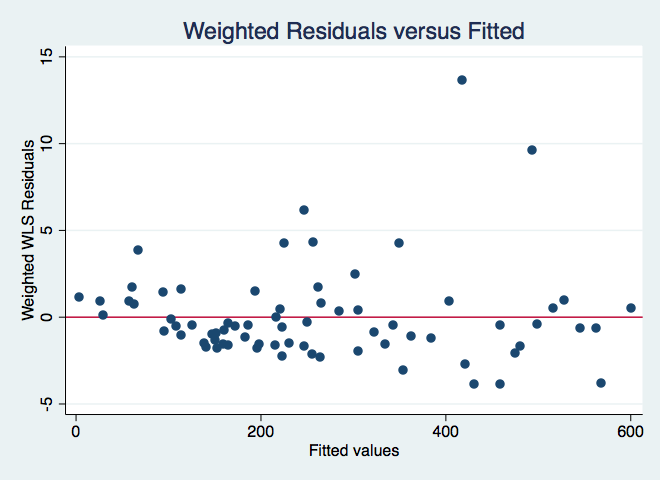
Finally, let's try one more variation. This time we will make the adjustment proportional to
the log of squared residuals.
wls0 exp age ownrent income incomesq, wvar(income incomesq) type(loge2) graphWLS regression - type: proportional to log(e)^2
(sum of wgt is 9.3775e-01)
Source | SS df MS Number of obs = 72
-------------+------------------------------ F( 4, 67) = 7.93
Model | 1953755.81 4 488438.951 Prob > F = 0.0000
Residual | 4126765.99 67 61593.5222 R-squared = 0.3213
-------------+------------------------------ Adj R-squared = 0.2808
Total | 6080521.79 71 85641.152 Root MSE = 248.18------------------------------------------------------------------------------
exp | Coef. Std. Err. t P>|t| [95% Conf. Interval] -------------+----------------------------------------------------------------
age | -3.020919 4.93586 -0.61 0.543 -12.87294 6.831099
ownrent | 40.31746 76.15911 0.53 0.598 -111.6968 192.3317
income | 213.373 66.55042 3.21 0.002 80.53779 346.2082
incomesq | -13.27511 5.514378 -2.41 0.019 -24.28185 -2.268364
_cons | -197.3543 168.7816 -1.17 0.246 -534.2439 139.5353
------------------------------------------------------------------------------
In addition to weight types abse and loge2 there is squared residuals (e2)
and squared fitted values (xb2).
Finding the optimal WLS solution to use involves detailed knowledge of your data and trying
different combinations of variables and types of weighting.