Purpose: The purpose of this program is to show the regression
line between X and Y in logistic regression, and to demonstrate the influence on
this line as the intercept, the slope or X is modified.Download: You can download this program from within Stata by
typing search grlog (see
How can I use the search command to search for programs and get additional
help? for more information about using search).
Use of program: To use this program, type grlog in the Stata command window.
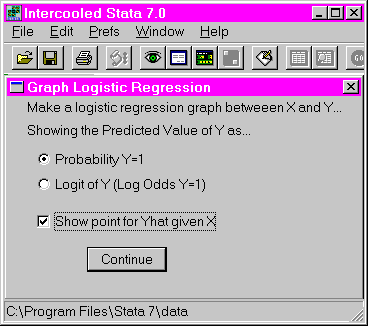
This will open the first of two dialogue windows. In the first dialogue
window, the user can select having the predicted value of Y is displayed as the
probability of Y = 1 or as the logit of Y (log odds Y = 1). A check box
allows the user to indicate if a point at X, Yhat should be shown. Once
these selections have been made, click on the "continue" button.
The second dialogue window will open and allows the user to add or subtract .1
from either a or b. Clicking on the "show movie varying a"
button will display a movie of a varying from -1 to +1. Clicking on the
"show movie varying b" button will display a movie of b varying from
-1 to +1. A pull-down menu allows the user to control the speed of the frames of the movie. This can be done by clicking
on the down-arrow to the right of "delay = ". The higher the
number, the slower the movie. If the user selected to show the predicted
value in the first dialogue window, the second dialogue window will have two
additional buttons that allow one to be added or subtracted from X. To
reset the program to the default values, click on the "reset"
button. To exit the program, click on the
"done" button.Examples: The following shows the first of two dialogue
windows that opens after issuing the grlog command.
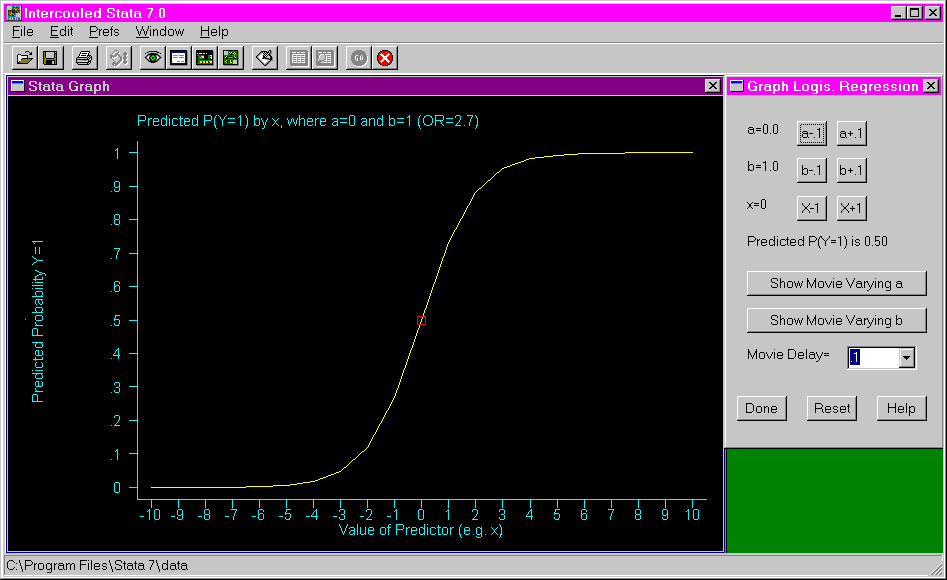
The following shows the second dialogue window. This window opens after
the user clicks on the "continue" button in the dialogue window shown
above. Because of the check in the "show point for Yhat given X"
box, the "X – 1" and "X +1" buttons appear in the dialogue
window shown below.
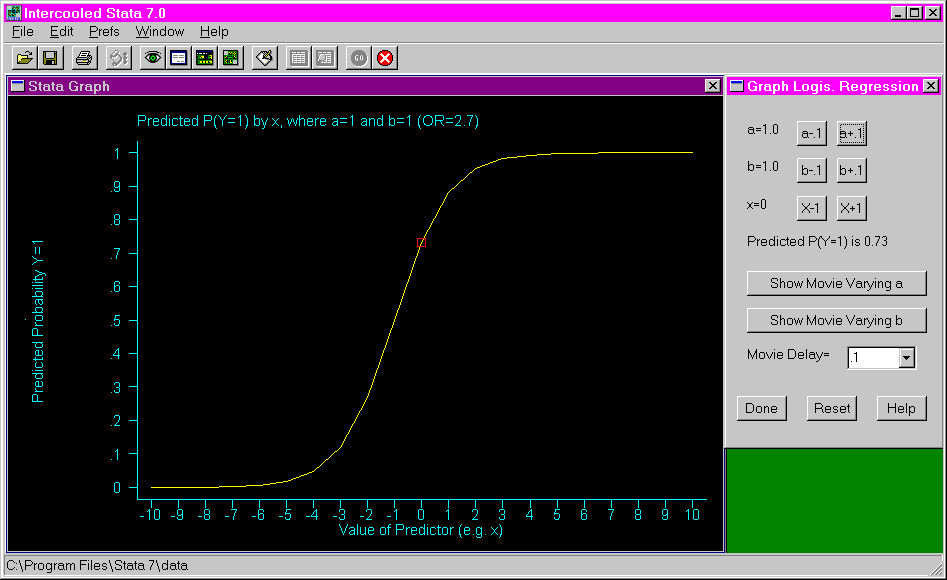
The following shows the results of clicking on the "a + .1" button
ten times. Notice that the curve is shifted to the left and that the red
box has moved up the curve. Also note that the predicted probability of Y
= 1 has increased from .5 to .73 (as shown in the dialogue window).
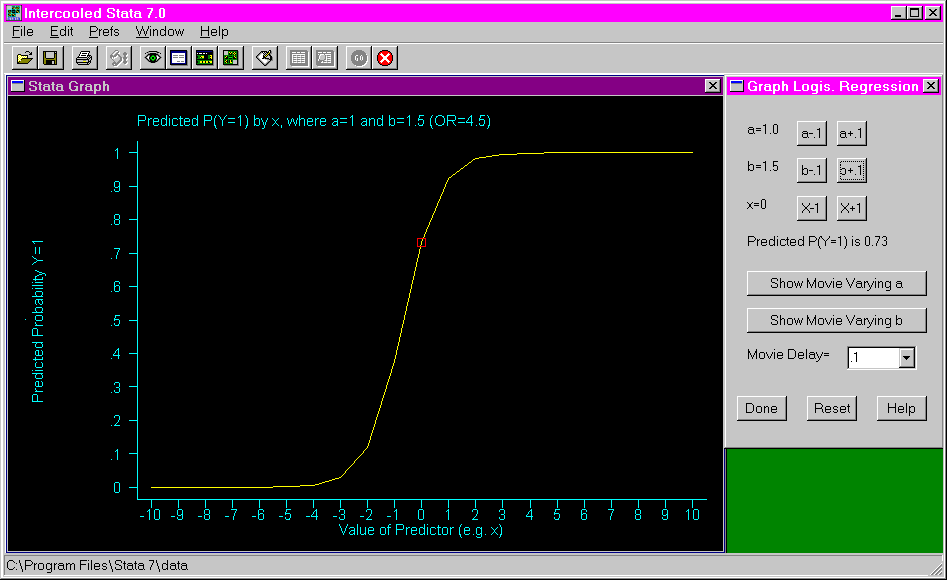
The following shows the results of clicking on the "b + .1" button
five times. Notice that the curve has become much steeper and the odds
ratio (given at the top of the graph) has increased. However, the red box
has not moved and the predicted probability of Y = 1 has not
changed.
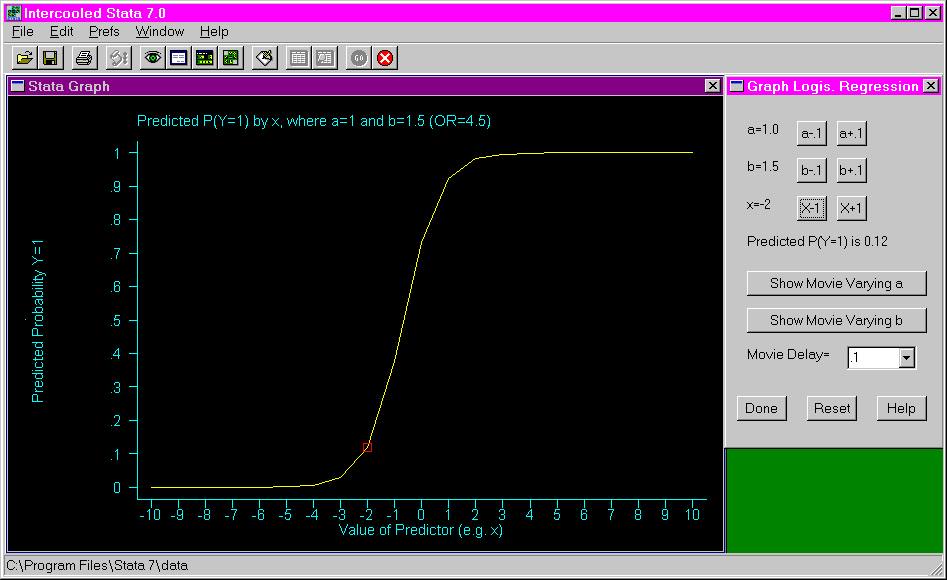
The following shows the results of clicking on the "X – 1" button
twice. Notice that the red box has moved down the curve and the predicted
probability of Y = 1 has decreased substantially.
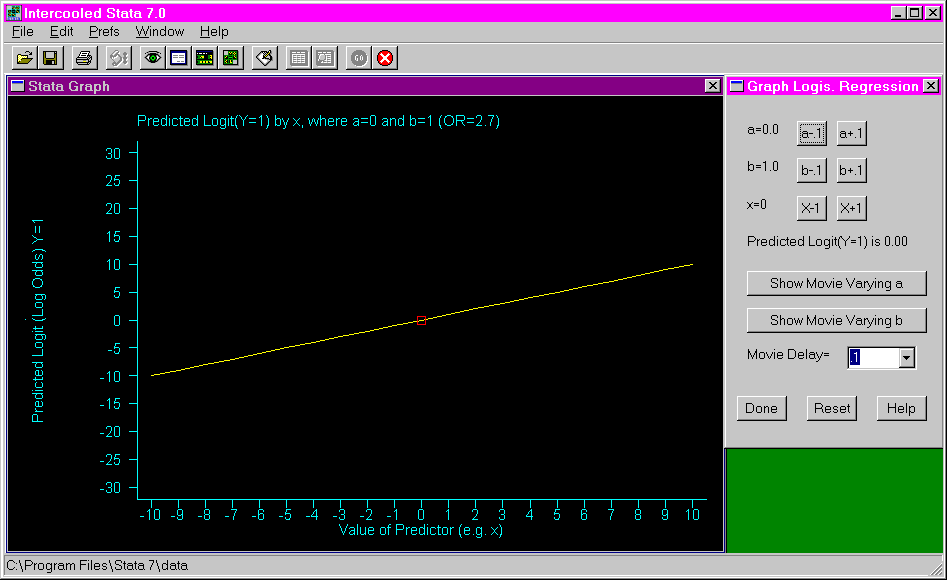
The following shows the graph and second dialogue window that appear when the
"logit of Y" selection is made in the first dialogue window (please
see the first example above).
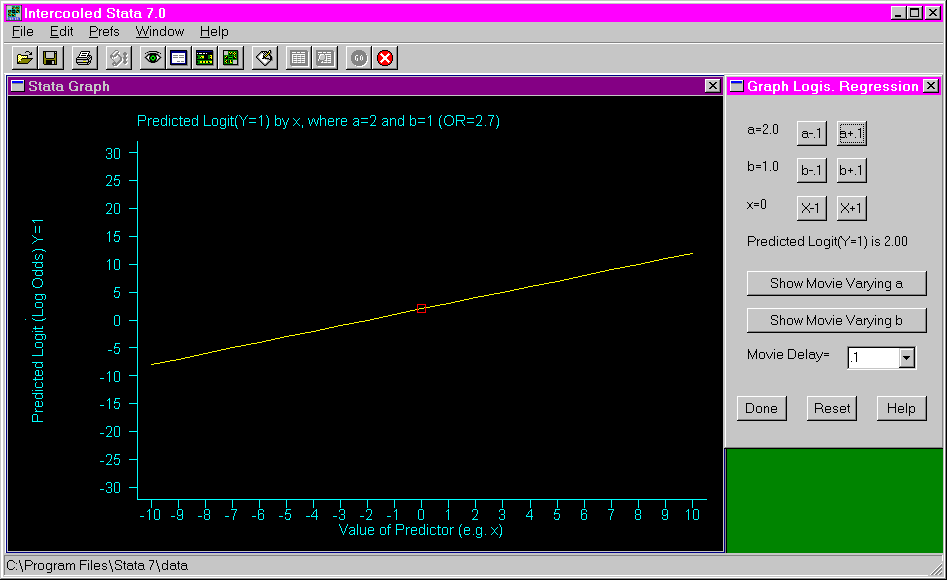
The following shows the results of clicking on the "a + .1" button
20 times. Notice that the regression line moved up and that the predicted
logit has increased from zero to two.
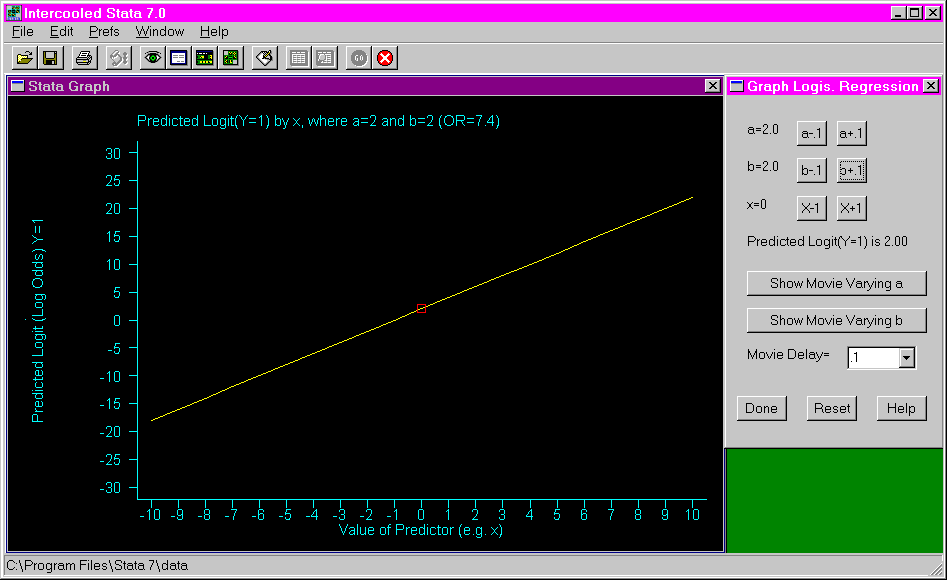
The following shows the results of clicking on the "b + .1" button
ten times. Notice that the slope of the line is much steeper and that the
odds ratio has increased from 2.7 to 7.4.
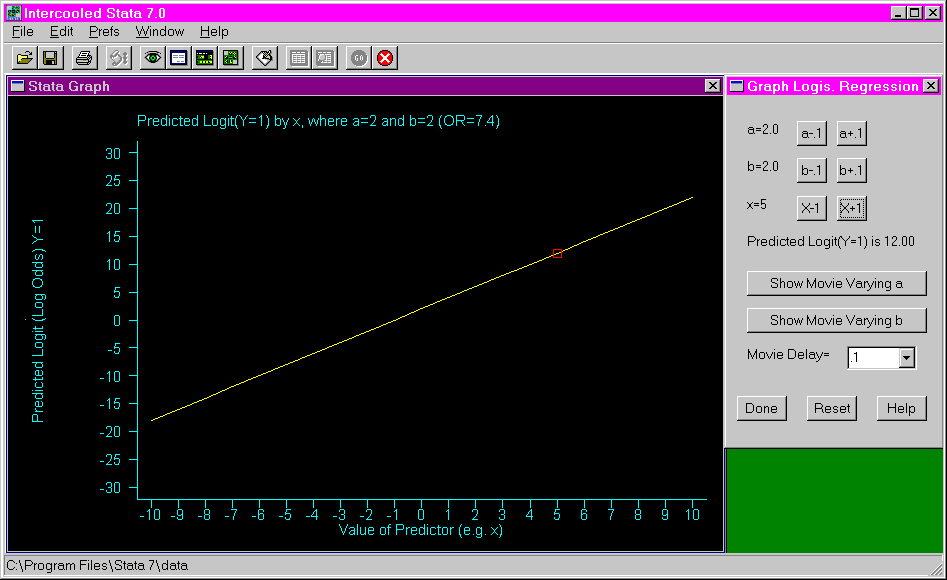
The following shows the results of clicking on the "X + 1" button
five times. Notice that the red box has moved up the line and that the
predicted logit has increased from two to twelve.