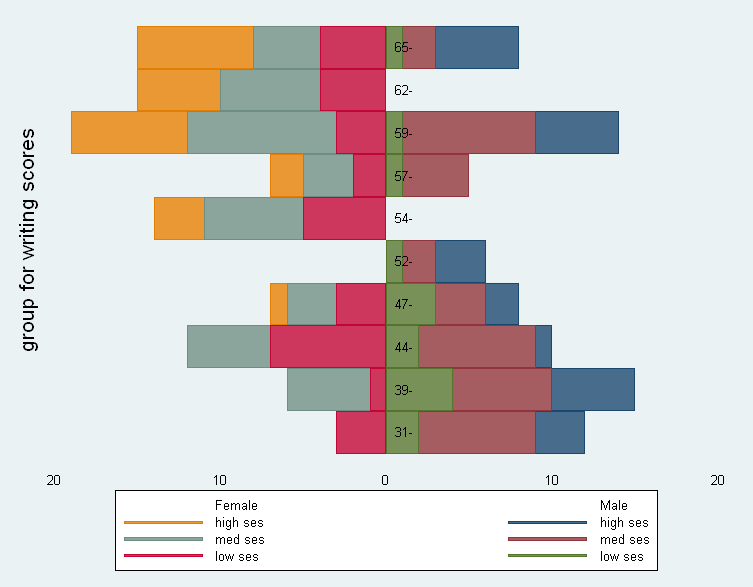
use https://stats.idre.ucla.edu/stat/stata/notes/hsb2, clear

egen writegroup= cut(write), group(10) label
tab writegroup

sort female writegroup ses
contract female writegroup ses
rename _freq count

reshape wide count, i(writegroup female) j(ses)

gen c1 = count1 /*ses = 1 */
gen c12 = count1+count2
gen c123 = count3 + c12
gen c1_n = - c1
gen c12_n = - c12
gen c123_n = - c123

gen zero = 0

label values writegroup writegroup
label values female f1

twoway bar c123 writegroup if female==0 , horizontal || ///
       bar c12 writegroup if female==0, horizontal || ///
       bar c1 writegroup if female ==0, horizontal  || ///
       bar c123_n writegroup if female ==1 , horizontal || ///
       bar c12_n writegroup if female ==1, horizontal || ///
       bar c1_n writegroup if female ==1, horizontal || ///
       sc  writegroup zero ,  mlabel(writegroup) mlabsize(vsmall) ///
           mlabcolor(black) msymbol(i) || , plotregion(style(none)) ysca(noline) ///
           ylabel(none) xsca(noline titlegap(-1)) xlabel(0 -20 "20" -10 "10" ///
           10(10) 20 , tlength(0) labsize(vsmall) grid gmin gmax) ytitle(group for writing scores) ///
           legend(order(- "Female" - "Male" 4 1 5  2 6 3) col(2) lab(1 "high ses") ///
           lab(2 "med ses") lab(3 "low ses") lab(4 "high ses") lab(5 "med ses") ///
           lab(6 "low ses") lab(7 " ") colgap(40) symysize(.5) size(vsmall) bmargin(small) rowgap(*.5))