
There are two ways in which you can plot ANOVA cell means:
- anovaplot — user written program (search anovaplot)
or - enter a sequence of Stata commands from the command line.
Let’s begin with the anovaplot.ado program. You can download it by
typing search anovaplot (see
How can I use the search command to search for programs and get additional
help? for more information about using search).
Now, let’s read in an example dataset, crf24, adapted from Kirk (1968,
First Edition).
use https://stats.idre.ucla.edu/stat/stata/faq/crf24

anova y a b a*b


                           Number of obs =      32     R-squared     =  0.9214
                           Root MSE      = .877971     Adj R-squared =  0.8985

                  Source |  Partial SS    df       MS           F     Prob > F
              -----------+----------------------------------------------------
                   Model |         217     7          31      40.22     0.0000
                         |
                       a |       3.125     1       3.125       4.05     0.0554
                       b |       194.5     3  64.8333333      84.11     0.0000
                     a*b |      19.375     3  6.45833333       8.38     0.0006
                         |
                Residual |        18.5    24  .770833333
              -----------+----------------------------------------------------
                   Total |       235.5    31  7.59677419
Now, let’s plot the cell means.
anovaplot b a, scatter(msym(none))
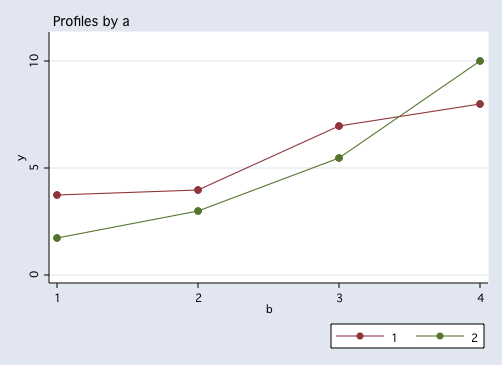
The graph illustrates the interaction effects in the 2 x 4 factorial ANOVA.
Now, let’s look at the sequence of Stata commands which can be used to produce these graphs.
predict yhat
sort a b
graph twoway scatter yhat b, connect(L)
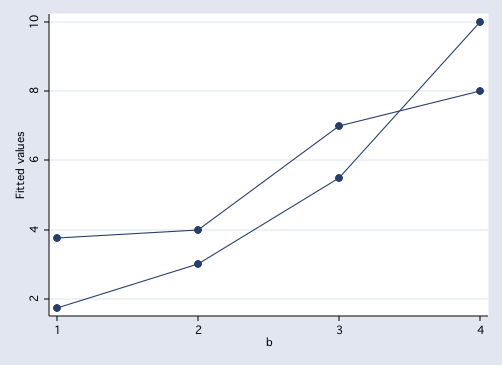
In order to do this plot of the cell means it is necessary to predict the cell means using
predict yhat.
Next the data are sorted on a
and b and then yhat is
graphed versus b with the points
connected by a line for each level of a (the c(L) option: Note the upper case “L”).