This page presents examples of graphics programs written by ATS stat
consultants. You can obtain these programs by typing, search command_name,
into the Stata command line and following the instructions (see
How can I use the search command to search for programs and get additional
help? for more information about using search).This page contains only the commands and the plots themselves, there is no further explanation.
We envision that users will look through the plots and when they find one that appears
to do what they want, they will download the program and carefully read the help files.Most of these examples use the hsb2 dataset which can be downloaded from
within Stata using the following command:
use https://stats.idre.ucla.edu/stat/stata/notes3/hsb2, clear
Note: Most of the graphs were produced using the scheme lean1. Whenever a different
scheme is used, it is given in the command.
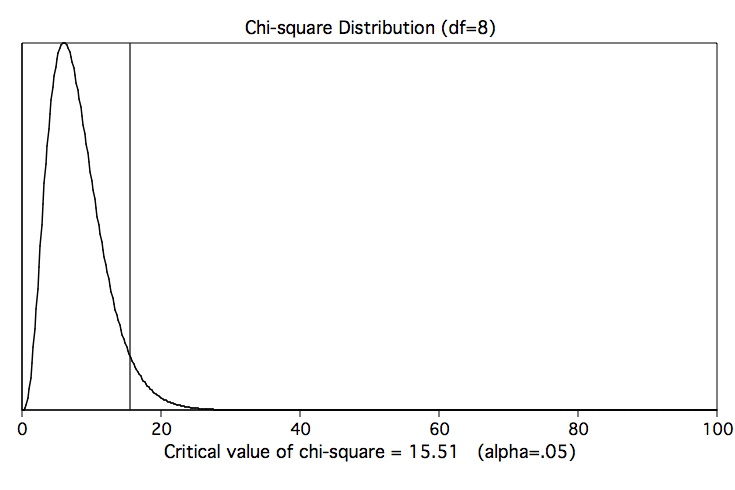
chidemo — chi-squared distribution with critical value
chidemo 8
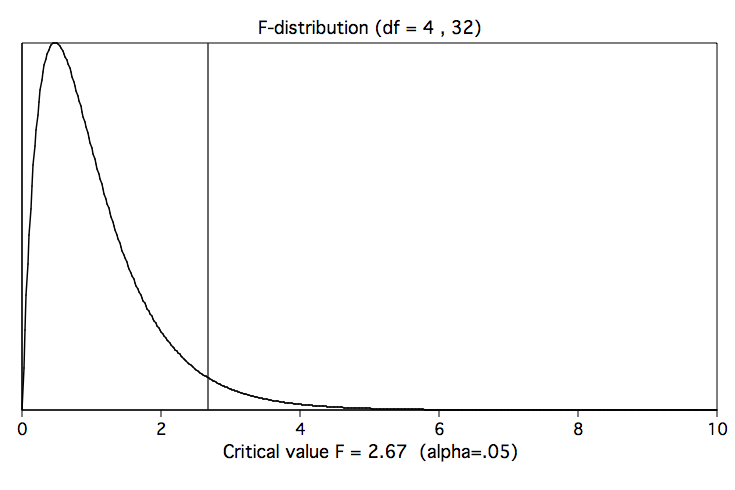
fdemo — F-distribution with critical value
fdemo 4 32
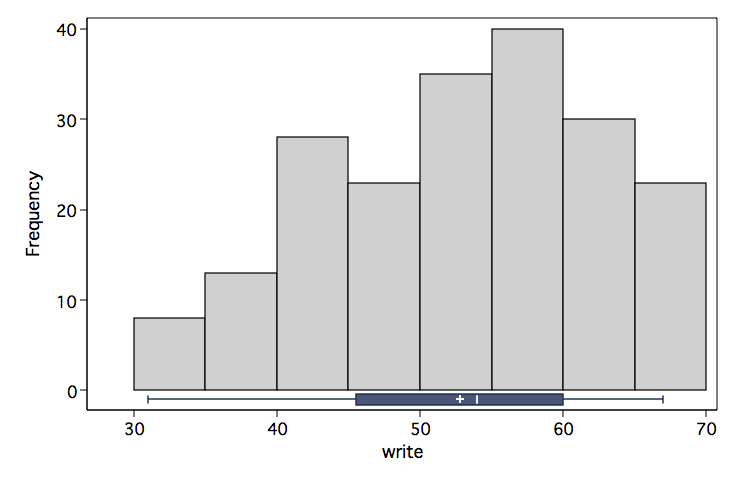
histbox — histgram and boxplot
histbox write, mean start(30) width(5)
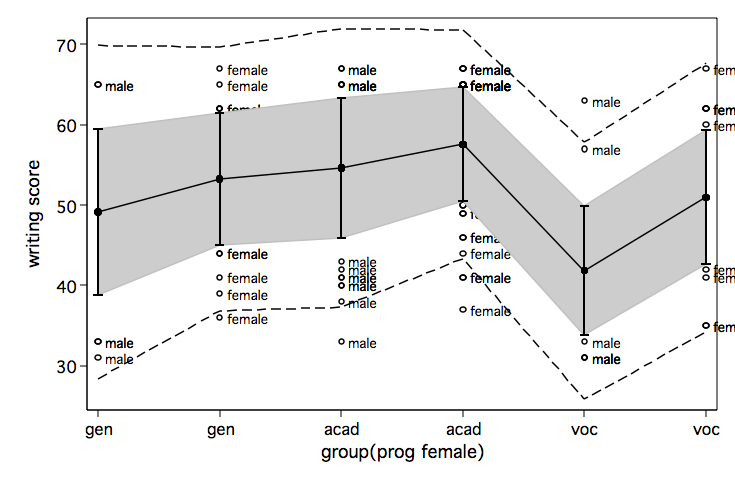
meansdplot — Plot means and standard deviations for groups
meansdplot math prog, outer(2) xlab(1 "gen" 2 "acad" 3 "voc") ytitle(math score)egen grp = group(prog female) meansdplot write grp, outer(2) /// xlab(1 "m-gen" 2 "f-gen" 3 "m-acad" 4 "f-acad" 5 "m-voc" 6 "f-voc") ytitle(writing score)
meansdplot write prog, outer(2) xlab(1 "gen" 2 "acad" 3 "voc") ytitle(writing score) mlabel(female)
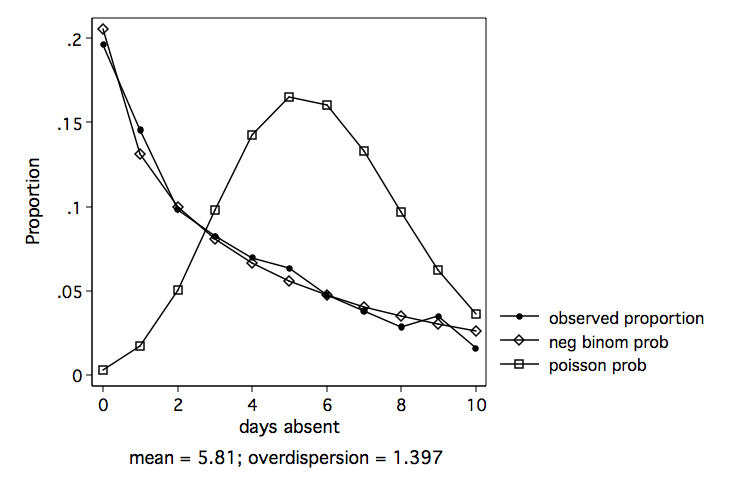
nbvargr — observed variable, poisson & negative binomial probabilities
use https://stats.idre.ucla.edu/stat/stata/notes/lahigh, clear
nbvargr datsabs
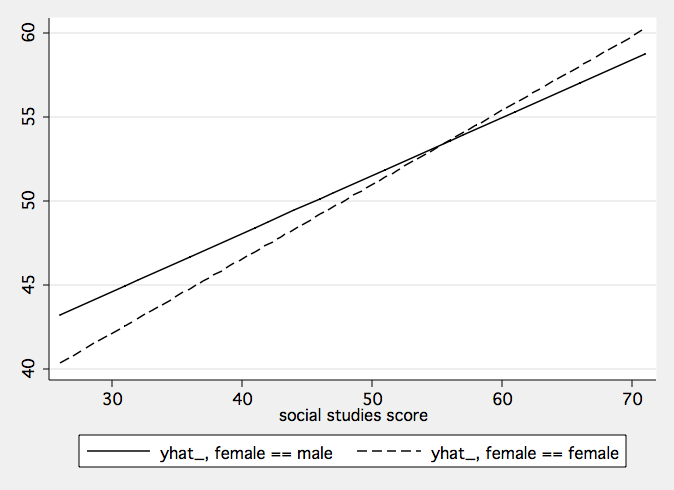
postgr3 — post estimation graphs and predicted values
xi3: regress read i.female*socst ses science
postgr3 socst, by(female) scheme(s2mono)
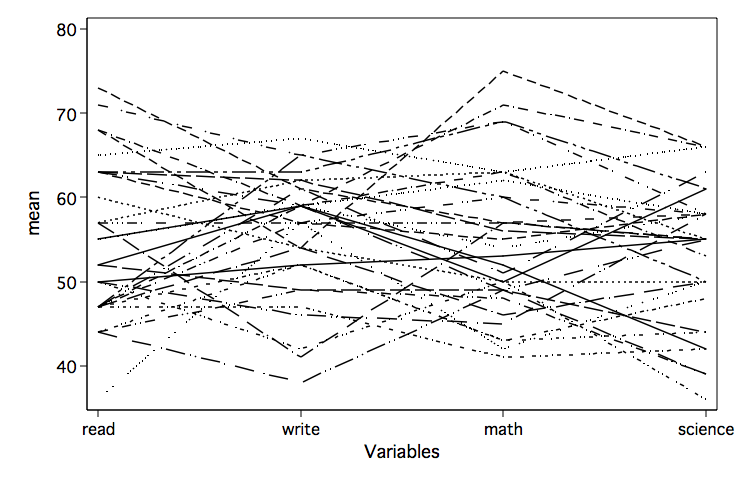
profileplot — profile plots
profileplot read write math science, by(schtyp)profileplot read write math science if schtyp==2, by(id) msymbol(i) legend(off)
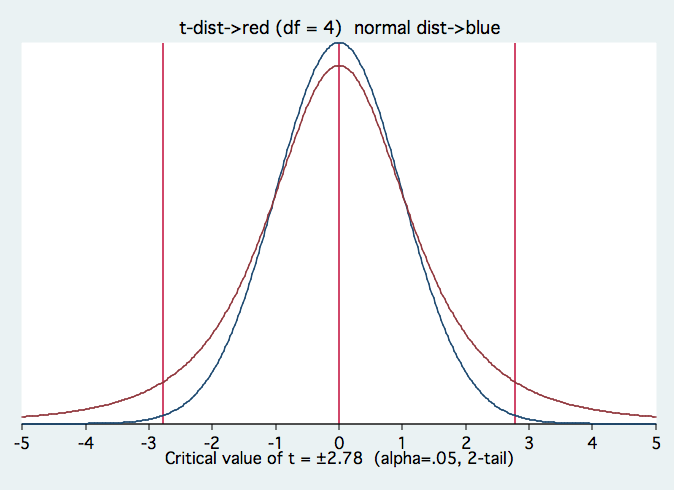
tdemo — t-distribution with critical value
tdemo 4
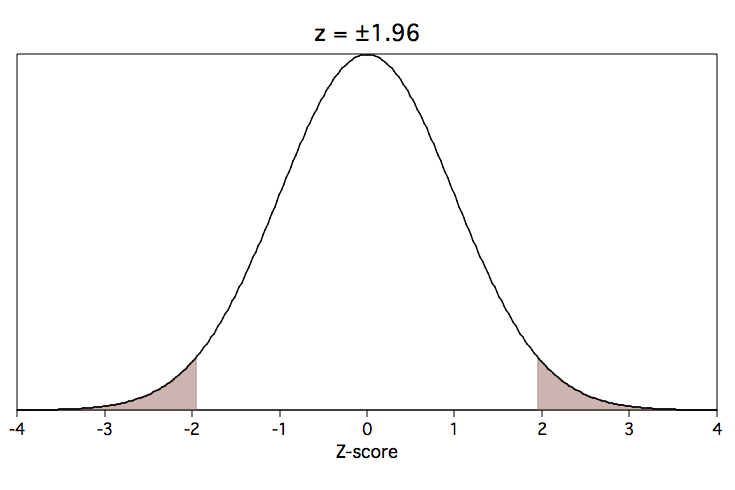
zdemo — normal distribution with user selected z-scores
zdemo -1 1

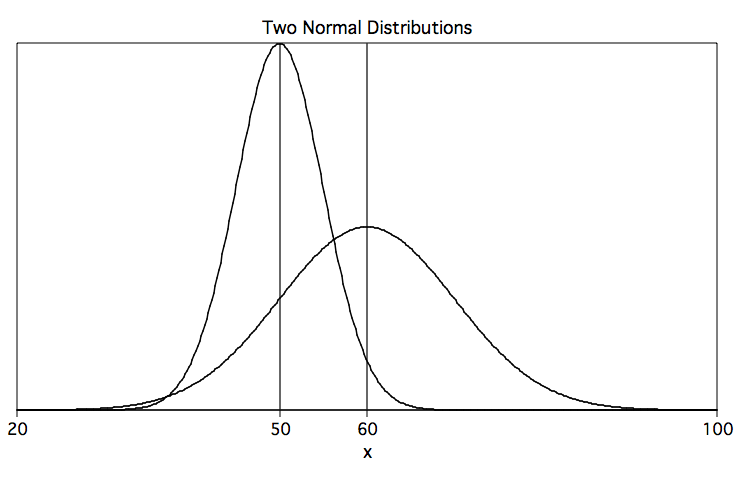
zdemo2 — 2 normal distributions with mean and sd
zdemo2 50 5 60 10
ztail — normal distribution demonstration
ztail .05 1ztail .05 2