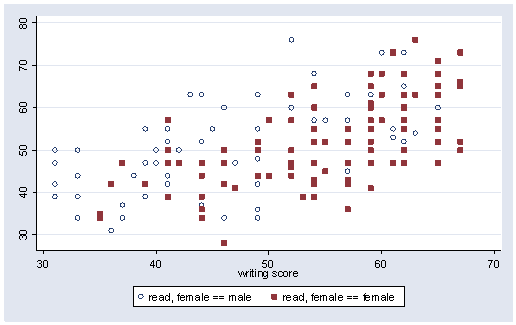
Suppose we are using the high school and beyond
data file (hsb2) which has test scores for 200 students, 91 males and 109 females.
We could make a graph of their read and write score as
shown below with the graph command.
use https://stats.idre.ucla.edu/stat/stata/notes/hsb2, clear

graph twoway scatter read write
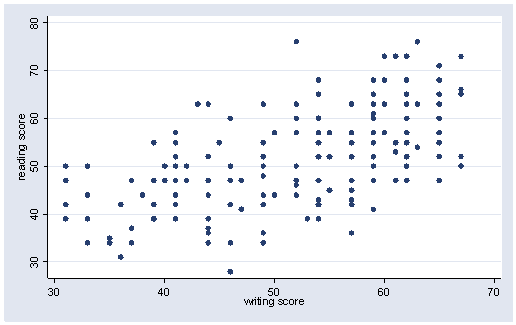
Say we want to see the scores
separately for the males and the females. One way we can do this is by
using two scatter commands, one making a graph for the males and one
making a graph for the females, and overlaying these two graphs, as
illustrated below.
graph twoway (scatter read write if female==0) (scatter read write if female==1)
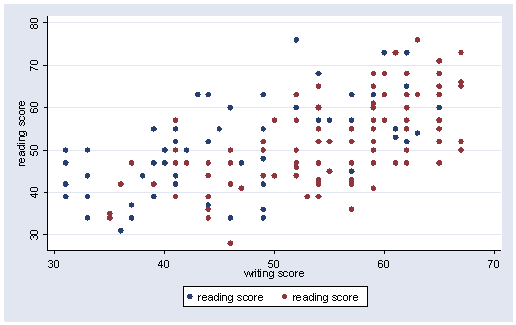
However, one problem with the graph above is that it does not identify
which markers are the males and which are the females.
We can add a legend option to more clearly label the males and females, as
shown below.
graph twoway (scatter read write if female==0) (scatter read write if female==1), ///
  legend(label(1 male) label(2 female))
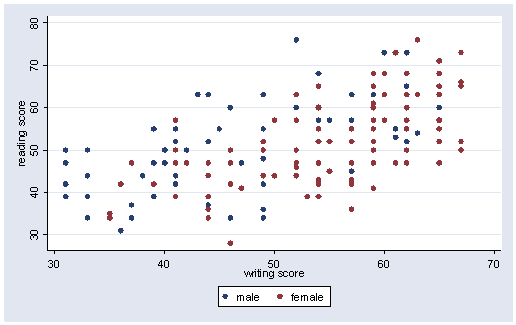
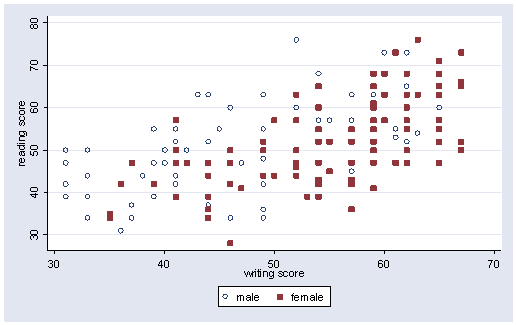
We can use the msymol() option to
control the marker symbols for the males and females. Here we plot the
males with large hollow circles and the females with large solid squares.
graph twoway (scatter read write if female==0, msymbol(Oh)) ///
  (scatter read write if female==1, msymbol(S)), ///
  legend(label(1 male) label(2 female))
Another strategy we can use is via the separate command to make a read score for the males,
and a read score for the females. We can then graph these two
variables, and then get separate symbols for the males and females. Below
we use the separate command and it makes a variable read0 that is
the reading score for the males and read1 that is the reading score for
the females.
separate read, by(female)

              storage  display     value
variable name   type   format      label      variable label
-------------------------------------------------------------------------------
read0           byte   %9.0g                  read, female == male
read1           byte   %9.0g                  read, female == female
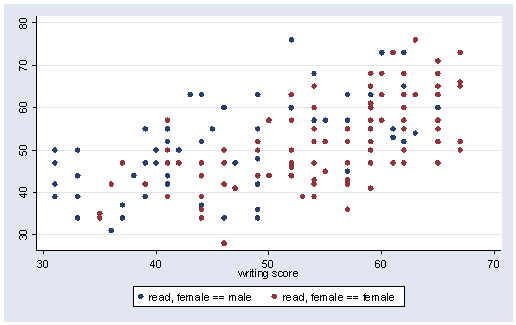
Now, we can graph read0 and read1 as shown below. Note that since Stata uses the variable
label in the legend, it provides an indication of which symbol is the males
and which is for the females.
graph twoway scatter read0 read1 write
We can use the msymbol() option to select the
symbols we want for males and females. Below we choose a large hollow
circle (Oh)
for the males and a large solid square (S) for the females.
graph twoway scatter read0 read1 write, msymbol(Oh S)