
It is rather easy to copy Stata output and Stata graphs into Microsoft
Word. This page shows how you can copy your Stata output and graphs into Microsoft
Word.
The Stata Results window holds the results of your Stata
commands. We should point out two things about the Stata Results window that may surprise
you. First, by default it holds only about 500 lines of output… anything after
that is discarded. Second, you cannot use the pulldown menus to save the
contents of the results window (i.e., you cannot go File Save to save the
results). How can you save your output? Here are a couple of solutions.
Copy as text from the results window and paste into Word
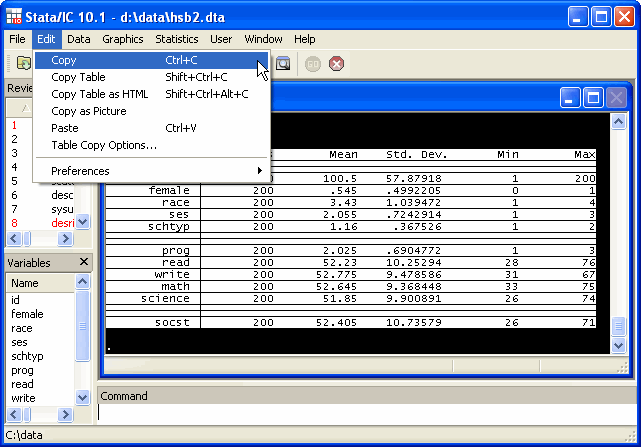
You can use the mouse to scroll through the results window and mark an
area that you want to save. You can then use the pulldown menu to choose Edit
and then Copy. This is illustrated below.
You can then go to Microsoft Word and from its pulldown menu
choose Edit then Paste. Most likely, the results will look
lousy, that is, the text will be misaligned as shown below.

This happens because the output from Stata uses fixed space
fonts, and most fonts in Microsoft Word are proportionally spaced fonts
(for example, the text in the window above is Times New Roman). If you
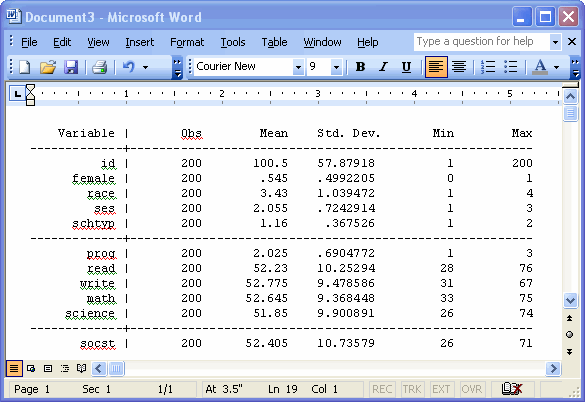
select the text in Word and choose a fixed space font like Courier the
output will then look as it did in Stata, as shown below.
Copy as image from the results window and paste into Word
An alternative to copying the output as text from the Stata window is to copy
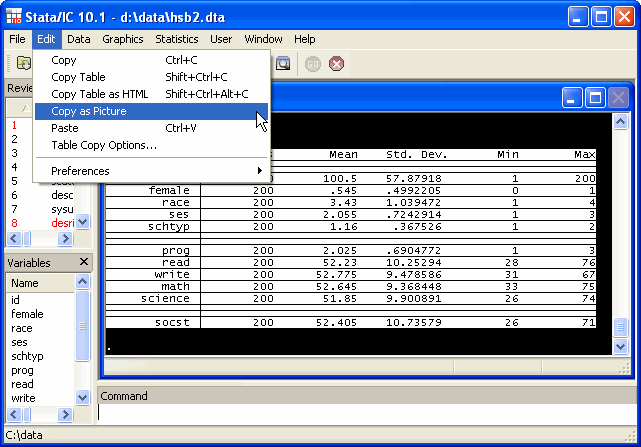
the output as an imagine. Highlight the output you want to save, then use the pulldown menu to choose Edit
and then Copy as Picture. This is illustrated below.
You can then go to Microsoft Word and from its pulldown menu choose Edit then
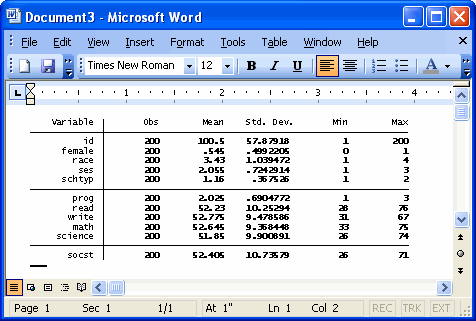
Paste. When you do this, the table you see will probably be quite small. To make
the output more readable, you can enlarge this table using the picture editor in Word
as shown below.
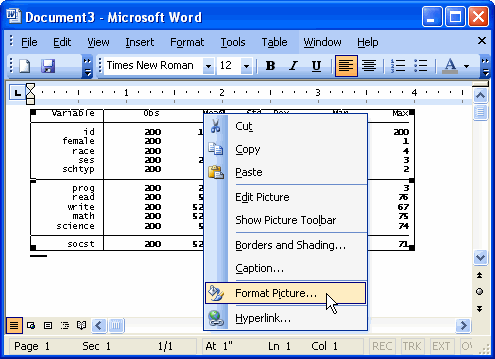
Right-click on the output and select Format Picture… to edit the picture
properties.
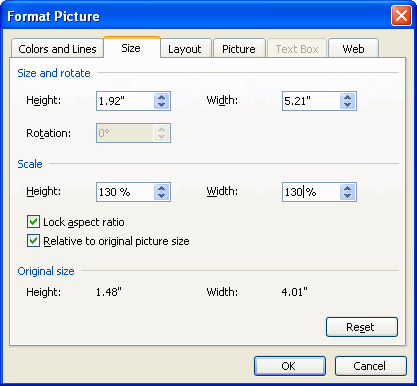
On the Size tab of the Format Picture box, change the scale of both the height
and width. Finding the correct size for your output may take some trial and error,
in this case, we’ll start by increasing both the height and width from 100% to 130%
and click OK.
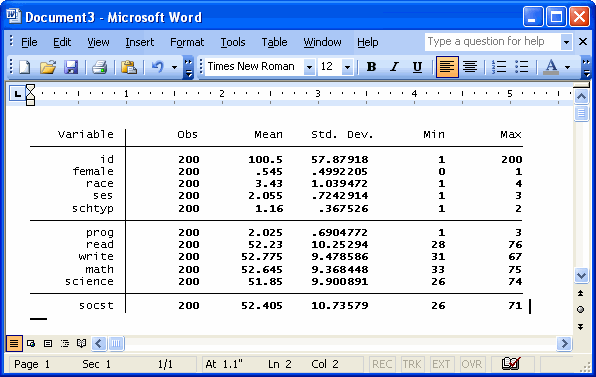
Below is the output shown at 130%, in this case, the table is readable so no further adjustment
is needed.
Copy .log file into Word
At the start of your session, you can start a log file, and then at the end
of your session you can close the log file. This log contains the commands
you typed and the output produced. For example,
log using d:datahomework.log, text

<...you enter a bunch of commands...>

log close
Then, the file homework.log would contain the commands and output
they produced. You can open this file in Microsoft Word and edit it, but
there are a couple of tricks. First, you need to point Word to the
folder (directory) where homework.log is located. By default,
Word only shows you Word documents (i.e., files that end in .doc). For
example, in the screen below we have pointed Word to the right folder, but we
cannot see homework.log because it is only showing us Files of Type
Word Documents (*.doc), see lower left of window.
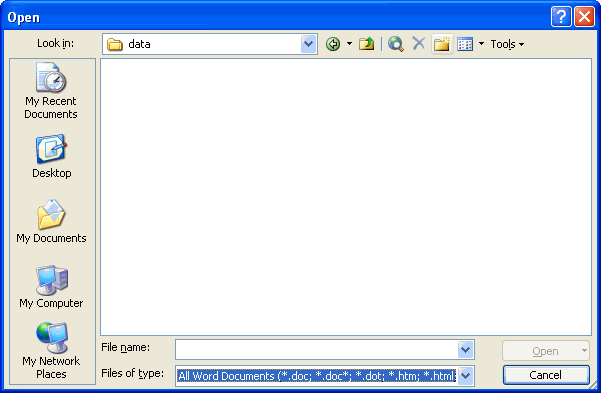
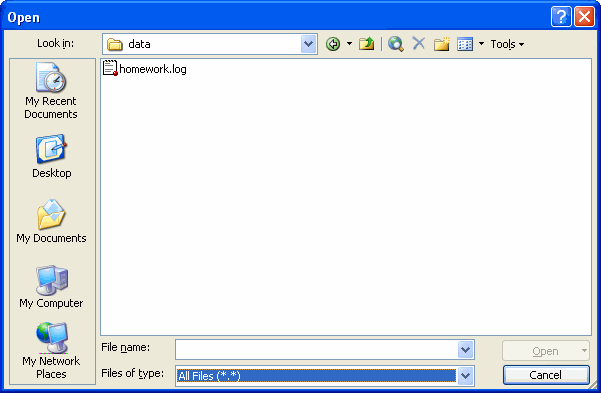
If we change the Files of type to be All Files (*.*) we can now see
our file called homework.log.
You can then edit this file. If you want to add comments, you may
notice that text is in a fixed space font. It will probably look better
if you convert that text to Times New Roman (mark your comments and then
choose the Times New Roman font). You will want to choose File
then Save As and save the file as a word document so it will contain
all of the formatting you have created.
Copying graphs to Word
If you create a graph in Stata, you can copy that graph and then paste it
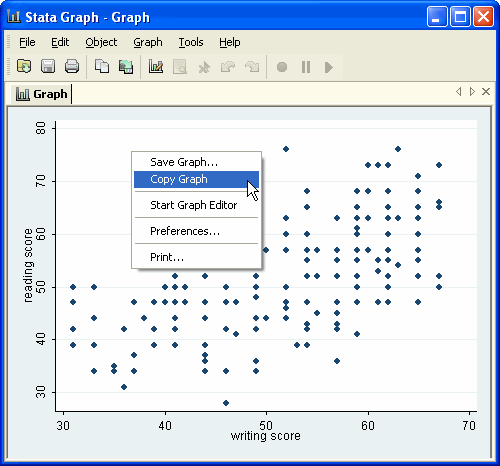
into Microsoft Word. Below we show a graph we created in Stata and show
how to copy the graph by pointing at the graph and right-clicking and
choosing Copy
You can then open Word and then paste the graph by choosing from the Word
pulldown menu Edit and then Paste. You will then see the
Stata graph pasted into the Word. This covers the basics of copying Stata output and graphs into Microsoft
Word.