
Path analysis is used to estimate a system of equations in which all of the
variables are observed. Unlike models that include latent variables, path models
assume perfect measurement of the observed variables; only the structural relationships
between the observed variables are modeled. This type of model is often used
when one or more variables is thought to mediate the relationship between
two others (mediation models). Similar models setups can be used to estimate
models where the errors (residuals) of two
otherwise unrelated dependent variables are allowed to correlated (seemingly
unrelated regression), as well as models where the relationship between
variables is thought to vary across groups (multiple group models).
1.0 A Just Identified Model
The examples on this page use a dataset (https://stats.idre.ucla.edu/wp-content/uploads/2016/02/path.dat) that contains four
variables, the respondent’s high school gpa (hs), college gpa (col), GRE score (gre), and graduate school gpa (grad).
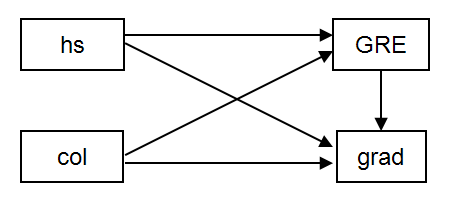
We begin with the model illustrated below, where GRE scores are
predicted using high school and college gpa (hs and col
respectively); and graduate school gpa (grad) is predicted using GRE, high school gpa and
college gpa. This model is just identified,
meaning that it has zero degrees of freedom.
In the model: command, the keyword on is used to indicate that
the model regresses gre on hs and col; and grad on
hs, col, and gre. The
output: command with the
stdyx; option was included to obtain
standardized regression coefficients and R-squared values. (The stdyx;
option produces coefficients
standardized on both y and x, but other types of standardization are available and can be requested
using the standardized; option.)
Title: Path analysis -- just identified model
Data:
  file is path.dat ;
Variable:
  Names are hs gre col grad;
Model:
    gre on hs col;
    grad on hs col gre;
Output:
    stdyx;
Here is the output from Mplus.
INPUT READING TERMINATED NORMALLY


Path analysis -- just identified model

SUMMARY OF ANALYSIS

Number of groups                                                 1
Number of observations                                         200

Number of dependent variables                                    2
Number of independent variables                                  2
Number of continuous latent variables                            0

Observed dependent variables

  Continuous
   GRE         GRAD

Observed independent variables
   HS          COL


Estimator                                                       ML
Information matrix                                        OBSERVED
Maximum number of iterations                                  1000
Convergence criterion                                    0.500D-04
Maximum number of steepest descent iterations                   20

Input data file(s)
  https://stats.idre.ucla.edu/wp-content/uploads/2016/02/path.dat

Input data format  FREE


THE MODEL ESTIMATION TERMINATED NORMALLY


TESTS OF MODEL FIT

Chi-Square Test of Model Fit

          Value                              0.000
          Degrees of Freedom                     0
          P-Value                           0.0000

Chi-Square Test of Model Fit for the Baseline Model

          Value                            247.004
          Degrees of Freedom                     5
          P-Value                           0.0000

CFI/TLI

          CFI                                1.000
          TLI                                1.000

Loglikelihood

          H0 Value                       -2789.415
          H1 Value                       -2789.415

Information Criteria

          Number of Free Parameters              9
          Akaike (AIC)                    5596.830
          Bayesian (BIC)                  5626.515
          Sample-Size Adjusted BIC        5598.002
            (n* = (n + 2) / 24)

RMSEA (Root Mean Square Error Of Approximation)

          Estimate                           0.000
          90 Percent C.I.                    0.000  0.000
          Probability RMSEA <= .05           0.000

SRMR (Standardized Root Mean Square Residual)

          Value                              0.000


MODEL RESULTS

                                                    Two-Tailed
                    Estimate       S.E.  Est./S.E.    P-Value

 GRE      ON
    HS                 0.309      0.065      4.756      0.000
    COL                0.400      0.071      5.625      0.000

 GRAD     ON
    HS                 0.372      0.075      4.937      0.000
    COL                0.123      0.084      1.465      0.143
    GRE                0.369      0.078      4.754      0.000

 Intercepts
    GRE               15.534      2.995      5.186      0.000
    GRAD               6.971      3.506      1.989      0.047

 Residual Variances
    GRE               49.694      4.969     10.000      0.000
    GRAD              59.998      6.000     10.000      0.000


STANDARDIZED MODEL RESULTS


STDYX Standardization

                                                    Two-Tailed
                    Estimate       S.E.  Est./S.E.    P-Value

 GRE      ON
    HS                 0.335      0.068      4.887      0.000
    COL                0.396      0.068      5.859      0.000

 GRAD     ON
    HS                 0.356      0.070      5.073      0.000
    COL                0.108      0.073      1.467      0.142
    GRE                0.326      0.067      4.869      0.000

 Intercepts
    GRE                1.643      0.378      4.343      0.000
    GRAD               0.651      0.350      1.859      0.063

 Residual Variances
    GRE                0.556      0.052     10.611      0.000
    GRAD               0.523      0.051     10.240      0.000


R-SQUARE

    Observed                                        Two-Tailed
    Variable        Estimate       S.E.  Est./S.E.    P-Value

    GRE                0.444      0.052      8.477      0.000
    GRAD               0.477      0.051      9.333      0.000


QUALITY OF NUMERICAL RESULTS

     Condition Number for the Information Matrix              0.348E-04
       (ratio of smallest to largest eigenvalue)
Under MODEL RESULTS the path coefficients (slopes) for the regression of
gre on hs and
col are shown, followed by those for the regression grad on hs. Along with the unstandardized coefficients
(in the column labeled Estimate), the standard errors (S.E), coefficients divided by the standard errors, and a p-values
are shown. From this we see that hs and col significantly predict
gre, and that gre
and hs (but not col) significantly predict grad. Additional
parameters from the model are listed below the path coefficients. Note that
the regression intercepts are listed under the heading Intercepts rather than with the path coefficients,
this is
different from some general purpose statistical packages where all of the
coefficients (intercepts and slopes) are listed together. Because we requested standardized
coefficients using the stdyx option of the output: command, the standardized results are
also included in the output (after the unstandardized results). Under the
heading STDYX Standardization all of the model parameters are listed,
standardized so that a one unit change represents a standard deviation
change in the original variable (just as in a standardized regression
model). As part of the standardized
output the r-squared values are presented under the heading R-SQUARE. Here
the estimated r-squared value for each of the dependent variables in our
model is given, along with standard errors and hypothesis tests.
1.1 Indirect and Total Effects
One of the appealing aspects of path models is the ability
to assess indirect, as well as total
effects (i.e. relationships among variables). Note that the total effect is the combination
of the direct effect and indirect effects. In this example we will request the
estimated indirect effect of hs on grad (through gre).
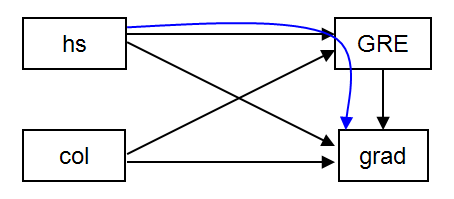
Below is the diagram corresponding to this model with the desired indirect
effect shown in blue. We
can obtain the estimate of the indirect effect by adding the model indirect: command to our
input file, and specifying grad ind hs;.
Here is the entire program; except for the highlighted portion of the output
(and the title) this model is identical to the previous model.
Title:  Path analysis -- with indirect effects.
Data:
  file is path.dat ;
Variable:
  Names are hs gre col grad;
Model:
    gre on hs col;
    grad on hs col gre;
Model indirect:
    grad ind hs;
Output:
    stdyx;
The output for this model is shown below, and some the output has
been omitted since the output for this model is the same as the previous model except for the addition of sections showing the
total, indirect and direct effects. The output is
the same because we have estimated the same model; adding the indirect
effects requests additional output from Mplus, but that does not change the model
itself. The breakdown of the total, indirect, and direct effects appears below the
MODEL RESULTS and STANDARDIZED MODEL RESULTS in a section labeled TOTAL, TOTAL
INDIRECT, SPECIFIC INDIRECT, AND DIRECT EFFECTS. Because standardized coefficients
were requested, the standardized total, indirect, and direct effects appear below the unstandardized effects.
MODEL RESULTS

                                                    Two-Tailed
                    Estimate       S.E.  Est./S.E.    P-Value

 GRE      ON
    HS                 0.309      0.065      4.756      0.000
    COL                0.400      0.071      5.625      0.000

 GRAD     ON
    HS                 0.372      0.075      4.937      0.000
    COL                0.123      0.084      1.465      0.143
    GRE                0.369      0.078      4.754      0.000

 Intercepts
    GRE               15.534      2.995      5.186      0.000
    GRAD               6.971      3.506      1.989      0.047

 Residual Variances
    GRE               49.694      4.969     10.000      0.000
    GRAD              59.998      6.000     10.000      0.000


<output omitted>

QUALITY OF NUMERICAL RESULTS

     Condition Number for the Information Matrix              0.348E-04
       (ratio of smallest to largest eigenvalue)


TOTAL, TOTAL INDIRECT, SPECIFIC INDIRECT, AND DIRECT EFFECTS


                                                    Two-Tailed
                    Estimate       S.E.  Est./S.E.    P-Value

Effects from HS to GRAD

  Total                0.487      0.075      6.453      0.000
  Total indirect       0.114      0.034      3.362      0.001

  Specific indirect

    GRAD
    GRE
    HS                 0.114      0.034      3.362      0.001

  Direct
    GRAD
    HS                 0.372      0.075      4.937      0.000


STANDARDIZED TOTAL, TOTAL INDIRECT, SPECIFIC INDIRECT, AND DIRECT EFFECTS


STDYX Standardization

                                                    Two-Tailed
                    Estimate       S.E.  Est./S.E.    P-Value

Effects from HS to GRAD

  Total                0.465      0.068      6.858      0.000
  Total indirect       0.109      0.032      3.455      0.001

  Specific indirect

    GRAD
    GRE
    HS                 0.109      0.032      3.455      0.001

  Direct
    GRAD
    HS                 0.356      0.070      5.073      0.000
Under Specific indirect, the effect labeled GRAD GRE HS (note each appears on
its own line and the final outcome is
listed first), gives the estimated coefficient for the indirect effect of hs on
grad,
through GRE (the blue path above). The coefficient labeled Direct is the direct effect
of hs on grad. We can say that part of the total effect of hs on
grad is mediated by gre scores, but the significant direct path from hs to grad
suggests only partial mediation.
1.2 Specific Indirect Effects
The above example was overly simple since
there was only one indirect effect. Often models will have
multiple indirect effects. In this example we place a directional path (i.e.
regression) from hs to col, creating a
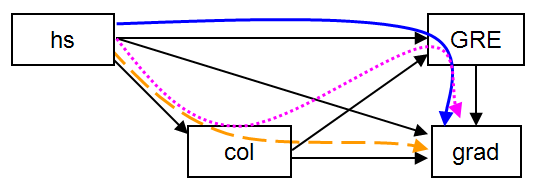
model with multiple possible indirect effects. The diagram below shows the
model, with the three indirect paths we wish to examine highlighted with
colored lines.
There are several ways to request calculation of indirect effects. The
first, shown in the previous example (i.e. grad ind
hs;) requests all indirect paths from hs to grad. We can also use
ind to request a specific indirect path, for example, below we use grad ind
col hs;, to specify that we want to estimate the indirect
effect from hs to col to grad (i.e. the dashed orange path
shown in the diagram above). Finally, we can use via to request all
indirect effects that go through a third variable, for example below we use
grad via gre hs; to request all indirect paths from hs to
grad that involve gre, this includes hs to gre to grad (i.e. the
solid blue path),
and hs to col to gre to grad (i.e. the dotted pink
path). The new
directional path (col on hs;), as well as the specific indirect (grad ind
col hs;) and via (grad via gre hs;) options of the
model indirect are highlighted in the input shown below.
Title: Multiple indirect paths
Data:
  file is path.dat ;
Variable:
  Names are hs gre col grad;
Model:
  gre on col hs;
  grad on hs col gre;
  col on hs;
Model indirect:
  grad ind col hs;
  grad via gre hs;
The abridged output is shown below. Note that the output
for this model is similar in structure to the output from earlier models,
except for the addition of the section showing the indirect effects.
<output omitted>

TOTAL, TOTAL INDIRECT, SPECIFIC INDIRECT, AND DIRECT EFFECTS


                                                    Two-Tailed
                    Estimate       S.E.  Est./S.E.    P-Value

Effects from HS to GRAD

  Sum of indirect      0.075      0.051      1.455      0.146

  Specific indirect

    GRAD
    COL
    HS                 0.075      0.051      1.455      0.146


Effects from HS to GRAD via GRE

  Sum of indirect      0.204      0.047      4.333      0.000

  Specific indirect
    GRAD
    GRE
    HS                 0.114      0.034      3.362      0.001

    GRAD
    GRE
    COL
    HS                 0.090      0.026      3.487      0.000
In the first set of indirect effects (labeled Effects from HS
to GRAD) gives the indirect effect of hs on grad through
col . Although we estimated a direct effect of hs on grad
in the model, this is not shown in this portion of the output (it is
shown above), because we requested the specific indirect
effect. The second set of indirect effects (labeled Effects from HS to
GRAD via GRE) shows all possible indirect effects from hs to
grad, that include GRE, in this case, there are two such
effects. This portion of the output shows that hs has a
significant indirect effect on
grad, overall (Sum of indirect), as well as the two specific
indirect effects, that is through gre, as well as through col
and
gre. Note that this output does not include the total effect of
grad on hs, for this output we would simply specify grad ind hs;
as we did in the previous model.
2.0 An Over Identified Model
This is an example of an overidentified model, that is a model with
positive degrees of freedom (as opposed to the previous models which can be
described as saturated or just identified). Having positive degrees of
freedom allows us to examine the fit of the model using
the chi-squared test of model fit, along with fit indices, for example, CFI and RMSEA. In the illustration
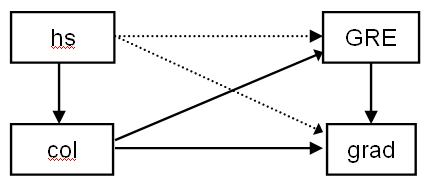
below, paths that are included in the model are represented by solid lines; paths that
could be estimated, but are not, are represented by dotted lines. Note that now hs
does not have a direct effect on either grad or gre, its only
influence is via col. This corresponds to the hypothesis that high
school gpa is only associated with GRE scores and graduate school grades
through its relationship with college gpa.
The input file for this model is shown below.
Title: Path analysis -- over identified model
Data:
  file is path.dat ;
Variable:
  Names are hs gre col grad;
Model:
  col on hs;
  gre on col;
  grad on col gre;
Output:
  stdyx;
Below is the output for this model.
INPUT READING TERMINATED NORMALLY

Path analysis -- over identified model

SUMMARY OF ANALYSIS

Number of groups                                                 1
Number of observations                                         200

Number of dependent variables                                    3
Number of independent variables                                  1
Number of continuous latent variables                            0

Observed dependent variables

  Continuous
   GRE         COL         GRAD

Observed independent variables
   HS


Estimator                                                       ML
Information matrix                                        OBSERVED
Maximum number of iterations                                  1000
Convergence criterion                                    0.500D-04
Maximum number of steepest descent iterations                   20

Input data file(s)
  https://stats.idre.ucla.edu/wp-content/uploads/2016/02/path.dat

Input data format  FREE


THE MODEL ESTIMATION TERMINATED NORMALLY


TESTS OF MODEL FIT

Chi-Square Test of Model Fit

          Value                             44.429
          Degrees of Freedom                     2
          P-Value                           0.0000

Chi-Square Test of Model Fit for the Baseline Model

          Value                            362.474
          Degrees of Freedom                     6
          P-Value                           0.0000

CFI/TLI

          CFI                                0.881
          TLI                                0.643

Loglikelihood

          H0 Value                       -2811.629
          H1 Value                       -2789.415

Information Criteria

          Number of Free Parameters             10
          Akaike (AIC)                    5643.258
          Bayesian (BIC)                  5676.242
          Sample-Size Adjusted BIC        5644.561
            (n* = (n + 2) / 24)

RMSEA (Root Mean Square Error Of Approximation)

          Estimate                           0.3266
          90 Percent C.I.                    0.247  0.412
          Probability RMSEA <= .05           0.000

SRMR (Standardized Root Mean Square Residual)

          Value                              0.086


MODEL RESULTS

                                                    Two-Tailed
                    Estimate       S.E.  Est./S.E.    P-Value

 COL      ON
    HS                 0.605      0.048     12.500      0.000

 GRE      ON
    COL                0.625      0.056     11.101      0.000

 GRAD     ON
    COL                0.317      0.079      4.014      0.000
    GRE                0.492      0.078      6.303      0.000

 Intercepts
    GRE               19.887      3.009      6.609      0.000
    COL               21.038      2.576      8.165      0.000
    GRAD               9.779      3.664      2.669      0.008

 Residual Variances
    GRE               55.313      5.531     10.000      0.000
    COL               49.025      4.903     10.000      0.000
    GRAD              67.311      6.731     10.000      0.000


STANDARDIZED MODEL RESULTS


STDYX Standardization

                                                    Two-Tailed
                    Estimate       S.E.  Est./S.E.    P-Value

 COL      ON
    HS                 0.662      0.040     16.684      0.000

 GRE      ON
    COL                0.617      0.044     14.112      0.000

 GRAD     ON
    COL                0.276      0.068      4.092      0.000
    GRE                0.434      0.065      6.671      0.000

 Intercepts
    GRE                2.103      0.397      5.298      0.000
    COL                2.251      0.363      6.210      0.000
    GRAD               0.913      0.375      2.436      0.015

 Residual Variances
    GRE                0.619      0.054     11.452      0.000
    COL                0.561      0.053     10.677      0.000
    GRAD               0.587      0.053     11.002      0.000


R-SQUARE

    Observed                                        Two-Tailed
    Variable        Estimate       S.E.  Est./S.E.    P-Value

    GRE                0.381      0.054      7.056      0.000
    COL                0.439      0.053      8.342      0.000
    GRAD               0.413      0.053      7.743      0.000


QUALITY OF NUMERICAL RESULTS

     Condition Number for the Information Matrix              0.104E-03
       (ratio of smallest to largest eigenvalue)
The chi-squared value compares the current model to a saturated
model. Since our model is not saturated (i.e., our model has positive degrees
of freedom), the chi-squared value is no longer zero and may be used to
evaluative model fit. Similarly, the CFI and TLI which were equal to one in the
just identified model now take on informative values. Further down, the RMSEA and SRMR now
take on informative values (in a just identified model, they are displayed as zero).
Having positive degrees of freedom, and hence, informative values of the fit
indices allows us to better evaluate how well our model fits the data. The specific
coefficient estimates from this model are generally interpreted as
they were in the just identified model.