
Hypothetical Scenarios
Example 1
You are interested in studying drinking behavior among adults. Rather than
conceptualizing drinking behavior as a continuous variable, you conceptualize it
as forming distinct categories or typologies. For example, you think that people
fall into one of three different types: abstainers, social drinkers and
alcoholics. Since you cannot directly measure what category someone falls into,
this is a latent variable (a variable that cannot be directly measured). However,
you do have a number of indicators that you believe are useful for categorizing
people into these different categories. Using these indicators, you would like
to:
- Create a model that permits you to categorize these people into three
different types of drinkers, hopefully fitting your conceptualization that there
are abstainers, social drinkers and alcoholics. - Be able to categorize people as to what kind of drinker they are.
- Count how many people would be considered abstainers, social drinkers
and alcoholics. - Determine whether three latent classes is the right number of classes
(i.e., are there only two types of drinkers or perhaps are there as many as
four types of drinkers).
Example 2
High school students vary in their success in school. This might
be indicated by the grades one gets, the number of absences one has, the number
of truancies one has, and so forth. A traditional way to conceptualize this
might be to view “degree of success in high school” as a latent variable (one
that you cannot directly measure) that is normally distributed. However, you
might conceptualize some students who are struggling and having trouble as
forming a different category, perhaps a group you would call “at risk” (or in
older days they would be called “juvenile delinquents”). Using indicators like
grades, absences, truancies, tardies, suspensions, etc., you might try to
identify latent class memberships based on high school success.
Data Description
Let’s pursue Example 1 from above. We have a hypothetical data file that
we created that contains 9 fictional measures of drinking behavior. For each
measure, the person would be asked whether the description applies to
him/herself (yes or no). The 9 measures are
- I like to drink
- I drink hard liquor
- I have drank in the morning
- I have drank at work
- I drink to get drunk
- I like the taste of alcohol
- I drink help me sleep
- Drinking interferes with my relationships
- I frequently visit bars
We have made up data for 1000 respondents and stored the data in a file
called https://stats.idre.ucla.edu/wp-content/uploads/2016/02/lca1.dat, which is a comma-separated file with the subject id followed by
the responses to the 9 questions, coded 1 for yes and 0 for no. Using Stata,
here is what the first 10 cases look like
list id item1-item9 in 1/10

     +----------------------------------------------------------------------------+
     | id   item1   item2   item3   item4   item5   item6   item7   item8   item9 |
     |----------------------------------------------------------------------------|
  1. |  1       1       0       0       0       0       0       0       0       0 |
  2. |  2       1       1       0       1       1       1       1       0       0 |
  3. |  3       1       0       0       0       0       0       0       0       0 |
  4. |  4       1       0       0       0       0       1       1       0       0 |
  5. |  5       1       0       0       0       1       0       0       0       1 |
     |----------------------------------------------------------------------------|
  6. |  6       0       1       0       0       0       1       0       0       0 |
  7. |  7       1       1       0       0       0       0       0       0       1 |
  8. |  8       1       0       1       0       0       0       0       0       0 |
  9. |  9       1       0       0       0       0       0       0       1       0 |
 10. | 10       0       0       0       0       0       1       0       0       0 |
     +----------------------------------------------------------------------------+
Some Strategies You Might Try
Before we show how you can analyze this with Latent Class Analysis, let’s
consider some other methods that you might use:
- Cluster Analysis – You could use cluster analysis for data like these.
However, cluster analysis is not based on a statistical model. It can tell
you how the cases are clustered into groups, but it does not provide
information such as the probability that a given person is an alcoholic or
abstainer. Also, cluster analysis would not provide information such as:
given that someone said “yes” to drinking at work, what is the probability
that they are an alcoholic. - Factor Analysis – Because the term “latent variable” is used, you might
be tempted to use factor analysis since that is a technique used with latent
variables. However, factor analysis is used for continuous and usually
normally distributed latent variables, where this latent variable, e.g.,
alcoholism, is categorical.
Mplus Results Using Latent Class Analysis
Note that I am showing you results before showing you the program. I will
show you the program later.
Conditional Probabilities
First, the probability of answering “yes” to each question is shown for each
type of drinker (latent class). For example, consider the question “I have drank at work”. The
probability of answering “yes” to this might be 70% for the first class, 10%
for the second class, and 9% for the third class. This would be consistent
with the first class being alcoholics. Looking at the pattern of responses
for all classes gives you an overall picture of the meaning of the three
classes that are identified and helps us create descriptive labels for the
classes. We are hoping to find three classes that correspond to abstainers,
social drinkers, and alcoholics. Abstainers would have a pattern that they
generally avoid drinking, social drinkers would show a pattern of drinking
but generally in moderation and seldom in self-destructive ways, while
alcoholics would show a pattern of drinking frequently and in very
self-destructive ways.
The Mplus output shows a section labeled
RESULTS IN PROBABILITY SCALE
which contains the conditional probabilities as describe above, but it is hard to read. I have
reformatted that output to make it easier to read, shown below. Each row
represents a different item, and the three columns of numbers are the
probabilities of answering “yes” to the item given that you belonged to that
class. So, if you belong to Class 1, you have a 90.8% probability of saying “yes,
I like to drink”. By contrast, if you belong to Class 2, you have a 31.2% chance
of saying “yes, I like to drink”.
         Class 1  Class 2  Class 3    Item Label
 ITEM1    0.908    0.312    0.923     I like to drink
 ITEM2    0.337    0.164    0.546     I drink hard liquor
 ITEM3    0.067    0.036    0.426     I have drank in the morning
 ITEM4    0.065    0.056    0.418     I have drank at work
 ITEM5    0.219    0.044    0.765     I drink to get drunk
 ITEM6    0.320    0.183    0.471     I like the taste of alcohol
 ITEM7    0.113    0.098    0.512     I drink help me sleep
 ITEM8    0.140    0.110    0.619     Drinking interferes with my relationships
 ITEM9    0.325    0.188    0.349     I frequently visit bars
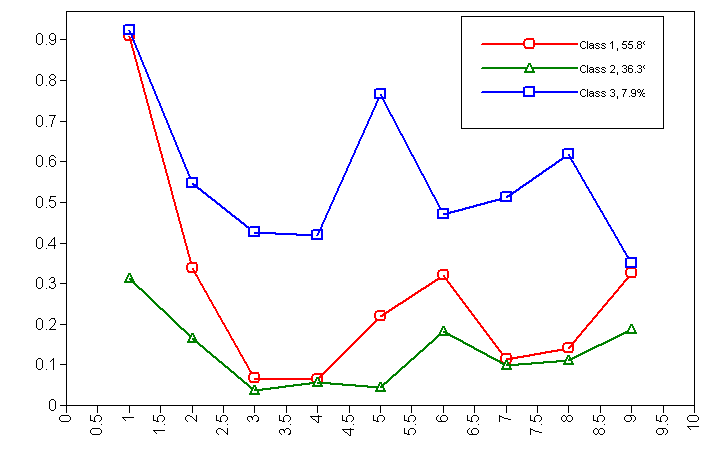
Looking at item1, those in Class 1 and Class 3 really like to drink (with
90.8% and 92.3% saying yes) while those in Class 2 are not so fond of drinking
(they have only a 31.2% probability of saying they like to drink). Jumping
to item5, 76.5% of those in Class 3 say they drink to get drunk, while 21.9% of
those in Class 1 agreed to that, and only 4.4% of those in Class 2 say that.
I am starting to believe that Class 3 may be labeled as “alcoholics”.
Focusing just on Class 3 (looking at that column), they really like to drink
(92%), drink hard liquor (54.6%), a pretty large number say they have drank in
the morning and at work (42.6% and 41.8%), and well over half say drinking
interferes with their relationships (61.9%).
It seems that those in Class 2 are the “abstainers” we were
hoping to find. Not many of them like to drink (31.2%), few like the taste of
alcohol (18.3%), few frequently visit bars (18.8%), and for the rest of the
questions they rarely answered “yes”.
This leaves Class 1; might they fit the idea of the “social drinker”? They
like to drink (90.8%), but they don’t drink hard liquor as often as Class 3 (33.7%
versus 54.6%). They rarely drink in the morning or at work (6.7% and 6.5%) and
rarely say that drinking interferes with their relationships (14%). They say
they frequently visit bars similar to Class 3 (32.5% versus 34.9%), but that might
make sense. Both the social drinkers and alcoholics are similar in how much they
like to drink and how frequently they go to bars, but differ in key ways such as
drinking at work, drinking in the morning, and the impact of drinking on their
relationships.
While we should study these conditional probabilities some more, I think we
can start to assign labels to these classes. As I hypothesized, the classes seem
to make sense to be labeled “social drinkers” (which is Class 1), “abstainers”
(which is Class 2), and “alcoholics” (which is Class 3).
We can also take the results from the above table and express it as a graph.
The X axis represents the item number and the Y axis represents the probability
of answering “yes” to the given item, given that you belong to a particular
drinking class. The three drinking classes are represented as the three
different lines.
Class Membership
For each person, Mplus will estimate what class the person
belongs to (i.e., what type of drinker the person is). For a given person,
Mplus estimates the probability that the person belongs to the first,
second, or third class. For example, for subject 1 these probabilities might
be 15% that the person belongs to the first class, 80% probability of
belonging to the second class, and 5% of belonging to the third class. For
such a person I would say that I think the person belongs to the second class
since that class was the most likely. Mplus will also categorize people
into a single class using the same kind of rule.
Mplus creates an output file which contains the original data used in the
analysis (i.e., item1 to item9) followed by the probability that Mplus estimates
that the observation belongs to Class 1, Class2, and Class 3. Next, the class
with the highest probability (the modal class) is shown. I have taken a snippet
of the output and labeled it to make it easier to read.
Items 1 - 9
----------------- P(c1) P(c2) P(c3) Class
1 0 0 0 0 0 0 0 0 0.645 0.354 0.001 1
1 1 0 1 1 1 1 0 0 0.098 0.001 0.901 3
1 0 0 0 0 0 0 0 0 0.645 0.354 0.001 1
1 0 0 0 0 1 1 0 0 0.797 0.177 0.026 1
1 0 0 0 1 0 0 0 1 0.934 0.041 0.025 1
0 1 0 0 0 1 0 0 0 0.312 0.686 0.002 2
1 1 0 0 0 0 0 0 1 0.903 0.092 0.005 1
1 0 1 0 0 0 0 0 0 0.766 0.218 0.017 1
1 0 0 0 0 0 0 1 0 0.696 0.290 0.014 1
0 0 0 0 0 1 0 0 0 0.149 0.850 0.000 2
For the first observation, the pattern of responses to the items suggests
that the person has a 64.5% chance of being in Class 1 (which we
called social drinkers), a 35.4% chance of being in Class 2 (abstainer), and a
0.1% chance of being in Class 3 (alcoholic). Note that these
sum to 100% (since a person has to be in one of these classes).
For this person, Class 1 is the most likely class, and Mplus indicates that in
the last column. It is interesting to note that for this person, the pattern of
results made it almost certain that s/he was not alcoholic, but it was less
clear whether s/he was a social drinker or an abstainer (perhaps because the
person said “yes” to item 1 (I like to drink). Note how the third row of data has
the same pattern of responses for the items and has the same predicted class
probabilities. Consider row 2 of the data. This person has a 90.1% chance of
being an alcoholic, a 9.8% chance of being a social drinker, and a 0.1% chance of being an abstainer. One important point to note here is
that for some subjects, the class membership is pretty well determined (like
subject 2), while it is a bit more ambiguous (like subjects 1 and 3) where there
is no single class that they certainly belong to.
Size of Classes
Once we have come up with a descriptive label for each of the
classes, we can look at the number of people who are categorized into each
of the classes. I predict that about 20% of people are abstainers, 70% are
social drinkers, and about 10% are alcoholics. I can compare my predictions
to the results that Mplus produces.
How many alcoholics are there? How many abstainers are there? How many social
drinkers are there? One simple way we could determine this is by taking the information
from the Class Membership above and doing a simple tabulation on the last
column. In fact, the Mplus output provides this to you like this.
CLASSIFICATION OF INDIVIDUALS BASED ON THEIR MOST LIKELY LATENT CLASS MEMBERSHIP

Class Counts and Proportions

    Latent
   Classes
       1              646          0.64600
       2              288          0.28800
       3               66          0.06600
Out of the 1,000 subjects we had, 646 (64.6%) are categorized as Class 1
(which we label as social drinkers), 66 (6.6%) are categorized as Class 3
(alcoholics), and 288 (28.8%) are categorized as Class 2 (abstainers). This is
consistent with my hunches that most people are social drinkers, a very small
portion are alcoholics, and a moderate portion are abstainers.
There is a second way we could compute the size of the classes. Consider
subject 1 from the above output on class membership. Rather than considering
this person as entirely belonging to class 1, we could allocate
membership to the classes in proportion to the probability of being in each
class. So, subject 1 has fractional memberships in each class, 0.645 to Class 1,
0.001 to Class 3, and 0.354 to Class 2. Mplus also computes the class sizes in
this manner, as shown below.
FINAL CLASS COUNTS AND PROPORTIONS FOR THE LATENT CLASS PATTERNS
BASED ON ESTIMATED POSTERIOR PROBABILITIES

    Latent
   Classes
       1        557.56836          0.55757
       2        363.13989          0.36314
       3         79.29175          0.07929
These two methods yield largely similar results, but this second method
suggests that there are somewhat more abstainers (36.3%) compared to the
previous method (28.8%) and slightly fewer social drinkers (55.7% compared to
64.6%), but these differences are not very troublesome to me.
Number of Classes
So far we have been assuming that we have chosen the right number of latent
classes. Perhaps, however, there are only two types of drinkers, or perhaps
there are four or more types of drinkers. So far we have liked the three class
model, both based on our theoretical expectations and based on how interpretable
our results have been. We can further assess whether we have chosen the right
number of classes using the Vuong-Lo-Mendell-Rubin test (requested using TECH11,
see Mplus program below) and the bootstrapped parametric likelihood ratio test
(requested using TECH 14, see Mplus program below). This test compares the
model with K classes (in our case 3) to a model with (K-1) classes (in our case,
K – 1 = 2 classes). The results are shown below.
TECHNICAL 11 OUTPUT

     VUONG-LO-MENDELL-RUBIN LIKELIHOOD RATIO TEST FOR 2 (H0) VERSUS 3 CLASSES
          H0 Loglikelihood Value                        -4251.208
          2 Times the Loglikelihood Difference             39.025
          Difference in the Number of Parameters               10
          Mean                                             20.255
          Standard Deviation                               22.224
          P-Value                                          0.1457

     LO-MENDELL-RUBIN ADJUSTED LRT TEST
          Value                                            38.468
          P-Value                                          0.1500

TECHNICAL 14 OUTPUT

     BOOTSTRAPPED PARAMETRIC LIKELIHOOD RATIO TEST FOR 2 (H0) VERSUS 3 CLASSES
          H0 Loglikelihood Value                        -4251.208
          2 Times the Loglikelihood Difference             39.025
          Difference in the Number of Parameters               10
          Approximate P-Value                              0.0000
The Vuong-Lo-Mendell-Rubin test has a p-value of .1457 and the Lo-Mendell-Rubin
adjusted LRT test has a p-value of .1500. Those tests suggest that two classes
are sufficient and that three classes are not really needed. However, the
bootstrapped parametric likelihood ratio test has a p value of 0.0000, so this
test suggests that three classes are indeed better than two classes. Because we
have seen unpublished results that suggest that the bootstrap method may be more
reliable, and the three class model fits our theoretical expectations, we will
go with the three class model.
The Mplus Program
Here is the whole Mplus program
Title:
  Fictitious Latent Class Analysis.
Data:
  File is lca1.dat ;
Variable:
  names        = id item1 item2 item3 item4 item5 item6 item7 item8 item9;
  usevariables = item1 item2 item3 item4 item5 item6 item7 item8 item9;
  categorical  = item1 item2 item3 item4 item5 item6 item7 item8 item9;
  classes = c(3);
Analysis:
  Type=mixture;
Plot:
  type is plot3;
  series is item1 (1) item2 (2) item3 (3) item4 (4) item5 (5)
            item6 (6) item7 (7) item8 (8) item9 (9);
Savedata:
  file is lca1_save.txt ;
  save is cprob;
  format is free;
output:
  tech11 tech14;
- Title gives a title to the program.
- Data tells Mplus about the data file, in particular that the data are stored in the file lca1.dat which is the in the same folder or path as the command INP file.
- Variable tells Mplus more about the variables in the data file. The names statement lists the names of the variables (in the order they appear in the data file). The usevariables statement indicates which variables we will use for this analysis. The categorical statement indicates that the specified variables are categorical variables. The classes statement indicates that there is one categorical latent variable (which we will call c), and it has 3 levels.
- Analysis specifies the type of analysis as a mixture model, which is how you request a latent class analysis.
- Plot is used to make the plot we created above. The type was plot3, and the series statement is used to associate
the items with the X axis, with item1 labeled as 1, item2 labeled as 2 … and item9 labeled as 9 on the X axis. - Savedata saves the original data file along with additional statistics in it. The data file will be named
lca1_save.txt and the save statement indicates we want to save the class probabilities, i.e., for each case the probability that case belongs to class 1, class 2 and class 3. This also saves the modal class membership. The format of the file is free, space separated. - Output requests additional output. In this case, the tech11 option requests the Vuong-Lo-Mendell-Rubin test for
assessing the number of classes and the tech14 option requests the bootstrapped parametric likelihood ratio test.
Cautions, Flies in the Ointment
We have focused on a very simple example here just to get you started. Here are
some problems to watch out for.
- Have you specified the right number of latent classes? Perhaps you have
specified too many classes (i.e., people largely fall into 2 classes) or you
may have specified too few classes (i.e., people really fall into 4 or more
classes). - Are some of your measures/indicators lousy? All of our measures were
really useful in distinguishing what type of drinker the person was.
However, say we had a measure that was “Do you like broccoli?”. This would
be a poor indicator, and each type of drinker would probably answer in a
similar way, so this question would be a good candidate to discard. - Having developed this model to identify the different types of drinkers,
we might be interested in trying to predict why someone is an alcoholic, or
why someone is an abstainer. For example, we might be interested in whether
parental drinking predicts being an alcoholic. Such analyses are possible,
but not discussed here. (references forthcoming)
See Also
- Stat Books for Loan
- Latent Class Scaling Analysis by C. Mitchell Dayton
- Applied Latent Class Analysis Edited by Jacques A. Hagenaars and Allan L. McCutcheon
- Latent Class Analysis by Allan L. McCutcheon