If you have been working on your data in SPSS, but need to move to Mplus to complete your analysis, you can prepare and save your data in a form that Mplus can read. We will be preparing the dataset sample.sav. We can take a quick glance at the first 10 observations in this dataset.
list /cases from 1 to 10.female race ses schtyp read write . 3.00 1.00 1.00 34.00 35.00 .00 -9.00 2.00 1.00 44.00 41.00 .00 4.00 -99.00 1.00 55.00 39.00 1.00 2.00 3.00 -999.00 60.00 59.00 .00 4.00 1.00 1.00 -9999.00 37.00 .00 4.00 2.00 1.00 34.00 -99999.00 .00 3.00 2.00 1.00 34.00 37.00 1.00 4.00 1.00 1.00 35.00 35.00 .00 4.00 3.00 1.00 44.00 33.00 1.00 4.00 3.00 2.00 36.00 57.00 Number of cases read: 10 Number of cases listed: 10
Step 0. Summary statistics
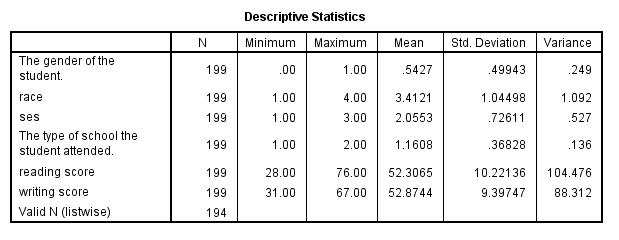
While not a required step, running summary statistics in SPSS before moving to Mplus provides a needed reference point for checking that your data has been read into Mplus correctly. If the summary statistics you see in Mplus do not match these that were calculated before the transfer, you will know to check for errors in the process.
desc var=all
  /stat=default variance.
Step 1. Numeric data only
Mplus cannot read in character data, so any character variables in your dataset must either be converted to numeric or omitted. Looking at the variable view of our dataset,
we can see that all of our variables are numeric. For details on recoding variables, see our SPSS Learning Modules.
Step 2. Short variable names
Variable names in Mplus cannot exceed 8 characters. If your variable names exceed this length, they must be shortened. All of our variable names are 8 or fewer characters.
Step 3. Missing values
Before reading your data into Mplus, you must be familiar with whether or not your data contain missing values and, if they do, how those values are coded. In Mplus, you will need to explicitly list out the values that represent missing data. In our dataset, we can see that different variables have different values for missing. We can note which variables have which system missing values in SPSS: (.) for female, -9 for race, -99 for ses, -999 for schtyp, -9999 for read, and -99999 for write. Note that although missing values for female are shown with a dot (.) in the SPSS Data Editor, in the .csv file, they will be a blank.
Step 4. Save as .csv
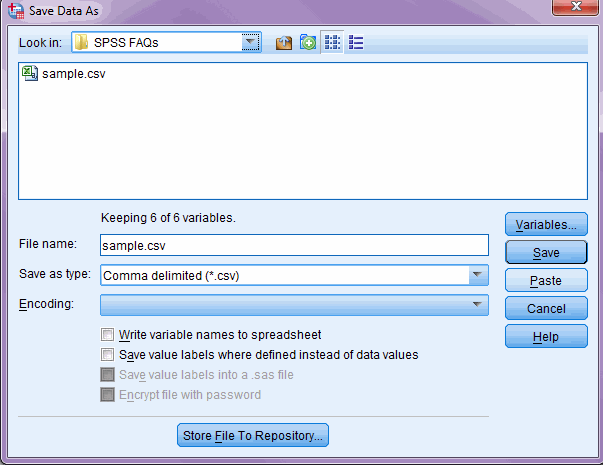
Mplus can easily read comma separated data, so we can save our dataset as a .csv file. This can be done by choosing File, Save as, and then choosing “Comma delimited” from the “Save as type” drop down list. Also, we do not want the .csv file we create to include variable names, so we uncheck the “Write variable names to spreadsheet” box.
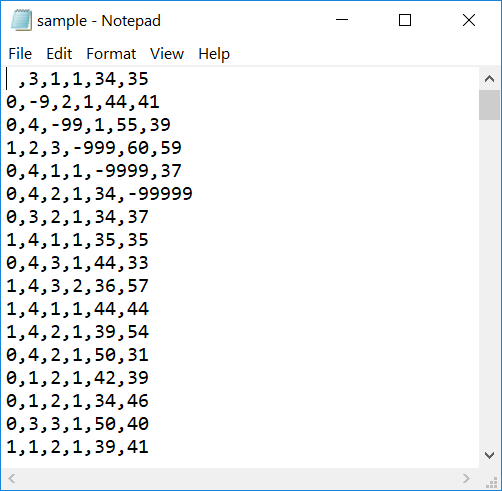
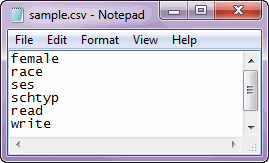
We can open the .csv file in Notepad or another text editor to see what our raw data looks like.
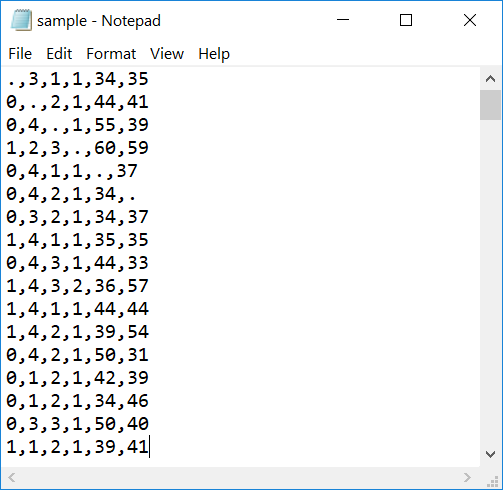
Note that Mplus cannot read blanks as missing, nor can it have a period and a numeric missing value (e.g., -999) in the same file (yes, it’s very picky). For convenience we manually replace every missing value to a period (.) and re-save the file. Here’s what it should look like before importing the data into Mplus.
Step 5. List of variable names
Instead of providing Mplus with a dataset containing variable names, you instead direct Mplus to a file without names and give the names within the Mplus code. To make this easier, we can save the variable names quickly from SPSS by copying them from the Variable View window and pasting them into a new text editor or directly into an Mplus input file.
We are now ready to read our data into Mplus. In the code below, we indicate the location of the .csv file we saved (NOTE: Mplus limits input lines to 80 characters, so a lengthy pathname may cause an error.) and indicate listwise deletion should be used in the analysis, just as we did in SPSS. We paste our list of variables in the Variable: block after Names are. In the next line, we indicate that all variables have a period as its missing value. Lastly, we indicate Type = basic in the Analysis: block so that the output includes summary statistics that allow us to check that the data was read in correctly. Below the code, we have printed some of the output that can be used to 1) make sure our missing values were correctly entered and 2) check the variable means. Make sure that your sample.csv file is in the same folder as your Mplus INP file.
Title:
  Entering data from .csv file
Data:
  File is "sample.csv";
Variable:
  Names are
	female race ses schtyp read write;
Missing are .;
Analysis:
  Type = basic;

  INPUT READING TERMINATED NORMALLY

< ... output omitted ... >

SUMMARY OF MISSING DATA PATTERNS


     MISSING DATA PATTERNS (x = not missing)

           1  2  3  4  5  6  7
 FEMALE    x  x  x  x  x  x
 RACE      x  x  x  x  x     x
 SES       x  x  x  x     x  x
 SCHTYP    x  x  x     x  x  x
 READ      x  x     x  x  x  x
 WRITE     x     x  x  x  x  x


     MISSING DATA PATTERN FREQUENCIES

    Pattern   Frequency     Pattern   Frequency     Pattern   Frequency
          1         194           4           1           7           1
          2           1           5           1
          3           1           6           1

< ... output omitted ... >

UNIVARIATE SAMPLE STATISTICS


     UNIVARIATE HIGHER-ORDER MOMENT DESCRIPTIVE STATISTICS

         Variable/         Mean/     Skewness/   Minimum/ % with                Percentiles
        Sample Size      Variance    Kurtosis    Maximum  Min/Max      20%/60%    40%/80%    Median

     FEMALE                0.543      -0.171       0.000   45.73%       0.000      0.000      1.000
             199.000       0.248      -1.971       1.000   54.27%       1.000      1.000
     RACE                  3.412      -1.523       1.000   12.06%       3.000      4.000      4.000
             199.000       1.086       0.736       4.000   71.36%       4.000      4.000
     SES                   2.055      -0.084       1.000   23.62%       1.000      2.000      2.000
             199.000       0.525      -1.092       3.000   29.15%       2.000      3.000
     SCHTYP                1.161       1.847       1.000   83.92%       1.000      1.000      1.000
             199.000       0.135       1.410       2.000   16.08%       1.000      1.000
     READ                 52.307       0.192      28.000    0.50%      44.000     47.000     50.000
             199.000     103.951      -0.627      76.000    1.01%      55.000     63.000
     WRITE                52.874      -0.478      31.000    2.01%      44.000     52.000     54.000
             199.000      87.869      -0.751      67.000    3.52%      57.000     62.000
We can compare these missing data patterns and means to our summaries from SPSS. In both datasets, we have 194 complete cases and our variable means match.

