
Let’s look at an example. This example is based on example 5.1 from the Mplus
User’s Guide. (Note: the Mplus User’s Guide, as well as all files needed to
run the examples can be downloaded from the
Mplus website.)
    data: file is ex5.8.dat;
    variable:
      names are y1-y6 x1-x3;
      usevariables are y1-y6;
    model:
      f1 by y1-y3;
      f2 by y4-y6;
In the above confirmatory factor (or measurement) model we specify two latent variables f1 and f2, which are
measured by the manifest variables y1-y3 and y4-y6
respectively. Our input file contains relatively little information about
how the model should be structured, so Mplus will
apply a number of defaults to our model when we run it.
By default, Mplus does the following:
- Sets the path loading from each factor to the first indicator
variable listed after by in order to identify the model. In our example this means setting the path from y1 to be 1.
It does the same for the path from f2 to y4. Note that the path between the
latent variable and any of the manifest variables can be set to 1, it just happens that Mplus
selects the first manifest variable listed by default. Also note that this is not
the only way to identify a latent variable. - Frees the variances of the errors of the manifest variables.
- Sets the covariances between the errors of the manifest variables to be zero,
that is, it specifies no relationship between the manifest variables that is
not accounted for by their relationship to the latent variable that predicts
them and/or the correlation between that latent variable and the other variables in the
model. - Frees the intercepts of the manifest variables.
- Frees the variances of the latent variables (f1 and f2).
- Frees the covariance between the latent variables (f1 and f2) that is,
it allows the latent variables
to be correlated.
The figure below shows the model estimated by Mplus based on the input
file above and Mplus defaults. Paths with a one ("1") next to them are
constrained to one, paths with an asterisks are freely estimated. An
asterisks next to a variable indicates that variables variance is estimated.
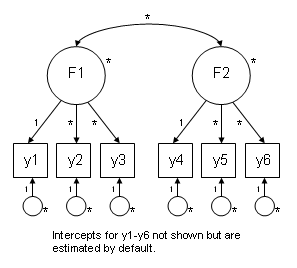
We can confirm these defaults by looking at the output Mplus produces. For example,
under "F1 BY" we see that the factor loading for Y1 is 1.00,
confirming that Mplus did fix the first factor loading to one. We can also see
that the covariance between the two latent variables (under “F2 WITH”) is -0.030, with
a standard error of 0.052, so we know that Mplus has estimated this as well.
<output omitted>

	MODEL RESULTS

                                                    Two-Tailed
                    Estimate       S.E.  Est./S.E.    P-Value

 F1       BY
    Y1                 1.000      0.000    999.000    999.000
    Y2                 1.127      0.099     11.367      0.000
    Y3                 1.020      0.089     11.481      0.000

 F2       BY
    Y4                 1.000      0.000    999.000    999.000
    Y5                 1.059      0.129      8.200      0.000
    Y6                 0.897      0.105      8.532      0.000

 F2       WITH
    F1                -0.030      0.052     -0.582      0.560

 Intercepts
    Y1                -0.022      0.063     -0.354      0.723
    Y2                 0.026      0.062      0.410      0.682
    Y3                 0.035      0.062      0.555      0.579
    Y4                -0.022      0.064     -0.350      0.726
    Y5                -0.016      0.058     -0.271      0.786
    Y6                 0.048      0.058      0.824      0.410

 Variances
    F1                 0.907      0.125      7.253      0.000
    F2                 0.761      0.133      5.735      0.000

 Residual Variances
    Y1                 1.064      0.096     11.120      0.000
    Y2                 0.798      0.100      7.971      0.000
    Y3                 1.010      0.095     10.597      0.000
    Y4                 1.290      0.119     10.869      0.000
    Y5                 0.854      0.111      7.712      0.000
    Y6                 1.067      0.097     11.026      0.000