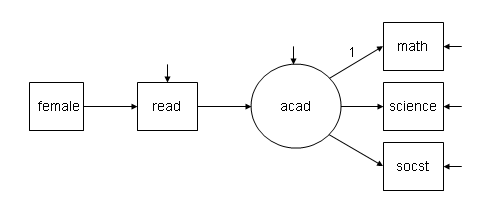
Below is the diagram of a simple structural equation model. The dependent variable is a latent variable acad with three observed indicators, math, science and socst. There are two additional observed variables, the independent variable female and a mediator variable read. Note that variables in squares are observed, those in circles are latent. The short arrows into some of the variables are error terms.

Data:
	File is D:\data\hsb2.dat;
Variable:
	Names are id female race ses schtyp prog read
		write math science socst;
	Usevariables are female read math science socst;
Analysis:
	Type = general;
Model:
	acad by math science socst;
	acad on read;
	read on female;
Most of the output is omitted; only the relevant section of the output is shown. The chi-square test statistic for our model is 12.251, while the chi-square test statistic is 361.012 for the baseline model. Also notice that while our model has 5 degrees of freedom, the baseline model has 10, indicating that it involves estimating 5 fewer parameters. Since lower chi-square values indicate better fit, the output suggests that our model fits much better than the baseline model. But what exactly is the baseline model?
Chi-Square Test of Model Fit

          Value                             12.251
          Degrees of Freedom                     5
          P-Value                           0.0315

Chi-Square Test of Model Fit for the Baseline Model

          Value                            361.012
          Degrees of Freedom                    10
          P-Value                           0.0000
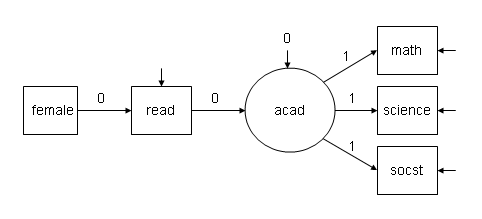
The baseline model Mplus prints the chi-square statistic for is a model where all of the structural (regression) paths are assumed to be zero (i.e., a null model). For the measurement model, all measurement paths from the latent variable to the observed indicator are 1, and the variance of the latent variable is 0 (since setting the path coefficients to one makes the latent variable just a linear composite of the indicator variables). Only the intercepts and residual variances of the observed endogenous (dependent) variables (i.e., read, math, science, and socst ) are estimated. We can verify that the baseline model is what we expect by specifying the baseline model (or what we think the baseline model should be) in Mplus. If we are correct, the chi-square statistics printed for this model and the statistics printed under the heading for the baseline model will match. The path diagram for the baseline model is shown below.

Data:
	File is D:documentsmplus_defaultshsb2.dat ;
Variable:
	Names are id female race ses schtyp prog read
		write math science socst;
	Usevariables are female read math science socst;
Analysis:
	Type = general;
Model:
	acad by math@1 science@1 socst@1;
	acad@0;
	acad on read@0;
	read on female@0;
Below we see that the chi-square fit for our model and for the baseline model. Both the chi-square values and the number of degrees of freedom match, so we know the model we have specified is the same as the baseline model.
Chi-Square Test of Model Fit

          Value                            361.012
          Degrees of Freedom                    10
          P-Value                           0.0000

Chi-Square Test of Model Fit for the Baseline Model

          Value                            361.012
          Degrees of Freedom                    10
          P-Value                           0.0000
