Mplus version 5.2 was used for these examples.
1.0 Exploratory factor analysis
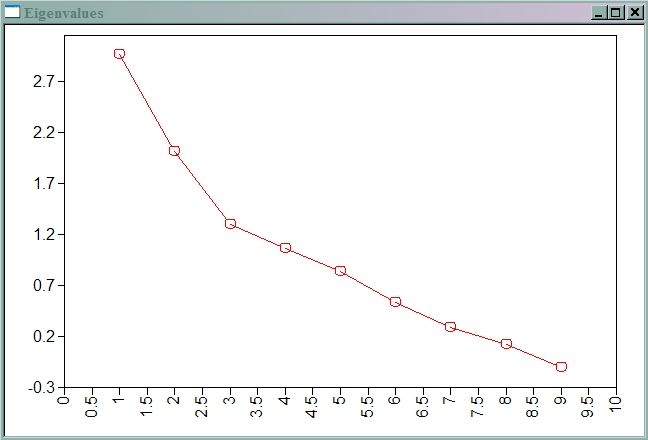
Mplus has many nice features to assist researchers conducting exploratory factor analysis. In the example below, we use the m255_mplus_notes_efa data set, which contains continuous, dichotomous and ordered categorical variables. Our data set has missing values on several of the variables that will be used in the analysis. After declaring the data set, we use the listwise statement. Unlike many other statistical packages, Mplus does not use listwise deletion by default. Mplus provides several methods of handling the missing data: listwise deletion, full information maximum likelihood (FIML) and FIML with auxiliary variables. (Mplus can also use multiply imputed data sets, although it will not create multiply imputed data sets.) In this example, we will use listwise deletion. If this statement was omitted, Mplus would use FIML to estimate the EFA with all of the information in the data set. The missing statement is included to show how it would be used, but in this example, it is unnecessary. On the categorical statement, we declare all of our dichotomous and ordered categorical variables. On the analysis statement, we indicate that we want to run an EFA. After that specification, two numbers are needed. The first number indicates the minimum number of factors to extract, and the second number indicates the maximum number of factors to extract. Mplus will produce solutions for the number of factors between the minimum and maximum. In our example, we ask for only three factors (so we have 3 for both the first and the second number). In the commented out analysis statement, we ask for a minimum of 1 and a maximum of 3 factors; hence, Mplus will produce a 1, 2 and 3 factor solution. By default, Mplus provides a geomin rotated solution. (Geomin is an oblique type of rotation, so the correlations between the factors are given in the output.) Mplus offers 27 different types of rotations, which are described in the Mplus User’s Guide. We have commented out an example of using the rotation statement to request a varimax rotation. Finally, we request a scree plot on the plot statement using type = plot2. To see the plots requested, click on Graphs and then View Graphs.
Besides having several options for handling missing data and handling dichotomous and ordered categorical variables, Mplus can also conduct EFAs with survey data (data that contain sampling weights, clustering and/or stratification). As you can see in the output, standard errors are provided for the factor loadings.
For information on the interpretation of the output, please visit our Annotated Mplus Output: Exploratory Factor Analysis page.
title:  Exploratory factor analysis with categorical and continuous
        variables.
data:  file is "f:https://stats.idre.ucla.edu/wp-content/uploads/2016/02/m255_mplus_notes_efa.txt";
listwise is on;
variable:  names are facsex facnat facrank studrnk1 grade
                     salary yrsteach yrsut nstud sample;
           usevar are facsex facnat facrank studrnk1 grade
                      salary yrsteach yrsut nstud;
           missing are all (-9);
           categorical are facsex facnat facrank studrnk1 grade;
analysis:  type = efa 3 3;
! analysis:  type = efa 1 3;
! rotation = varimax;
iterations = 100000;
plot: type = plot2;
EXPLORATORY FACTOR ANALYSIS WITH 3 FACTOR(S):


TESTS OF MODEL FIT

Chi-Square Test of Model Fit

          Value                            184.792*
          Degrees of Freedom                    12
          P-Value                           0.0000
          Scaling Correction Factor          0.424
            for MLR

*   The chi-square value for MLM, MLMV, MLR, ULSMV, WLSM and WLSMV cannot be used
    for chi-square difference tests.  MLM, MLR and WLSM chi-square difference
    testing is described in the Mplus Technical Appendices at www.statmodel.com.
    See chi-square difference testing in the index of the Mplus User's Guide.

Chi-Square Test of Model Fit for the Baseline Model

          Value                           3344.873
          Degrees of Freedom                    36
          P-Value                           0.0000

CFI/TLI

          CFI                                0.948
          TLI                                0.843

Number of Free Parameters                       28

RMSEA (Root Mean Square Error Of Approximation)

          Estimate                           0.117

MINIMUM ROTATION FUNCTION VALUE       0.23719

           GEOMIN ROTATED LOADINGS
                  1             2             3
              ________      ________      ________
 FACSEX         0.002        -0.365         0.379
 FACNAT        -0.002         0.167         0.397
 FACRANK        0.459         0.690         0.001
 STUDRNK1      -0.067         0.165         0.422
 GRADE         -0.055         0.036         0.188
 SALARY         0.358         0.608        -0.003
 YRSTEACH       0.843         0.035        -0.025
 YRSUT          0.984        -0.013         0.026
 NSTUD         -0.299         0.003        -1.078


           GEOMIN FACTOR CORRELATIONS
                  1             2             3
              ________      ________      ________
      1         1.000
      2         0.248         1.000
      3         0.020        -0.257         1.000


           ESTIMATED RESIDUAL VARIANCES
              FACSEX        FACNAT        FACRANK       STUDRNK1      GRADE
              ________      ________      ________      ________      ________
      1         0.652         0.849         0.157         0.833         0.965


           ESTIMATED RESIDUAL VARIANCES
              SALARY        YRSTEACH      YRSUT         NSTUD
              ________      ________      ________      ________
      1         0.393         0.273         0.035        -0.264


           S.E. GEOMIN ROTATED LOADINGS
                  1             2             3
              ________      ________      ________
 FACSEX         0.002         0.051         0.065
 FACNAT         0.013         0.073         0.106
 FACRANK        0.134         0.067         0.015
 STUDRNK1       0.100         0.050         0.046
 GRADE          0.050         0.043         0.039
 SALARY         0.113         0.052         0.022
 YRSTEACH       0.047         0.069         0.031
 YRSUT          0.039         0.013         0.019
 NSTUD          0.178         0.002         0.092


           S.E. GEOMIN FACTOR CORRELATIONS
                  1             2             3
              ________      ________      ________
      1         0.000
      2         0.174         0.000
      3         0.151         0.086         0.000


           S.E. ESTIMATED RESIDUAL VARIANCES
              FACSEX        FACNAT        FACRANK       STUDRNK1      GRADE
              ________      ________      ________      ________      ________
      1         0.062         0.077         0.063         0.035         0.014


           S.E. ESTIMATED RESIDUAL VARIANCES
              SALARY        YRSTEACH      YRSUT         NSTUD
              ________      ________      ________      ________
      1         0.047         0.050         0.076         0.206


           Est./S.E. GEOMIN ROTATED LOADINGS
                  1             2             3
              ________      ________      ________
 FACSEX         0.922        -7.144         5.879
 FACNAT        -0.145         2.268         3.732
 FACRANK        3.425        10.322         0.074
 STUDRNK1      -0.672         3.315         9.170
 GRADE         -1.087         0.831         4.843
 SALARY         3.162        11.765        -0.129
 YRSTEACH      17.764         0.514        -0.818
 YRSUT         25.214        -0.963         1.411
 NSTUD         -1.681         1.184       -11.717


           Est./S.E. GEOMIN FACTOR CORRELATIONS
                  1             2             3
              ________      ________      ________
      1         0.000
      2         1.426         0.000
      3         0.131        -2.999         0.000


           Est./S.E. ESTIMATED RESIDUAL VARIANCES
              FACSEX        FACNAT        FACRANK       STUDRNK1      GRADE
              ________      ________      ________      ________      ________
      1        10.503        11.031         2.476        23.517        71.234


           Est./S.E. ESTIMATED RESIDUAL VARIANCES
              SALARY        YRSTEACH      YRSUT         NSTUD
              ________      ________      ________      ________
      1         8.306         5.512         0.462        -1.283


           FACTOR STRUCTURE
                  1             2             3
              ________      ________      ________
 FACSEX        -0.081        -0.462         0.473
 FACNAT         0.047         0.064         0.354
 FACRANK        0.630         0.803        -0.167
 STUDRNK1      -0.018         0.040         0.378
 GRADE         -0.042        -0.026         0.178
 SALARY         0.509         0.697        -0.152
 YRSTEACH       0.851         0.251        -0.018
 YRSUT          0.982         0.225         0.049
 NSTUD         -0.319         0.205        -1.084


           FACTOR DETERMINACIES
                  1             2             3
              ________      ________      ________
      1         0.984         0.901         1.172


PLOT INFORMATION

The following plots are available:

  Eigenvalues for exploratory factor analysis