Mplus version 8 was used for these examples. All the files for this portion of this seminar can be downloaded here.
1.0 Exploratory factor analysis
Mplus has many nice features to assist researchers conducting exploratory factor analysis. In the example below, we use the m255_mplus_notes_efa data set, which contains continuous, dichotomous and ordered categorical variables. Our data set has missing values on several of the variables that will be used in the analysis. After declaring the data set, we use the listwise statement. Unlike many other statistical packages, Mplus does not use listwise deletion by default. Mplus provides several methods of handling the missing data: listwise deletion, full information maximum likelihood (FIML) and FIML with auxiliary variables. Mplus can use multiply imputed data sets that were created by a different software package. Alternatively, Mplus can create multiply imputed data sets via MCMC simulation. In this example, we will use listwise deletion. If this statement was omitted, Mplus would use FIML to estimate the EFA with all of the information in the data set. The missing statement is included to show how it would be used, but in this example, it is unnecessary. On the categorical statement, we declare all of our dichotomous and ordered categorical variables. On the analysis statement, we indicate that we want to run an EFA. After that specification, two numbers are needed. The first number indicates the minimum number of factors to extract, and the second number indicates the maximum number of factors to extract. Mplus will produce solutions for the number of factors between the minimum and maximum. In our example, we ask for only three factors (so we have 3 for both the first and the second number). In the commented out analysis statement, we ask for a minimum of 1 and a maximum of 3 factors; if this statement was used, Mplus would produce a 1, 2 and 3 factor solution. By default, Mplus provides a geomin rotated solution. (Geomin is an oblique type of rotation, so the correlations between the factors are given in the output.) Mplus offers more than 27 different types of rotations, which are described in the Mplus User’s Guide. Note that most rotations can be specified as either oblique or orthogonal. We have commented out an example of using the rotation statement to request a varimax rotation. Finally, we request a scree plot on the plot statement using type = plot2. To see the plots requested, click on Graphs and then View Graphs.
Besides having several options for handling missing data and handling dichotomous and ordered categorical variables, Mplus can also conduct EFAs with survey data (data that contain sampling weights, clustering and/or stratification). As you can see in the output, standard errors are provided for the factor loadings.
For information on the interpretation of the output, please visit our Annotated Mplus Output: Exploratory Factor Analysis page.
title:  Exploratory factor analysis with categorical and continuous
        variables.

data:  file is m255_mplus_notes_efa.txt;
listwise is on;

variable:  names are facsex facnat facrank studrnk1 grade
                     salary yrsteach yrsut nstud sample;
usevar are facsex facnat facrank studrnk1 grade
            salary yrsteach yrsut nstud;
missing are all (-9);
categorical are facsex facnat facrank studrnk1 grade;

analysis:  type = efa 3 3;
! requests a one factor, two factor and three factor solution;
! analysis:  type = efa 1 3;
! specify varimax (orthogonal) rotation in place of geomin;
! rotation = varimax;

! up the number of iterations if the solution does not converge;
iterations = 100000;

! requests scree plot;
plot: type = plot2;
INPUT READING TERMINATED NORMALLY
Exploratory factor analysis with categorical and continuous
variables.
SUMMARY OF ANALYSIS
Number of groups 1
Number of observations 1057
Number of dependent variables 9
Number of independent variables 0
Number of continuous latent variables 0
Observed dependent variables
Continuous
SALARY YRSTEACH YRSUT NSTUD
Binary and ordered categorical (ordinal)
FACSEX FACNAT FACRANK STUDRNK1 GRADE
Estimator WLSMV
Rotation GEOMIN
Row standardization CORRELATION
Type of rotation OBLIQUE
Epsilon value Varies
Maximum number of iterations 100000
Convergence criterion 0.500D-04
Maximum number of steepest descent iterations 20
Optimization Specifications for the Exploratory Factor Analysis
Rotation Algorithm
Number of random starts 30
Maximum number of iterations 10000
Derivative convergence criterion 0.100D-04
Input data file(s)
m255_mplus_notes_efa.dat
Input data format FREE
UNIVARIATE PROPORTIONS AND COUNTS FOR CATEGORICAL VARIABLES
FACSEX
Category 1 0.633 669.000
Category 2 0.367 388.000
FACNAT
Category 1 0.949 1003.000
Category 2 0.051 54.000
FACRANK
Category 1 0.088 93.000
Category 2 0.265 280.000
Category 3 0.445 470.000
Category 4 0.202 214.000
STUDRNK1
Category 1 0.188 199.000
Category 2 0.197 208.000
Category 3 0.250 264.000
Category 4 0.231 244.000
Category 5 0.134 142.000
GRADE
Category 1 0.006 6.000
Category 2 0.022 23.000
Category 3 0.193 204.000
Category 4 0.470 497.000
Category 5 0.309 327.000
RESULTS FOR EXPLORATORY FACTOR ANALYSIS
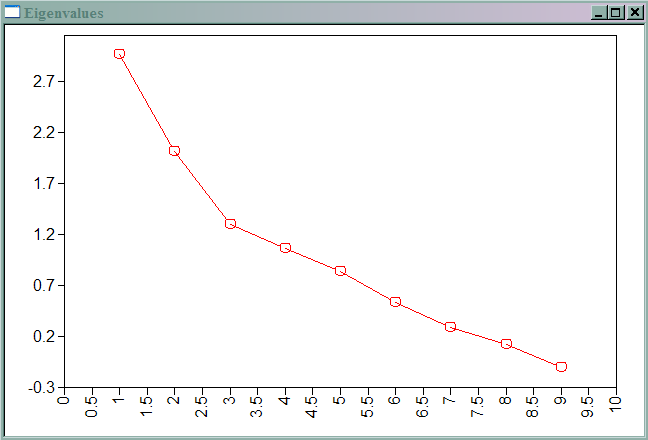
EIGENVALUES FOR SAMPLE CORRELATION MATRIX
1 2 3 4 5
________ ________ ________ ________ ________
1 2.961 2.012 1.293 1.066 0.833
EIGENVALUES FOR SAMPLE CORRELATION MATRIX
6 7 8 9
________ ________ ________ ________
1 0.529 0.286 0.126 -0.107
EXPLORATORY FACTOR ANALYSIS WITH 3 FACTOR(S):
MODEL FIT INFORMATION
Number of Free Parameters 28
Chi-Square Test of Model Fit
Value 148.675*
Degrees of Freedom 12
P-Value 0.0000
* The chi-square value for MLM, MLMV, MLR, ULSMV, WLSM and WLSMV cannot be used
for chi-square difference testing in the regular way. MLM, MLR and WLSM
chi-square difference testing is described on the Mplus website. MLMV, WLSMV,
and ULSMV difference testing is done using the DIFFTEST option.
RMSEA (Root Mean Square Error Of Approximation)
Estimate 0.104
90 Percent C.I. 0.089 0.119
Probability RMSEA <= .05 0.000
CFI/TLI
CFI 0.936
TLI 0.809
Chi-Square Test of Model Fit for the Baseline Model
Value 2180.489
Degrees of Freedom 36
P-Value 0.0000
MINIMUM ROTATION FUNCTION VALUE 0.23720
GEOMIN ROTATED LOADINGS (* significant at 5% level)
1 2 3
________ ________ ________
FACSEX 0.002 -0.365* 0.380*
FACNAT -0.002 0.166* 0.397*
FACRANK 0.459* 0.690* 0.001
STUDRNK1 -0.068 0.165* 0.422*
GRADE -0.055 0.036 0.188*
SALARY 0.358* 0.608* -0.003
YRSTEACH 0.843* 0.035 -0.025
YRSUT 0.985* -0.013 0.026
NSTUD -0.298 0.003 -1.078*
GEOMIN FACTOR CORRELATIONS (* significant at 5% level)
1 2 3
________ ________ ________
1 1.000
2 0.249 1.000
3 0.020 -0.256* 1.000
ESTIMATED RESIDUAL VARIANCES
FACSEX FACNAT FACRANK STUDRNK1 GRADE
________ ________ ________ ________ ________
1 0.652 0.849 0.157 0.833 0.965
ESTIMATED RESIDUAL VARIANCES
SALARY YRSTEACH YRSUT NSTUD
________ ________ ________ ________
1 0.394 0.273 0.035 -0.264
S.E. GEOMIN ROTATED LOADINGS
1 2 3
________ ________ ________
FACSEX 0.002 0.051 0.065
FACNAT 0.013 0.073 0.106
FACRANK 0.134 0.067 0.015
STUDRNK1 0.100 0.050 0.046
GRADE 0.050 0.043 0.039
SALARY 0.114 0.052 0.022
YRSTEACH 0.048 0.069 0.031
YRSUT 0.039 0.013 0.019
NSTUD 0.178 0.002 0.092
S.E. GEOMIN FACTOR CORRELATIONS
1 2 3
________ ________ ________
1 0.000
2 0.174 0.000
3 0.151 0.086 0.000
S.E. ESTIMATED RESIDUAL VARIANCES
FACSEX FACNAT FACRANK STUDRNK1 GRADE
________ ________ ________ ________ ________
1 0.062 0.077 0.063 0.035 0.014
S.E. ESTIMATED RESIDUAL VARIANCES
SALARY YRSTEACH YRSUT NSTUD
________ ________ ________ ________
1 0.047 0.050 0.076 0.206
Est./S.E. GEOMIN ROTATED LOADINGS
1 2 3
________ ________ ________
FACSEX 0.919 -7.139 5.882
FACNAT -0.144 2.265 3.731
FACRANK 3.414 10.310 0.074
STUDRNK1 -0.673 3.317 9.173
GRADE -1.087 0.832 4.843
SALARY 3.152 11.751 -0.129
YRSTEACH 17.745 0.514 -0.818
YRSUT 25.212 -0.959 1.409
NSTUD -1.676 1.183 -11.718
Est./S.E. GEOMIN FACTOR CORRELATIONS
1 2 3
________ ________ ________
1 0.000
2 1.426 0.000
3 0.132 -2.989 0.000
Est./S.E. ESTIMATED RESIDUAL VARIANCES
FACSEX FACNAT FACRANK STUDRNK1 GRADE
________ ________ ________ ________ ________
1 10.501 11.042 2.474 23.514 71.226
Est./S.E. ESTIMATED RESIDUAL VARIANCES
SALARY YRSTEACH YRSUT NSTUD
________ ________ ________ ________
1 8.306 5.511 0.461 -1.283
FACTOR STRUCTURE
1 2 3
________ ________ ________
FACSEX -0.081 -0.462 0.473
FACNAT 0.047 0.064 0.354
FACRANK 0.630 0.804 -0.167
STUDRNK1 -0.018 0.040 0.378
GRADE -0.042 -0.026 0.178
SALARY 0.509 0.697 -0.151
YRSTEACH 0.851 0.251 -0.017
YRSUT 0.982 0.225 0.049
NSTUD -0.319 0.205 -1.084
PLOT INFORMATION
The following plots are available:
Eigenvalues for exploratory factor analysis
DIAGRAM INFORMATION
Mplus diagrams are currently not available for EFA.
No diagram output was produced.