Table 4.2 on page 64.
We will use SPSS file imm23.sav and imm23_lev2.sav for this example. Variable schid is the ID variable that links the level-1 data file with the level-2 data file. We assume that an SSM file has been created based on these two files. The intra-class correlation can be calculated as 26.123/(26.123+81.244) = .243.

Sigma_squared = 81.24393
 Tau
 INTRCPT1,B0     26.12302
Tau (as correlations)
 INTRCPT1,B0  1.000
 ----------------------------------------------------
  Random level-1 coefficient   Reliability estimate
 ----------------------------------------------------
  INTRCPT1, B0                        0.857
 ----------------------------------------------------
The value of the likelihood function at iteration 4 = -1.899339E+003
 Final estimation of fixed effects:
 ----------------------------------------------------------------------------
                                       Standard             Approx.
    Fixed Effect         Coefficient   Error      T-ratio   d.f.     P-value
 ----------------------------------------------------------------------------
 For       INTRCPT1, B0
    INTRCPT2, G00          50.758849   1.151098    44.096        22    0.000
 ----------------------------------------------------------------------------
 Final estimation of fixed effects
 (with robust standard errors)
 ----------------------------------------------------------------------------
                                       Standard             Approx.
    Fixed Effect         Coefficient   Error      T-ratio   d.f.     P-value
 ----------------------------------------------------------------------------
 For       INTRCPT1, B0
    INTRCPT2, G00          50.758849   1.125728    45.090        22    0.000
 ----------------------------------------------------------------------------
 Final estimation of variance components:
 -----------------------------------------------------------------------------
 Random Effect           Standard      Variance     df    Chi-square  P-value
                         Deviation     Component
 -----------------------------------------------------------------------------
 INTRCPT1,       U0        5.11107      26.12302    22     240.76440    0.000
  level-1,       R         9.01354      81.24393
 -----------------------------------------------------------------------------
 Statistics for current covariance components model
 --------------------------------------------------
 Deviance                       = 3798.678611
 Number of estimated parameters = 2
Table 4.3 on page 65.
Variable HOMEWORK is added as a level-1 predictor. The intra-class correlation can be calculated as 21.339/(21.339+71.284) = .23.

 Final estimation of fixed effects:
 ----------------------------------------------------------------------------
                                       Standard             Approx.
    Fixed Effect         Coefficient   Error      T-ratio   d.f.     P-value
 ----------------------------------------------------------------------------
 For       INTRCPT1, B0
    INTRCPT2, G00          46.355709   1.162623    39.872        22    0.000
 For HOMEWORK slope, B1
    INTRCPT2, G10           2.399882   0.277197     8.658       517    0.000
 ----------------------------------------------------------------------------
 Final estimation of fixed effects
 (with robust standard errors)
 ----------------------------------------------------------------------------
                                       Standard             Approx.
    Fixed Effect         Coefficient   Error      T-ratio   d.f.     P-value
 ----------------------------------------------------------------------------
 For       INTRCPT1, B0
    INTRCPT2, G00          46.355709   1.584797    29.250        22    0.000
 For HOMEWORK slope, B1
    INTRCPT2, G10           2.399882   0.601609     3.989       517    0.000
 ----------------------------------------------------------------------------
 Final estimation of variance components:
 -----------------------------------------------------------------------------
 Random Effect           Standard      Variance     df    Chi-square  P-value
                         Deviation     Component
 -----------------------------------------------------------------------------
 INTRCPT1,       U0        4.61942      21.33907    22     193.43666    0.000
  level-1,       R         8.44298      71.28391
 -----------------------------------------------------------------------------
 Statistics for current covariance components model
 --------------------------------------------------
 Deviance                       = 3727.481647
 Number of estimated parameters = 2
Table 4.4 on page 67.
The effect of variable HOMEWORK is modeled as random effect.

Sigma_squared = 53.29476
 Tau
 INTRCPT1,B0     62.42394     -27.59218
 HOMEWORK,B1    -27.59218      17.72475
Tau (as correlations)
 INTRCPT1,B0  1.000 -0.830
 HOMEWORK,B1 -0.830  1.000
 ----------------------------------------------------
  Random level-1 coefficient   Reliability estimate
 ----------------------------------------------------
  INTRCPT1, B0                        0.876
  HOMEWORK, B1                        0.891
 ----------------------------------------------------
The value of the likelihood function at iteration 6 = -1.816862E+003
 Final estimation of fixed effects:
 ----------------------------------------------------------------------------
                                       Standard             Approx.
    Fixed Effect         Coefficient   Error      T-ratio   d.f.     P-value
 ----------------------------------------------------------------------------
 For       INTRCPT1, B0
    INTRCPT2, G00          46.325566   1.758922    26.337        22    0.000
 For HOMEWORK slope, B1
    INTRCPT2, G10           1.980224   0.928325     2.133        22    0.044
 ----------------------------------------------------------------------------
 Final estimation of fixed effects
 (with robust standard errors)
 ----------------------------------------------------------------------------
                                       Standard             Approx.
    Fixed Effect         Coefficient   Error      T-ratio   d.f.     P-value
 ----------------------------------------------------------------------------
 For       INTRCPT1, B0
    INTRCPT2, G00          46.325566   1.720031    26.933        22    0.000
 For HOMEWORK slope, B1
    INTRCPT2, G10           1.980224   0.907872     2.181        22    0.040
 ----------------------------------------------------------------------------
 Final estimation of variance components:
 -----------------------------------------------------------------------------
 Random Effect           Standard      Variance     df    Chi-square  P-value
                         Deviation     Component
 -----------------------------------------------------------------------------
 INTRCPT1,       U0        7.90088      62.42394    22     214.58739    0.000
 HOMEWORK slope, U1        4.21008      17.72475    22     191.51840    0.000
  level-1,       R         7.30033      53.29476
 -----------------------------------------------------------------------------
 Statistics for current covariance components model
 --------------------------------------------------
 Deviance                       = 3633.724203
 Number of estimated parameters = 4
Table 4.5 on page 69.
The effect of variable PARENTED is included as a fixed effect. The output of parameter estimates is shown below.
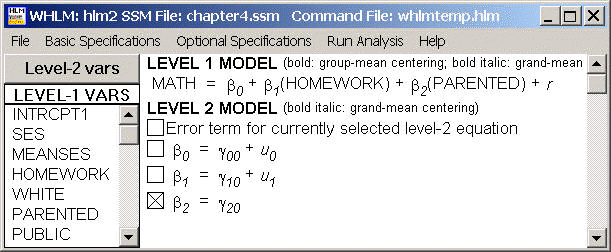
Sigma_squared = 50.77830
 Tau
 INTRCPT1,B0     47.86733     -21.95114
 HOMEWORK,B1    -21.95114      13.87876
Tau (as correlations)
 INTRCPT1,B0  1.000 -0.852
 HOMEWORK,B1 -0.852  1.000
 ----------------------------------------------------
  Random level-1 coefficient   Reliability estimate
 ----------------------------------------------------
  INTRCPT1, B0                        0.851
  HOMEWORK, B1                        0.871
 ----------------------------------------------------
The value of the likelihood function at iteration 6 = -1.800022E+003
 Final estimation of fixed effects:
 ----------------------------------------------------------------------------
                                       Standard             Approx.
    Fixed Effect         Coefficient   Error      T-ratio   d.f.     P-value
 ----------------------------------------------------------------------------
 For       INTRCPT1, B0
    INTRCPT2, G00          40.854605   1.790145    22.822        22    0.000
 For HOMEWORK slope, B1
    INTRCPT2, G10           1.881686   0.830257     2.266        22    0.034
 For PARENTED slope, B2
    INTRCPT2, G20           1.841435   0.295917     6.223       516    0.000
 ----------------------------------------------------------------------------
 Final estimation of fixed effects
 (with robust standard errors)
 ----------------------------------------------------------------------------
                                       Standard             Approx.
    Fixed Effect         Coefficient   Error      T-ratio   d.f.     P-value
 ----------------------------------------------------------------------------
 For       INTRCPT1, B0
    INTRCPT2, G00          40.854605   2.102911    19.428        22    0.000
 For HOMEWORK slope, B1
    INTRCPT2, G10           1.881686   0.812474     2.316        22    0.030
 For PARENTED slope, B2
    INTRCPT2, G20           1.841435   0.368670     4.995       516    0.000
 ----------------------------------------------------------------------------
 Final estimation of variance components:
 -----------------------------------------------------------------------------
 Random Effect           Standard      Variance     df    Chi-square  P-value
                         Deviation     Component
 -----------------------------------------------------------------------------
 INTRCPT1,       U0        6.91862      47.86733    22     168.89325    0.000
 HOMEWORK slope, U1        3.72542      13.87876    22     167.77753    0.000
  level-1,       R         7.12589      50.77830
 -----------------------------------------------------------------------------
 Statistics for current covariance components model
 --------------------------------------------------
 Deviance                       = 3600.043367
 Number of estimated parameters = 4
Table 4.6 on page 71.
A simple traditional regression analysis with HOMEWORK and PARENTED as predictors.
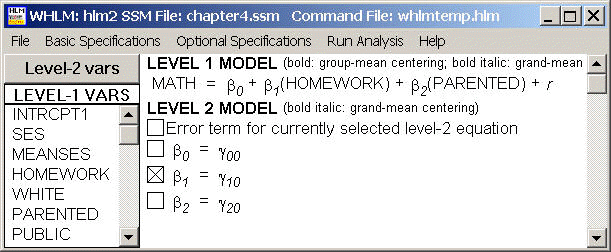
sigma_squared = 76.11628
The outcome variable is MATH
 Least-squares estimates of fixed effects
 ----------------------------------------------------------------------------
                                       Standard
    Fixed Effect         Coefficient   Error      T-ratio   d.f.     P-value
 ----------------------------------------------------------------------------
 For       INTRCPT1, B0
    INTRCPT2, G00          37.239150   0.996279    37.378       516    0.000
 For HOMEWORK slope, B1
    INTRCPT2, G10           2.335361   0.268397     8.701       516    0.000
 For PARENTED slope, B2
    INTRCPT2, G20           3.003987   0.276506    10.864       516    0.000
 ----------------------------------------------------------------------------
 Least-squares estimates of fixed effects
 (with robust standard errors)
 ----------------------------------------------------------------------------
                                       Standard
    Fixed Effect         Coefficient   Error      T-ratio   d.f.     P-value
 ----------------------------------------------------------------------------
 For       INTRCPT1, B0
    INTRCPT2, G00          37.239150   1.322404    28.160       516    0.000
 For HOMEWORK slope, B1
    INTRCPT2, G10           2.335361   0.497836     4.691       516    0.000
 For PARENTED slope, B2
    INTRCPT2, G20           3.003987   0.409981     7.327       516    0.000
 ----------------------------------------------------------------------------
 The least-squares likelihood value = -1859.993177
 Deviance =   3719.98635
 Number of estimated parameters =    1
Table 4.7 on page 74.
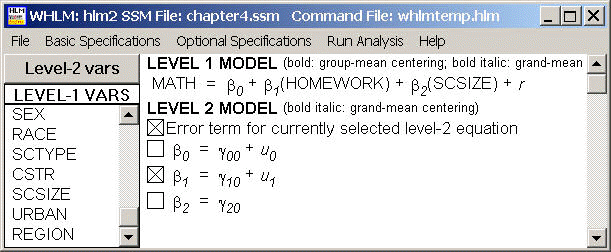
Sigma_squared = 53.30584
 Tau
 INTRCPT1,B0     66.42699     -28.75043
 HOMEWORK,B1    -28.75043      17.78417
Tau (as correlations)
 INTRCPT1,B0  1.000 -0.836
 HOMEWORK,B1 -0.836  1.000
 ----------------------------------------------------
  Random level-1 coefficient   Reliability estimate
 ----------------------------------------------------
  INTRCPT1, B0                        0.882
  HOMEWORK, B1                        0.891
 ----------------------------------------------------
The value of the likelihood function at iteration 6 = -1.817115E+003
 Final estimation of fixed effects:
 ----------------------------------------------------------------------------
                                       Standard             Approx.
    Fixed Effect         Coefficient   Error      T-ratio   d.f.     P-value
 ----------------------------------------------------------------------------
 For       INTRCPT1, B0
    INTRCPT2, G00          44.971968   2.710897    16.589        22    0.000
 For HOMEWORK slope, B1
    INTRCPT2, G10           1.981191   0.929799     2.131        22    0.044
 For   SCSIZE slope, B2
    INTRCPT2, G20           0.425935   0.640978     0.665       516    0.506
 ----------------------------------------------------------------------------
 Final estimation of fixed effects
 (with robust standard errors)
 ----------------------------------------------------------------------------
                                       Standard             Approx.
    Fixed Effect         Coefficient   Error      T-ratio   d.f.     P-value
 ----------------------------------------------------------------------------
 For       INTRCPT1, B0
    INTRCPT2, G00          44.971968   2.509292    17.922        22    0.000
 For HOMEWORK slope, B1
    INTRCPT2, G10           1.981191   0.907564     2.183        22    0.040
 For   SCSIZE slope, B2
    INTRCPT2, G20           0.425935   0.426487     0.999       516    0.318
 ----------------------------------------------------------------------------
 Final estimation of variance components:
 -----------------------------------------------------------------------------
 Random Effect           Standard      Variance     df    Chi-square  P-value
                         Deviation     Component
 -----------------------------------------------------------------------------
 INTRCPT1,       U0        8.15028      66.42699    22     221.65118    0.000
 HOMEWORK slope, U1        4.21713      17.78417    22     191.46611    0.000
  level-1,       R         7.30108      53.30584
 -----------------------------------------------------------------------------
 Statistics for current covariance components model
 --------------------------------------------------
 Deviance                       = 3634.230670
 Number of estimated parameters = 4
Table 4.8 on page 75.
Variable PUBLIC is added as fixed effect and variable SCSIZE is taken out of the model.
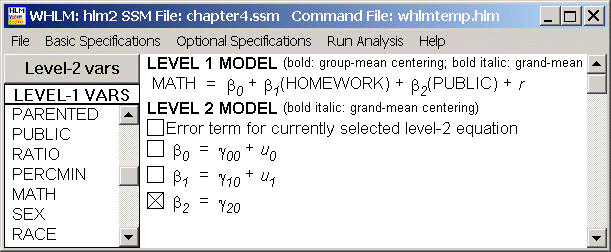
Sigma_squared = 53.34329
 Tau
 INTRCPT1,B0     60.16977     -27.45952
 HOMEWORK,B1    -27.45952      17.31147
Tau (as correlations)
 INTRCPT1,B0  1.000 -0.851
 HOMEWORK,B1 -0.851  1.000
 ----------------------------------------------------
  Random level-1 coefficient   Reliability estimate
 ----------------------------------------------------
  INTRCPT1, B0                        0.871
  HOMEWORK, B1                        0.888
 ----------------------------------------------------
The value of the likelihood function at iteration 6 = -1.814194E+003
 Final estimation of fixed effects:
 ----------------------------------------------------------------------------
                                       Standard             Approx.
    Fixed Effect         Coefficient   Error      T-ratio   d.f.     P-value
 ----------------------------------------------------------------------------
 For       INTRCPT1, B0
    INTRCPT2, G00          49.050339   2.184865    22.450        22    0.000
 For HOMEWORK slope, B1
    INTRCPT2, G10           1.975250   0.918466     2.151        22    0.043
 For   PUBLIC slope, B2
    INTRCPT2, G20          -4.060951   1.977883    -2.053       516    0.040
 ----------------------------------------------------------------------------
 Final estimation of fixed effects
 (with robust standard errors)
 ----------------------------------------------------------------------------
                                       Standard             Approx.
    Fixed Effect         Coefficient   Error      T-ratio   d.f.     P-value
 ----------------------------------------------------------------------------
 For       INTRCPT1, B0
    INTRCPT2, G00          49.050339   2.676867    18.324        22    0.000
 For HOMEWORK slope, B1
    INTRCPT2, G10           1.975250   0.898964     2.197        22    0.039
 For   PUBLIC slope, B2
    INTRCPT2, G20          -4.060951   2.292226    -1.772       516    0.076
 ----------------------------------------------------------------------------
 Final estimation of variance components:
 -----------------------------------------------------------------------------
 Random Effect           Standard      Variance     df    Chi-square  P-value
                         Deviation     Component
 -----------------------------------------------------------------------------
 INTRCPT1,       U0        7.75692      60.16977    22     192.87153    0.000
 HOMEWORK slope, U1        4.16071      17.31147    22     191.40891    0.000
  level-1,       R         7.30365      53.34329
 -----------------------------------------------------------------------------
 Statistics for current covariance components model
 --------------------------------------------------
 Deviance                       = 3628.388074
 Number of estimated parameters = 4
Table 4.10 on page 77.
This model involves an interaction term of variable HOMEWORK and PUBLIC. The interaction term is created by including variable PUBLIC as a level-2 predictor for variable HOMEWORK.

Sigma_squared = 53.33262
 Tau
 INTRCPT1,B0     62.55533     -28.95353
 HOMEWORK,B1    -28.95353      18.25230
Tau (as correlations)
 INTRCPT1,B0  1.000 -0.857
 HOMEWORK,B1 -0.857  1.000
 ----------------------------------------------------
  Random level-1 coefficient   Reliability estimate
 ----------------------------------------------------
  INTRCPT1, B0                        0.876
  HOMEWORK, B1                        0.893
 ----------------------------------------------------
The value of the likelihood function at iteration 6 = -1.811656E+003
 Final estimation of fixed effects:
 ----------------------------------------------------------------------------
                                       Standard             Approx.
    Fixed Effect         Coefficient   Error      T-ratio   d.f.     P-value
 ----------------------------------------------------------------------------
 For       INTRCPT1, B0
    INTRCPT2, G00          48.528899   3.016041    16.090        21    0.000
     MPUBLIC, G01          -3.261963   3.714613    -0.878        21    0.390
 For HOMEWORK slope, B1
    INTRCPT2, G10           2.292764   1.591420     1.441        21    0.164
     MPUBLIC, G11          -0.495648   1.972838    -0.251        21    0.804
 ----------------------------------------------------------------------------
 Final estimation of fixed effects
 (with robust standard errors)
 ----------------------------------------------------------------------------
                                       Standard             Approx.
    Fixed Effect         Coefficient   Error      T-ratio   d.f.     P-value
 ----------------------------------------------------------------------------
 For       INTRCPT1, B0
    INTRCPT2, G00          48.528899   3.202969    15.151        21    0.000
     MPUBLIC, G01          -3.261963   3.761037    -0.867        21    0.396
 For HOMEWORK slope, B1
    INTRCPT2, G10           2.292764   1.286462     1.782        21    0.089
     MPUBLIC, G11          -0.495648   1.757265    -0.282        21    0.781
 ----------------------------------------------------------------------------
 Final estimation of variance components:
 -----------------------------------------------------------------------------
 Random Effect           Standard      Variance     df    Chi-square  P-value
                         Deviation     Component
 -----------------------------------------------------------------------------
 INTRCPT1,       U0        7.90919      62.55533    21     195.23099    0.000
 HOMEWORK slope, U1        4.27227      18.25230    21     193.21281    0.000
  level-1,       R         7.30292      53.33262
 -----------------------------------------------------------------------------
 Statistics for current covariance components model
 --------------------------------------------------
 Deviance                       = 3623.312669
 Number of estimated parameters = 4
Table 4.11 on page 80. This model uses full NELS-88 data (we dont have this data, so this is omitted).
Table 4.12 on page 82.
Variable WHITE is included as level-1 predictor.
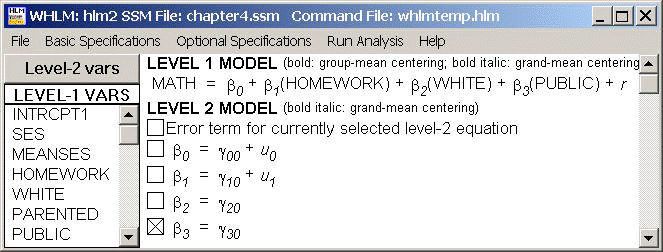
Sigma_squared = 52.72832
 Tau
 INTRCPT1,B0     56.03156     -26.81364
 HOMEWORK,B1    -26.81364      16.77465
Tau (as correlations)
 INTRCPT1,B0  1.000 -0.875
 HOMEWORK,B1 -0.875  1.000
 ----------------------------------------------------
  Random level-1 coefficient   Reliability estimate
 ----------------------------------------------------
  INTRCPT1, B0                        0.865
  HOMEWORK, B1                        0.886
 ----------------------------------------------------
The value of the likelihood function at iteration 6 = -1.806808E+003
 Final estimation of fixed effects:
 ----------------------------------------------------------------------------
                                       Standard             Approx.
    Fixed Effect         Coefficient   Error      T-ratio   d.f.     P-value
 ----------------------------------------------------------------------------
 For       INTRCPT1, B0
    INTRCPT2, G00          46.628341   2.192272    21.269        22    0.000
 For HOMEWORK slope, B1
    INTRCPT2, G10           1.899256   0.904929     2.099        22    0.047
 For    WHITE slope, B2
    INTRCPT2, G20           3.309399   0.969861     3.412       515    0.001
 For   PUBLIC slope, B3
    INTRCPT2, G30          -3.882560   1.798787    -2.158       515    0.031
 ----------------------------------------------------------------------------
 Final estimation of fixed effects
 (with robust standard errors)
 ----------------------------------------------------------------------------
                                       Standard             Approx.
    Fixed Effect         Coefficient   Error      T-ratio   d.f.     P-value
 ----------------------------------------------------------------------------
 For       INTRCPT1, B0
    INTRCPT2, G00          46.628341   2.754269    16.929        22    0.000
 For HOMEWORK slope, B1
    INTRCPT2, G10           1.899256   0.882304     2.153        22    0.042
 For    WHITE slope, B2
    INTRCPT2, G20           3.309399   1.274330     2.597       515    0.010
 For   PUBLIC slope, B3
    INTRCPT2, G30          -3.882560   2.065162    -1.880       515    0.060
 ----------------------------------------------------------------------------
 Final estimation of variance components:
 -----------------------------------------------------------------------------
 Random Effect           Standard      Variance     df    Chi-square  P-value
                         Deviation     Component
 -----------------------------------------------------------------------------
 INTRCPT1,       U0        7.48542      56.03156    22     184.16851    0.000
 HOMEWORK slope, U1        4.09569      16.77465    22     190.78991    0.000
  level-1,       R         7.26143      52.72832
 -----------------------------------------------------------------------------
 Statistics for current covariance components model
 --------------------------------------------------
 Deviance                       = 3613.615347
 Number of estimated parameters = 4
Table 4.13 on page 83.
Variable WHITE is included as a random effect.
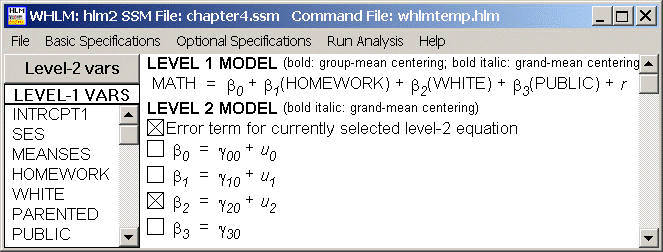
Sigma_squared = 51.15595
 Tau
 INTRCPT1,B0     69.14492     -28.52701     -22.09856
 HOMEWORK,B1    -28.52701      16.63111       2.90674
    WHITE,B2    -22.09856       2.90674      26.55034
Tau (as correlations)
 INTRCPT1,B0  1.000 -0.841 -0.516
 HOMEWORK,B1 -0.841  1.000  0.138
    WHITE,B2 -0.516  0.138  1.000
 ----------------------------------------------------
  Random level-1 coefficient   Reliability estimate
 ----------------------------------------------------
  INTRCPT1, B0                        0.749
  HOMEWORK, B1                        0.904
     WHITE, B2                        0.540
 ----------------------------------------------------
Note: The reliability estimates reported above are based on only 16 of 23
units that had sufficient data for computation.  Fixed effects and variance
components are based on all the data.
The value of the likelihood function at iteration 17 = -1.804332E+003
 Final estimation of fixed effects:
 ----------------------------------------------------------------------------
                                       Standard             Approx.
    Fixed Effect         Coefficient   Error      T-ratio   d.f.     P-value
 ----------------------------------------------------------------------------
 For       INTRCPT1, B0
    INTRCPT2, G00          48.229687   2.340050    20.611        22    0.000
 For HOMEWORK slope, B1
    INTRCPT2, G10           1.940057   0.900454     2.155        22    0.042
 For    WHITE slope, B2
    INTRCPT2, G20           2.597336   1.554904     1.670        22    0.109
 For   PUBLIC slope, B3
    INTRCPT2, G30          -4.930506   1.650828    -2.987       515    0.003
 ----------------------------------------------------------------------------
 Final estimation of fixed effects
 (with robust standard errors)
 ----------------------------------------------------------------------------
                                       Standard             Approx.
    Fixed Effect         Coefficient   Error      T-ratio   d.f.     P-value
 ----------------------------------------------------------------------------
 For       INTRCPT1, B0
    INTRCPT2, G00          48.229687   2.716287    17.756        22    0.000
 For HOMEWORK slope, B1
    INTRCPT2, G10           1.940057   0.881182     2.202        22    0.038
 For    WHITE slope, B2
    INTRCPT2, G20           2.597336   1.503784     1.727        22    0.098
 For   PUBLIC slope, B3
    INTRCPT2, G30          -4.930506   1.833957    -2.688       515    0.008
 ----------------------------------------------------------------------------
 Final estimation of variance components:
 -----------------------------------------------------------------------------
 Random Effect           Standard      Variance     df    Chi-square  P-value
                         Deviation     Component
 -----------------------------------------------------------------------------
 INTRCPT1,       U0        8.31534      69.14492    15      60.56538    0.000
 HOMEWORK slope, U1        4.07813      16.63111    15     115.22516    0.000
    WHITE slope, U2        5.15270      26.55034    15      29.68260    0.013
  level-1,       R         7.15234      51.15595
 -----------------------------------------------------------------------------
Note: The chi-square statistics reported above are based on only 16 of 23
units that had sufficient data for computation.  Fixed effects and variance
components are based on all the data.
 Statistics for current covariance components model
 --------------------------------------------------
 Deviance                       = 3608.663161
 Number of estimated parameters = 7
Table 4.14 on page 85.
Variable WHITE is included as fixed and variable MEANSES is included as fixed.
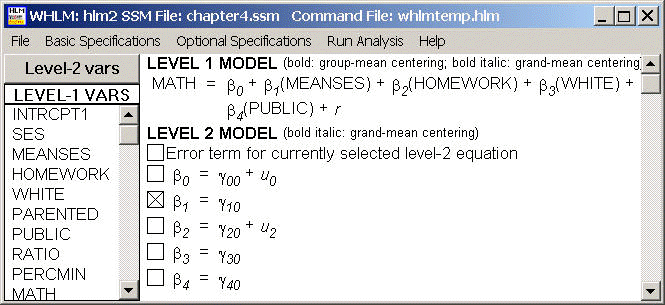
Sigma_squared = 52.79408
 Tau
 INTRCPT1,B0     54.13863     -27.03574
 HOMEWORK,B2    -27.03574      16.44395
Tau (as correlations)
 INTRCPT1,B0  1.000 -0.906
 HOMEWORK,B2 -0.906  1.000
 ----------------------------------------------------
  Random level-1 coefficient   Reliability estimate
 ----------------------------------------------------
  INTRCPT1, B0                        0.861
  HOMEWORK, B2                        0.884
 ----------------------------------------------------
The value of the likelihood function at iteration 6 = -1.803260E+003
 Final estimation of fixed effects:
 ----------------------------------------------------------------------------
                                       Standard             Approx.
    Fixed Effect         Coefficient   Error      T-ratio   d.f.     P-value
 ----------------------------------------------------------------------------
 For       INTRCPT1, B0
    INTRCPT2, G00          44.615943   2.235300    19.960        22    0.000
 For  MEANSES slope, B1
    INTRCPT2, G10           4.977089   1.951297     2.551       514    0.011
 For HOMEWORK slope, B2
    INTRCPT2, G20           1.924156   0.896425     2.146        22    0.043
 For    WHITE slope, B3
    INTRCPT2, G30           3.096787   0.963117     3.215       514    0.002
 For   PUBLIC slope, B4
    INTRCPT2, G40           0.160388   2.271429     0.071       514    0.944
 ----------------------------------------------------------------------------
 Final estimation of fixed effects
 (with robust standard errors)
 ----------------------------------------------------------------------------
                                       Standard             Approx.
    Fixed Effect         Coefficient   Error      T-ratio   d.f.     P-value
 ----------------------------------------------------------------------------
 For       INTRCPT1, B0
    INTRCPT2, G00          44.615943   2.852724    15.640        22    0.000
 For  MEANSES slope, B1
    INTRCPT2, G10           4.977089   2.140173     2.326       514    0.020
 For HOMEWORK slope, B2
    INTRCPT2, G20           1.924156   0.870047     2.212        22    0.038
 For    WHITE slope, B3
    INTRCPT2, G30           3.096787   1.275468     2.428       514    0.015
 For   PUBLIC slope, B4
    INTRCPT2, G40           0.160388   2.738577     0.059       514    0.954
 ----------------------------------------------------------------------------
 Final estimation of variance components:
 -----------------------------------------------------------------------------
 Random Effect           Standard      Variance     df    Chi-square  P-value
                         Deviation     Component
 -----------------------------------------------------------------------------
 INTRCPT1,       U0        7.35790      54.13863    22     168.77148    0.000
 HOMEWORK slope, U2        4.05511      16.44395    22     190.44614    0.000
  level-1,       R         7.26595      52.79408
 -----------------------------------------------------------------------------
 Statistics for current covariance components model
 --------------------------------------------------
 Deviance                       = 3606.519823
 Number of estimated parameters = 4
Table 4.15 on page 86.
Variable PUBLIC is deleted from the model.
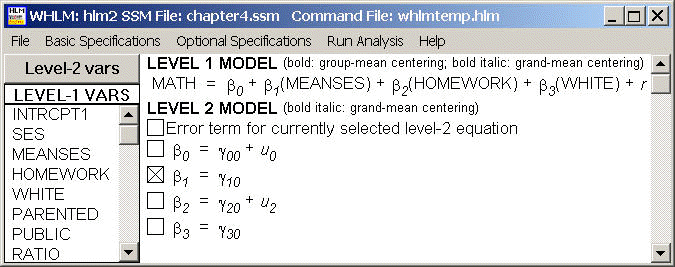
Sigma_squared = 52.79022
 Tau
 INTRCPT1,B0     53.57697     -26.99882
 HOMEWORK,B2    -26.99882      16.39853
Tau (as correlations)
 INTRCPT1,B0  1.000 -0.911
 HOMEWORK,B2 -0.911  1.000
 ----------------------------------------------------
  Random level-1 coefficient   Reliability estimate
 ----------------------------------------------------
  INTRCPT1, B0                        0.860
  HOMEWORK, B2                        0.884
 ----------------------------------------------------
The value of the likelihood function at iteration 6 = -1.804072E+003
 Final estimation of fixed effects:
 ----------------------------------------------------------------------------
                                       Standard             Approx.
    Fixed Effect         Coefficient   Error      T-ratio   d.f.     P-value
 ----------------------------------------------------------------------------
 For       INTRCPT1, B0
    INTRCPT2, G00          44.702254   1.787302    25.011        22    0.000
 For  MEANSES slope, B1
    INTRCPT2, G10           4.892436   1.340903     3.649       515    0.000
 For HOMEWORK slope, B2
    INTRCPT2, G20           1.925101   0.895116     2.151        22    0.043
 For    WHITE slope, B3
    INTRCPT2, G30           3.114806   0.957043     3.255       515    0.002
 ----------------------------------------------------------------------------
 Final estimation of fixed effects
 (with robust standard errors)
 ----------------------------------------------------------------------------
                                       Standard             Approx.
    Fixed Effect         Coefficient   Error      T-ratio   d.f.     P-value
 ----------------------------------------------------------------------------
 For       INTRCPT1, B0
    INTRCPT2, G00          44.702254   2.050411    21.802        22    0.000
 For  MEANSES slope, B1
    INTRCPT2, G10           4.892436   1.424591     3.434       515    0.001
 For HOMEWORK slope, B2
    INTRCPT2, G20           1.925101   0.869461     2.214        22    0.037
 For    WHITE slope, B3
    INTRCPT2, G30           3.114806   1.287769     2.419       515    0.016
 ----------------------------------------------------------------------------
 Final estimation of variance components:
 -----------------------------------------------------------------------------
 Random Effect           Standard      Variance     df    Chi-square  P-value
                         Deviation     Component
 -----------------------------------------------------------------------------
 INTRCPT1,       U0        7.31963      53.57697    22     168.73655    0.000
 HOMEWORK slope, U2        4.04951      16.39853    22     190.42898    0.000
  level-1,       R         7.26569      52.79022
 -----------------------------------------------------------------------------
 Statistics for current covariance components model
 --------------------------------------------------
 Deviance                       = 3608.143584
 Number of estimated parameters = 4
Table 4.16 on page 88.
Interaction between HOMEWORK and MEANSES is included.
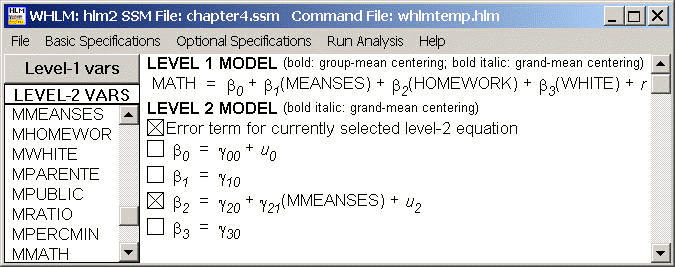
Sigma_squared = 52.78077
 Tau
 INTRCPT1,B0     55.89070     -28.39071
 HOMEWORK,B2    -28.39071      17.23834
Tau (as correlations)
 INTRCPT1,B0  1.000 -0.915
 HOMEWORK,B2 -0.915  1.000
 ----------------------------------------------------
  Random level-1 coefficient   Reliability estimate
 ----------------------------------------------------
  INTRCPT1, B0                        0.864
  HOMEWORK, B2                        0.889
 ----------------------------------------------------
The value of the likelihood function at iteration 6 = -1.803527E+003
 Final estimation of fixed effects:
 ----------------------------------------------------------------------------
                                       Standard             Approx.
    Fixed Effect         Coefficient   Error      T-ratio   d.f.     P-value
 ----------------------------------------------------------------------------
 For       INTRCPT1, B0
    INTRCPT2, G00          44.611344   1.836270    24.295        22    0.000
 For  MEANSES slope, B1
    INTRCPT2, G10           3.977516   3.023012     1.316       514    0.188
 For HOMEWORK slope, B2
    INTRCPT2, G20           1.974713   0.929138     2.125        21    0.045
    MMEANSES, G21           0.553145   1.645743     0.336        21    0.740
 For    WHITE slope, B3
    INTRCPT2, G30           3.114979   0.957136     3.254       514    0.002
 ----------------------------------------------------------------------------
 Final estimation of fixed effects
 (with robust standard errors)
 ----------------------------------------------------------------------------
                                       Standard             Approx.
    Fixed Effect         Coefficient   Error      T-ratio   d.f.     P-value
 ----------------------------------------------------------------------------
 For       INTRCPT1, B0
    INTRCPT2, G00          44.611344   2.029445    21.982        22    0.000
 For  MEANSES slope, B1
    INTRCPT2, G10           3.977516   2.914961     1.365       514    0.173
 For HOMEWORK slope, B2
    INTRCPT2, G20           1.974713   0.862444     2.290        21    0.032
    MMEANSES, G21           0.553145   1.340866     0.413        21    0.684
 For    WHITE slope, B3
    INTRCPT2, G30           3.114979   1.286842     2.421       514    0.016
 ----------------------------------------------------------------------------
 Final estimation of variance components:
 -----------------------------------------------------------------------------
 Random Effect           Standard      Variance     df    Chi-square  P-value
                         Deviation     Component
 -----------------------------------------------------------------------------
 INTRCPT1,       U0        7.47601      55.89070    22     171.36655    0.000
 HOMEWORK slope, U2        4.15191      17.23834    21     193.10306    0.000
  level-1,       R         7.26504      52.78077
 -----------------------------------------------------------------------------
 Statistics for current covariance components model
 --------------------------------------------------
 Deviance                       = 3607.054239
 Number of estimated parameters = 4
Table 4.17 on page 89.
Variable SES is included as level-1 predictor.
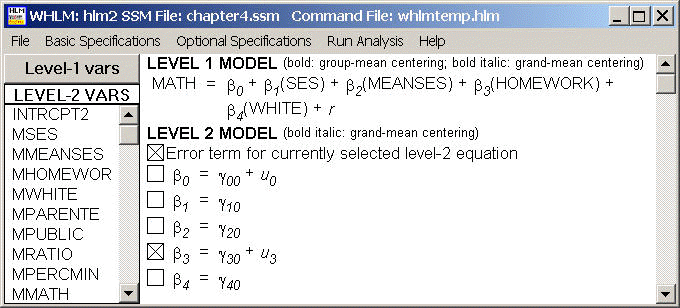
Sigma_squared = 51.29601
 Tau
 INTRCPT1,B0     49.90014     -24.37911
 HOMEWORK,B3    -24.37911      14.64878
Tau (as correlations)
 INTRCPT1,B0  1.000 -0.902
 HOMEWORK,B3 -0.902  1.000
 ----------------------------------------------------
  Random level-1 coefficient   Reliability estimate
 ----------------------------------------------------
  INTRCPT1, B0                        0.855
  HOMEWORK, B3                        0.876
 ----------------------------------------------------
The value of the likelihood function at iteration 6 = -1.796378E+003
 Final estimation of fixed effects:
 ----------------------------------------------------------------------------
                                       Standard             Approx.
    Fixed Effect         Coefficient   Error      T-ratio   d.f.     P-value
 ----------------------------------------------------------------------------
 For       INTRCPT1, B0
    INTRCPT2, G00          45.674852   1.752109    26.068        22    0.000
 For      SES slope, B1
    INTRCPT2, G10           2.205769   0.535632     4.118       514    0.000
 For  MEANSES slope, B2
    INTRCPT2, G20           2.945244   1.428222     2.062       514    0.039
 For HOMEWORK slope, B3
    INTRCPT2, G30           1.825656   0.850414     2.147        22    0.043
 For    WHITE slope, B4
    INTRCPT2, G40           2.170702   0.973294     2.230       514    0.026
 ----------------------------------------------------------------------------
 Final estimation of fixed effects
 (with robust standard errors)
 ----------------------------------------------------------------------------
                                       Standard             Approx.
    Fixed Effect         Coefficient   Error      T-ratio   d.f.     P-value
 ----------------------------------------------------------------------------
 For       INTRCPT1, B0
    INTRCPT2, G00          45.674852   1.993801    22.908        22    0.000
 For      SES slope, B1
    INTRCPT2, G10           2.205769   0.642834     3.431       514    0.001
 For  MEANSES slope, B2
    INTRCPT2, G20           2.945244   1.591438     1.851       514    0.064
 For HOMEWORK slope, B3
    INTRCPT2, G30           1.825656   0.824166     2.215        22    0.037
 For    WHITE slope, B4
    INTRCPT2, G40           2.170702   1.377362     1.576       514    0.115
 ----------------------------------------------------------------------------
 Final estimation of variance components:
 -----------------------------------------------------------------------------
 Random Effect           Standard      Variance     df    Chi-square  P-value
                         Deviation     Component
 -----------------------------------------------------------------------------
 INTRCPT1,       U0        7.06400      49.90014    22     162.57774    0.000
 HOMEWORK slope, U3        3.82737      14.64878    22     177.92008    0.000
  level-1,       R         7.16212      51.29601
 -----------------------------------------------------------------------------
 Statistics for current covariance components model
 --------------------------------------------------
 Deviance                       = 3592.755431
 Number of estimated parameters = 4
Table 4.19 on page 91.
Variable SES is the only predictor.

Sigma_squared = 75.32795
 Tau
 INTRCPT1,B0     12.63048
Tau (as correlations)
 INTRCPT1,B0  1.000
 ----------------------------------------------------
  Random level-1 coefficient   Reliability estimate
 ----------------------------------------------------
  INTRCPT1, B0                        0.762
 ----------------------------------------------------
The value of the likelihood function at iteration 6 = -1.872170E+003
 Final estimation of fixed effects:
 ----------------------------------------------------------------------------
                                       Standard             Approx.
    Fixed Effect         Coefficient   Error      T-ratio   d.f.     P-value
 ----------------------------------------------------------------------------
 For       INTRCPT1, B0
    INTRCPT2, G00          51.200859   0.850662    60.189        22    0.000
 For      SES slope, B1
    INTRCPT2, G10           4.332382   0.566265     7.651       517    0.000
 ----------------------------------------------------------------------------
 Final estimation of fixed effects
 (with robust standard errors)
 ----------------------------------------------------------------------------
                                       Standard             Approx.
    Fixed Effect         Coefficient   Error      T-ratio   d.f.     P-value
 ----------------------------------------------------------------------------
 For       INTRCPT1, B0
    INTRCPT2, G00          51.200859   0.823988    62.138        22    0.000
 For      SES slope, B1
    INTRCPT2, G10           4.332382   0.529547     8.181       517    0.000
 ----------------------------------------------------------------------------
 Final estimation of variance components:
 -----------------------------------------------------------------------------
 Random Effect           Standard      Variance     df    Chi-square  P-value
                         Deviation     Component
 -----------------------------------------------------------------------------
 INTRCPT1,       U0        3.55394      12.63048    22     119.55639    0.000
  level-1,       R         8.67917      75.32795
 -----------------------------------------------------------------------------
 Statistics for current covariance components model
 --------------------------------------------------
 Deviance                       = 3744.339553
 Number of estimated parameters = 2
Table 4.20 on page 92.
Variable SES is included as a random effect. Notice this model takes quite a few iterations to converge.

******* ITERATION 581 *******
Sigma_squared = 75.16657
 Tau
 INTRCPT1,B0     12.93101      -1.06844
      SES,B1     -1.06844       0.16763
Tau (as correlations)
 INTRCPT1,B0  1.000 -0.726
      SES,B1 -0.726  1.000
 ----------------------------------------------------
  Random level-1 coefficient   Reliability estimate
 ----------------------------------------------------
  INTRCPT1, B0                        0.659
       SES, B1                        0.019
 ----------------------------------------------------
The value of the likelihood function at iteration 581 = -1.872093E+003
 Final estimation of fixed effects:
 ----------------------------------------------------------------------------
                                       Standard             Approx.
    Fixed Effect         Coefficient   Error      T-ratio   d.f.     P-value
 ----------------------------------------------------------------------------
 For       INTRCPT1, B0
    INTRCPT2, G00          51.249011   0.857867    59.740        22    0.000
 For      SES slope, B1
    INTRCPT2, G10           4.326502   0.571343     7.573        22    0.000
 ----------------------------------------------------------------------------
 Final estimation of fixed effects
 (with robust standard errors)
 ----------------------------------------------------------------------------
                                       Standard             Approx.
    Fixed Effect         Coefficient   Error      T-ratio   d.f.     P-value
 ----------------------------------------------------------------------------
 For       INTRCPT1, B0
    INTRCPT2, G00          51.249011   0.835284    61.355        22    0.000
 For      SES slope, B1
    INTRCPT2, G10           4.326502   0.517031     8.368        22    0.000
 ----------------------------------------------------------------------------
 Final estimation of variance components:
 -----------------------------------------------------------------------------
 Random Effect           Standard      Variance     df    Chi-square  P-value
                         Deviation     Component
 -----------------------------------------------------------------------------
 INTRCPT1,       U0        3.59597      12.93101    22      93.95627    0.000
      SES slope, U1        0.40943       0.16763    22      29.95493    0.119
  level-1,       R         8.66987      75.16657
 -----------------------------------------------------------------------------
 Statistics for current covariance components model
 --------------------------------------------------
 Deviance                       = 3744.185216
 Number of estimated parameters = 4
Table 4.21 on page 93.

Sigma_squared = 75.17279
 Tau
 INTRCPT1,B0     10.69521
Tau (as correlations)
 INTRCPT1,B0  1.000
 ----------------------------------------------------
  Random level-1 coefficient   Reliability estimate
 ----------------------------------------------------
  INTRCPT1, B0                        0.733
 ----------------------------------------------------
The value of the likelihood function at iteration 6 = -1.870805E+003
 Final estimation of fixed effects:
 ----------------------------------------------------------------------------
                                       Standard             Approx.
    Fixed Effect         Coefficient   Error      T-ratio   d.f.     P-value
 ----------------------------------------------------------------------------
 For       INTRCPT1, B0
    INTRCPT2, G00          53.126608   1.177803    45.107        22    0.000
 For      SES slope, B1
    INTRCPT2, G10           4.299001   0.561803     7.652       516    0.000
 For  PERCMIN slope, B2
    INTRCPT2, G20          -0.809360   0.364643    -2.220       516    0.026
 ----------------------------------------------------------------------------
 Final estimation of fixed effects
 (with robust standard errors)
 ----------------------------------------------------------------------------
                                       Standard             Approx.
    Fixed Effect         Coefficient   Error      T-ratio   d.f.     P-value
 ----------------------------------------------------------------------------
 For       INTRCPT1, B0
    INTRCPT2, G00          53.126608   1.146173    46.351        22    0.000
 For      SES slope, B1
    INTRCPT2, G10           4.299001   0.555372     7.741       516    0.000
 For  PERCMIN slope, B2
    INTRCPT2, G20          -0.809360   0.402989    -2.008       516    0.044
 ----------------------------------------------------------------------------
 Final estimation of variance components:
 -----------------------------------------------------------------------------
 Random Effect           Standard      Variance     df    Chi-square  P-value
                         Deviation     Component
 -----------------------------------------------------------------------------
 INTRCPT1,       U0        3.27035      10.69521    22     110.56857    0.000
  level-1,       R         8.67022      75.17279
 -----------------------------------------------------------------------------
 Statistics for current covariance components model
 --------------------------------------------------
 Deviance                       = 3741.610871
 Number of estimated parameters = 2
Table 4.22 on page 95.
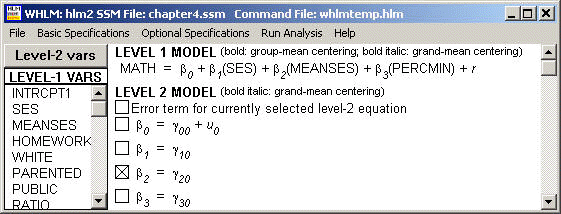
Sigma_squared = 75.24047
 Tau
 INTRCPT1,B0      8.84704
Tau (as correlations)
 INTRCPT1,B0  1.000
 ----------------------------------------------------
  Random level-1 coefficient   Reliability estimate
 ----------------------------------------------------
  INTRCPT1, B0                        0.696
 ----------------------------------------------------
The value of the likelihood function at iteration 6 = -1.866889E+003
 Final estimation of fixed effects:
 ----------------------------------------------------------------------------
                                       Standard             Approx.
    Fixed Effect         Coefficient   Error      T-ratio   d.f.     P-value
 ----------------------------------------------------------------------------
 For       INTRCPT1, B0
    INTRCPT2, G00          53.096907   1.102689    48.152        22    0.000
 For      SES slope, B1
    INTRCPT2, G10           3.884760   0.609773     6.371       515    0.000
 For  MEANSES slope, B2
    INTRCPT2, G20           2.805058   1.479396     1.896       515    0.058
 For  PERCMIN slope, B3
    INTRCPT2, G30          -0.692191   0.345699    -2.002       515    0.045
 ----------------------------------------------------------------------------
 Final estimation of fixed effects
 (with robust standard errors)
 ----------------------------------------------------------------------------
                                       Standard             Approx.
    Fixed Effect         Coefficient   Error      T-ratio   d.f.     P-value
 ----------------------------------------------------------------------------
 For       INTRCPT1, B0
    INTRCPT2, G00          53.096907   1.058582    50.159        22    0.000
 For      SES slope, B1
    INTRCPT2, G10           3.884760   0.693364     5.603       515    0.000
 For  MEANSES slope, B2
    INTRCPT2, G20           2.805058   1.837170     1.527       515    0.127
 For  PERCMIN slope, B3
    INTRCPT2, G30          -0.692191   0.461854    -1.499       515    0.134
 ----------------------------------------------------------------------------
 Final estimation of variance components:
 -----------------------------------------------------------------------------
 Random Effect           Standard      Variance     df    Chi-square  P-value
                         Deviation     Component
 -----------------------------------------------------------------------------
 INTRCPT1,       U0        2.97440       8.84704    22      77.37302    0.000
  level-1,       R         8.67413      75.24047
 -----------------------------------------------------------------------------
 Statistics for current covariance components model
 --------------------------------------------------
 Deviance                       = 3733.777145
 Number of estimated parameters = 2
Table 4.23 and Table 4.24 on page 97. Analyses with NELS-88, models 2 and 3 (we do not have this data, so these analyses are omitted).
Table 4.25 on page 99.
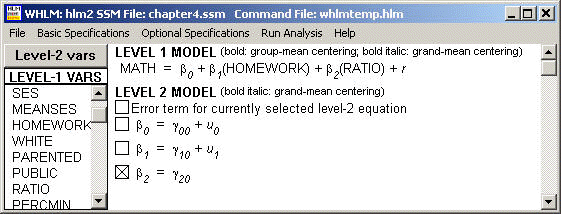
Sigma_squared = 53.30420
 Tau
 INTRCPT1,B0     63.48035     -27.70473
 HOMEWORK,B1    -27.70473      17.74312
Tau (as correlations)
 INTRCPT1,B0  1.000 -0.826
 HOMEWORK,B1 -0.826  1.000
 ----------------------------------------------------
  Random level-1 coefficient   Reliability estimate
 ----------------------------------------------------
  INTRCPT1, B0                        0.877
  HOMEWORK, B1                        0.891
 ----------------------------------------------------
The value of the likelihood function at iteration 7 = -1.818319E+003
 Final estimation of fixed effects:
 ----------------------------------------------------------------------------
                                       Standard             Approx.
    Fixed Effect         Coefficient   Error      T-ratio   d.f.     P-value
 ----------------------------------------------------------------------------
 For       INTRCPT1, B0
    INTRCPT2, G00          47.961602   4.083183    11.746        22    0.000
 For HOMEWORK slope, B1
    INTRCPT2, G10           1.979239   0.928948     2.131        22    0.044
 For    RATIO slope, B2
    INTRCPT2, G20          -0.094420   0.212382    -0.445       516    0.656
 ----------------------------------------------------------------------------
 Final estimation of fixed effects
 (with robust standard errors)
 ----------------------------------------------------------------------------
                                       Standard             Approx.
    Fixed Effect         Coefficient   Error      T-ratio   d.f.     P-value
 ----------------------------------------------------------------------------
 For       INTRCPT1, B0
    INTRCPT2, G00          47.961602   4.759461    10.077        22    0.000
 For HOMEWORK slope, B1
    INTRCPT2, G10           1.979239   0.908219     2.179        22    0.040
 For    RATIO slope, B2
    INTRCPT2, G20          -0.094420   0.237873    -0.397       516    0.691
 ----------------------------------------------------------------------------
 Final estimation of variance components:
 -----------------------------------------------------------------------------
 Random Effect           Standard      Variance     df    Chi-square  P-value
                         Deviation     Component
 -----------------------------------------------------------------------------
 INTRCPT1,       U0        7.96746      63.48035    22     211.41465    0.000
 HOMEWORK slope, U1        4.21226      17.74312    22     191.49725    0.000
  level-1,       R         7.30097      53.30420
 -----------------------------------------------------------------------------
 Statistics for current covariance components model
 --------------------------------------------------
 Deviance                       = 3636.637671
 Number of estimated parameters = 4
Table 4.26 on page 100.
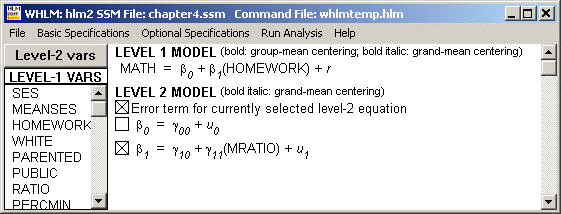
Sigma_squared = 53.29782
 Tau
 INTRCPT1,B0     62.55451     -27.79939
 HOMEWORK,B1    -27.79939      18.09403
Tau (as correlations)
 INTRCPT1,B0  1.000 -0.826
 HOMEWORK,B1 -0.826  1.000
 ----------------------------------------------------
  Random level-1 coefficient   Reliability estimate
 ----------------------------------------------------
  INTRCPT1, B0                        0.876
  HOMEWORK, B1                        0.893
 ----------------------------------------------------
The value of the likelihood function at iteration 7 = -1.818945E+003
 Final estimation of fixed effects:
 ----------------------------------------------------------------------------
                                       Standard             Approx.
    Fixed Effect         Coefficient   Error      T-ratio   d.f.     P-value
 ----------------------------------------------------------------------------
 For       INTRCPT1, B0
    INTRCPT2, G00          46.330611   1.760574    26.316        22    0.000
 For HOMEWORK slope, B1
    INTRCPT2, G10           2.884107   2.156618     1.337        21    0.196
      MRATIO, G11          -0.052584   0.112271    -0.468        21    0.644
 ----------------------------------------------------------------------------
 Final estimation of fixed effects
 (with robust standard errors)
 ----------------------------------------------------------------------------
                                       Standard             Approx.
    Fixed Effect         Coefficient   Error      T-ratio   d.f.     P-value
 ----------------------------------------------------------------------------
 For       INTRCPT1, B0
    INTRCPT2, G00          46.330611   1.721460    26.914        22    0.000
 For HOMEWORK slope, B1
    INTRCPT2, G10           2.884107   2.236130     1.290        21    0.211
      MRATIO, G11          -0.052584   0.122894    -0.428        21    0.673
 ----------------------------------------------------------------------------
 Final estimation of variance components:
 -----------------------------------------------------------------------------
 Random Effect           Standard      Variance     df    Chi-square  P-value
                         Deviation     Component
 -----------------------------------------------------------------------------
 INTRCPT1,       U0        7.90914      62.55451    22     214.54663    0.000
 HOMEWORK slope, U1        4.25371      18.09403    21     194.54422    0.000
  level-1,       R         7.30054      53.29782
 -----------------------------------------------------------------------------
 Statistics for current covariance components model
 --------------------------------------------------
 Deviance                       = 3637.890963
 Number of estimated parameters = 4
Table 4.27 on page 101. Analyses with NELS-88, (we do not have this data, so these analyses are omitted).
