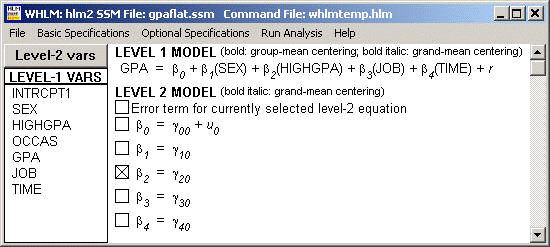
Table 5.1 on page 78, Table 5.2 on page 79 and Figure 5.3 using data file gpa.sav. These tables are produced using SPSS.
GLM
  gpa1 gpa2 gpa3 gpa4 gpa5 gpa6 BY sex  WITH highgpa
  /WSFACTOR = gpa 6 Polynomial
  /METHOD = SSTYPE(3)
  /PLOT = PROFILE( gpa*sex )
  /PRINT = DESCRIPTIVE
  /CRITERIA = ALPHA(.05)
  /WSDESIGN = gpa
  /DESIGN = highgpa sex .
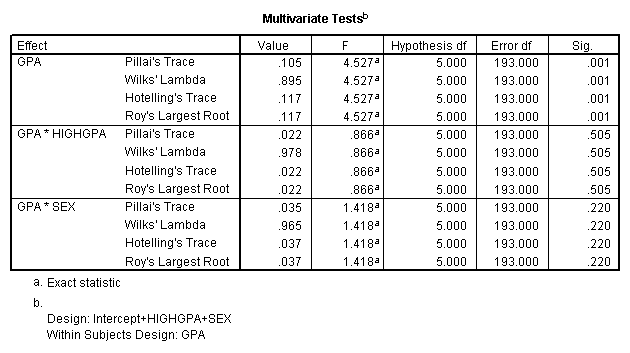
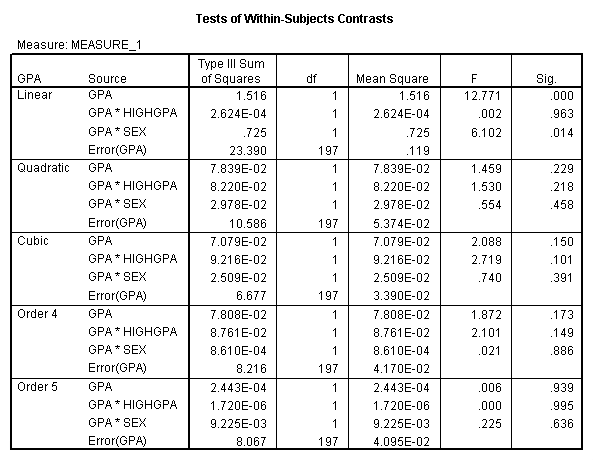
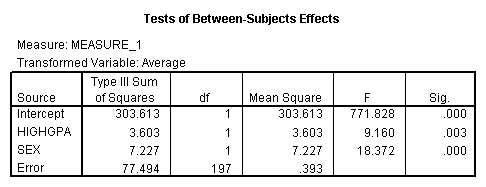
Table 5.2:
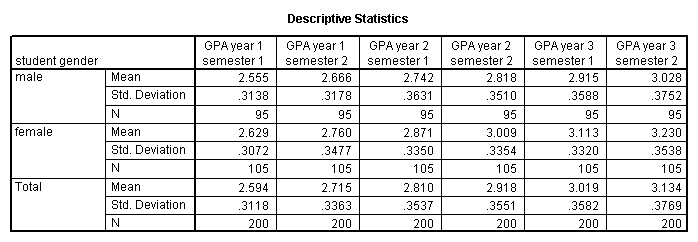
Figure 5.3 on page 80.
GET FILE='E:hoxspssgpaflat.sav'.

GRAPH
  /HISTOGRAM(NORMAL)=gpa .
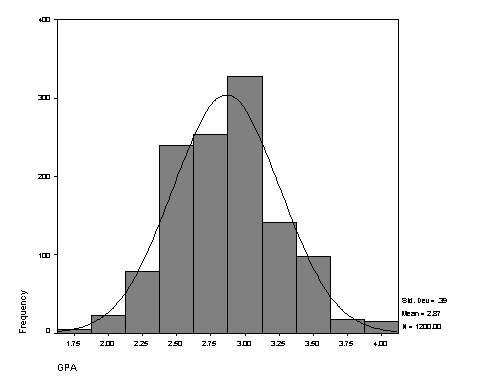
Table 5.3 on page 81. Data sets we are going to use is https://stats.idre.ucla.edu/wp-content/uploads/2016/02/gpa4chp5.sav and gpa4ch5_lev2.sav and we assume that an SSM file has been created based on these data files. The variable student links the two data sets.
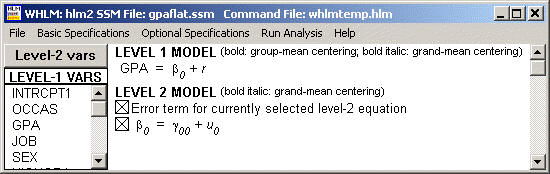
Part 1: Null model.
 Sigma_squared =      0.09759
 Tau
 INTRCPT1,B0      0.05714
Tau (as correlations)
 INTRCPT1,B0  1.000
 ----------------------------------------------------
  Random level-1 coefficient   Reliability estimate
 ----------------------------------------------------
  INTRCPT1, B0                        0.778
 ----------------------------------------------------
The value of the likelihood function at iteration 2 = -4.588466E+002
 Final estimation of fixed effects:
 ----------------------------------------------------------------------------
                                       Standard             Approx.
    Fixed Effect         Coefficient   Error      T-ratio   d.f.     P-value
 ----------------------------------------------------------------------------
 For       INTRCPT1, B0
    INTRCPT2, G00           2.865000   0.019157   149.551       199    0.000
 ----------------------------------------------------------------------------
 Final estimation of fixed effects
 (with robust standard errors)
 ----------------------------------------------------------------------------
                                       Standard             Approx.
    Fixed Effect         Coefficient   Error      T-ratio   d.f.     P-value
 ----------------------------------------------------------------------------
 For       INTRCPT1, B0
    INTRCPT2, G00           2.865000   0.019109   149.927       199    0.000
 ----------------------------------------------------------------------------
 Final estimation of variance components:
 -----------------------------------------------------------------------------
 Random Effect           Standard      Variance     df    Chi-square  P-value
                         Deviation     Component
 -----------------------------------------------------------------------------
 INTRCPT1,       U0        0.23903       0.05714   199     898.04285    0.000
  level-1,       R         0.31239       0.09759
 -----------------------------------------------------------------------------
 Statistics for current covariance components model
 --------------------------------------------------
 Deviance                       = 917.693135
 Number of estimated parameters = 2
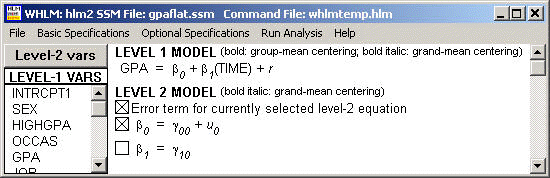
Part 2: Additional variable time is added.
 Sigma_squared =      0.05809
 Tau
 INTRCPT1,B0      0.06372
Tau (as correlations)
 INTRCPT1,B0  1.000
 ----------------------------------------------------
  Random level-1 coefficient   Reliability estimate
 ----------------------------------------------------
  INTRCPT1, B0                        0.868
 ----------------------------------------------------
The value of the likelihood function at iteration 4 = -2.044464E+002
 Final estimation of fixed effects:
 ----------------------------------------------------------------------------
                                       Standard             Approx.
    Fixed Effect         Coefficient   Error      T-ratio   d.f.     P-value
 ----------------------------------------------------------------------------
 For       INTRCPT1, B0
    INTRCPT2, G00           2.599214   0.021697   119.799       199    0.000
 For     TIME slope, B1
    INTRCPT2, G10           0.106314   0.004074    26.096      1198    0.000
 ----------------------------------------------------------------------------
 Final estimation of fixed effects
 (with robust standard errors)
 ----------------------------------------------------------------------------
                                       Standard             Approx.
    Fixed Effect         Coefficient   Error      T-ratio   d.f.     P-value
 ----------------------------------------------------------------------------
 For       INTRCPT1, B0
    INTRCPT2, G00           2.599214   0.018311   141.947       199    0.000
 For     TIME slope, B1
    INTRCPT2, G10           0.106314   0.005870    18.111      1198    0.000
 ----------------------------------------------------------------------------
 Final estimation of variance components:
 -----------------------------------------------------------------------------
 Random Effect           Standard      Variance     df    Chi-square  P-value
                         Deviation     Component
 -----------------------------------------------------------------------------
 INTRCPT1,       U0        0.25243       0.06372   199    1508.73327    0.000
  level-1,       R         0.24102       0.05809
 -----------------------------------------------------------------------------
 Statistics for current covariance components model
 --------------------------------------------------
 Deviance                       = 408.892880
 Number of estimated parameters = 2
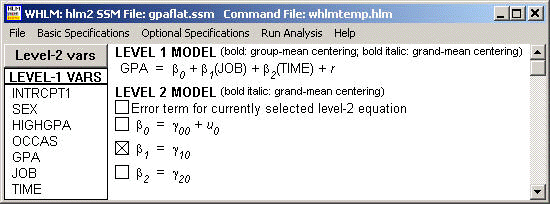
Part 3: The variable job is added to the model as a fixed effect.
 Sigma_squared =      0.05572
 Tau
 INTRCPT1,B0      0.05368
Tau (as correlations)
 INTRCPT1,B0  1.000
 ----------------------------------------------------
  Random level-1 coefficient   Reliability estimate
 ----------------------------------------------------
  INTRCPT1, B0                        0.853
 ----------------------------------------------------
The value of the likelihood function at iteration 6 = -1.700095E+002
 Final estimation of fixed effects:
 ----------------------------------------------------------------------------
                                       Standard             Approx.
    Fixed Effect         Coefficient   Error      T-ratio   d.f.     P-value
 ----------------------------------------------------------------------------
 For       INTRCPT1, B0
    INTRCPT2, G00           2.945613   0.044520    66.164       199    0.000
 For      JOB slope, B1
    INTRCPT2, G10          -0.160760   0.018375    -8.749      1197    0.000
 For     TIME slope, B2
    INTRCPT2, G20           0.103168   0.004006    25.753      1197    0.000
 ----------------------------------------------------------------------------
 Final estimation of fixed effects
 (with robust standard errors)
 ----------------------------------------------------------------------------
                                       Standard             Approx.
    Fixed Effect         Coefficient   Error      T-ratio   d.f.     P-value
 ----------------------------------------------------------------------------
 For       INTRCPT1, B0
    INTRCPT2, G00           2.945613   0.040529    72.680       199    0.000
 For      JOB slope, B1
    INTRCPT2, G10          -0.160760   0.016312    -9.855      1197    0.000
 For     TIME slope, B2
    INTRCPT2, G20           0.103168   0.005512    18.715      1197    0.000
 ----------------------------------------------------------------------------
 Final estimation of variance components:
 -----------------------------------------------------------------------------
 Random Effect           Standard      Variance     df    Chi-square  P-value
                         Deviation     Component
 -----------------------------------------------------------------------------
 INTRCPT1,       U0        0.23169       0.05368   199    1349.00558    0.000
  level-1,       R         0.23604       0.05572
 -----------------------------------------------------------------------------
 Statistics for current covariance components model
 --------------------------------------------------
 Deviance                       = 340.019023
 Number of estimated parameters = 2
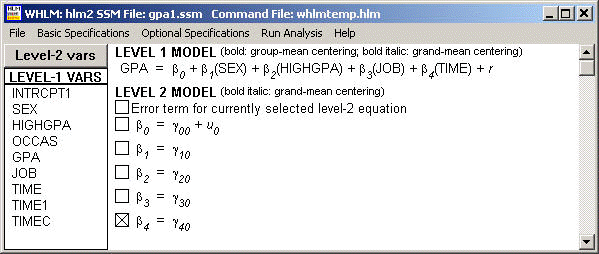
Part 4: The variables sex and highgpa are added.
 Sigma_squared =      0.05572
 Tau
 INTRCPT1,B0      0.04661
Tau (as correlations)
 INTRCPT1,B0  1.000
 ----------------------------------------------------
  Random level-1 coefficient   Reliability estimate
 ----------------------------------------------------
  INTRCPT1, B0                        0.834
 ----------------------------------------------------
The value of the likelihood function at iteration 7 = -1.623520E+002
 Final estimation of fixed effects:
 ----------------------------------------------------------------------------
                                       Standard             Approx.
    Fixed Effect         Coefficient   Error      T-ratio   d.f.     P-value
 ----------------------------------------------------------------------------
 For       INTRCPT1, B0
    INTRCPT2, G00           2.464035   0.112080    21.985       199    0.000
 For      SEX slope, B1
    INTRCPT2, G10           0.148417   0.033577     4.420      1195    0.000
 For  HIGHGPA slope, B2
    INTRCPT2, G20           0.085856   0.028198     3.045      1195    0.003
 For      JOB slope, B3
    INTRCPT2, G30          -0.161340   0.018328    -8.803      1195    0.000
 For     TIME slope, B4
    INTRCPT2, G40           0.103157   0.004006    25.750      1195    0.000
 ----------------------------------------------------------------------------
 Final estimation of fixed effects
 (with robust standard errors)
 ----------------------------------------------------------------------------
                                       Standard             Approx.
    Fixed Effect         Coefficient   Error      T-ratio   d.f.     P-value
 ----------------------------------------------------------------------------
 For       INTRCPT1, B0
    INTRCPT2, G00           2.464035   0.105358    23.387       199    0.000
 For      SEX slope, B1
    INTRCPT2, G10           0.148417   0.033188     4.472      1195    0.000
 For  HIGHGPA slope, B2
    INTRCPT2, G20           0.085856   0.026782     3.206      1195    0.002
 For      JOB slope, B3
    INTRCPT2, G30          -0.161340   0.016274    -9.914      1195    0.000
 For     TIME slope, B4
    INTRCPT2, G40           0.103157   0.005509    18.726      1195    0.000
 ----------------------------------------------------------------------------
 Final estimation of variance components:
 -----------------------------------------------------------------------------
 Random Effect           Standard      Variance     df    Chi-square  P-value
                         Deviation     Component
 -----------------------------------------------------------------------------
 INTRCPT1,       U0        0.21590       0.04661   199    1185.49373    0.000
  level-1,       R         0.23605       0.05572
 -----------------------------------------------------------------------------
 Statistics for current covariance components model
 --------------------------------------------------
 Deviance                       = 324.704078
 Number of estimated parameters = 2
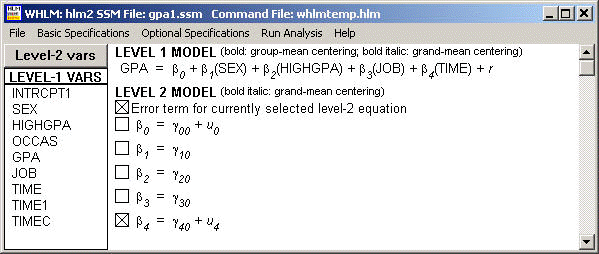
Table 5.4 on page 83.
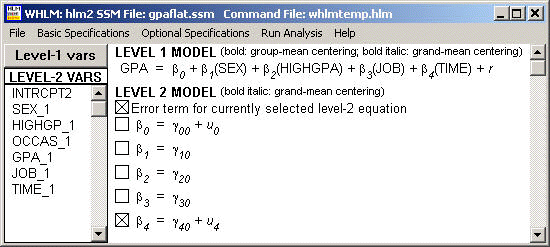
Part 1: The variable time is a random effect.
 Sigma_squared =      0.04180
 Tau
 INTRCPT1,B0      0.03978      -0.00260
     TIME,B4     -0.00260       0.00395
Tau (as correlations)
 INTRCPT1,B0  1.000 -0.208
     TIME,B4 -0.208  1.000
 ----------------------------------------------------
  Random level-1 coefficient   Reliability estimate
 ----------------------------------------------------
  INTRCPT1, B0                        0.645
      TIME, B4                        0.623
 ----------------------------------------------------
The value of the likelihood function at iteration 13 = -1.050516E+002
 Final estimation of fixed effects:
 ----------------------------------------------------------------------------
                                       Standard             Approx.
    Fixed Effect         Coefficient   Error      T-ratio   d.f.     P-value
 ----------------------------------------------------------------------------
 For       INTRCPT1, B0
    INTRCPT2, G00           2.409738   0.105786    22.779       199    0.000
 For      SEX slope, B1
    INTRCPT2, G10           0.116763   0.031778     3.674      1195    0.000
 For  HIGHGPA slope, B2
    INTRCPT2, G20           0.089846   0.026681     3.367      1195    0.001
 For      JOB slope, B3
    INTRCPT2, G30          -0.119271   0.017477    -6.824      1195    0.000
 For     TIME slope, B4
    INTRCPT2, G40           0.103980   0.005639    18.440       199    0.000
 ----------------------------------------------------------------------------
 Final estimation of fixed effects
 (with robust standard errors)
 ----------------------------------------------------------------------------
                                       Standard             Approx.
    Fixed Effect         Coefficient   Error      T-ratio   d.f.     P-value
 ----------------------------------------------------------------------------
 For       INTRCPT1, B0
    INTRCPT2, G00           2.409738   0.099731    24.162       199    0.000
 For      SEX slope, B1
    INTRCPT2, G10           0.116763   0.031295     3.731      1195    0.000
 For  HIGHGPA slope, B2
    INTRCPT2, G20           0.089846   0.024903     3.608      1195    0.001
 For      JOB slope, B3
    INTRCPT2, G30          -0.119271   0.015345    -7.773      1195    0.000
 For     TIME slope, B4
    INTRCPT2, G40           0.103980   0.005591    18.597       199    0.000
 ----------------------------------------------------------------------------
 Final estimation of variance components:
 -----------------------------------------------------------------------------
 Random Effect           Standard      Variance     df    Chi-square  P-value
                         Deviation     Component
 -----------------------------------------------------------------------------
 INTRCPT1,       U0        0.19945       0.03978   199     555.76390    0.000
     TIME slope, U4        0.06282       0.00395   199     527.44573    0.000
  level-1,       R         0.20446       0.04180
 -----------------------------------------------------------------------------
 Statistics for current covariance components model
 --------------------------------------------------
 Deviance                       = 210.103251
 Number of estimated parameters = 4
Part 2: Cross level interaction of variable time and gender is included. The column with standardized coefficients can be calculated manually and is omitted here.

 Sigma_squared =      0.04181
 Tau
 INTRCPT1,B0      0.03942      -0.00235
     TIME,B4     -0.00235       0.00376
Tau (as correlations)
 INTRCPT1,B0  1.000 -0.194
     TIME,B4 -0.194  1.000
 ----------------------------------------------------
  Random level-1 coefficient   Reliability estimate
 ----------------------------------------------------
  INTRCPT1, B0                        0.643
      TIME, B4                        0.611
 ----------------------------------------------------
The value of the likelihood function at iteration 14 = -1.060738E+002
 Final estimation of fixed effects:
 ----------------------------------------------------------------------------
                                       Standard             Approx.
    Fixed Effect         Coefficient   Error      T-ratio   d.f.     P-value
 ----------------------------------------------------------------------------
 For       INTRCPT1, B0
    INTRCPT2, G00           2.472653   0.108253    22.841       199    0.000
 For      SEX slope, B1
    INTRCPT2, G10           0.076821   0.035154     2.185      1194    0.029
 For  HIGHGPA slope, B2
    INTRCPT2, G20           0.089820   0.026674     3.367      1194    0.001
 For      JOB slope, B3
    INTRCPT2, G30          -0.120165   0.017449    -6.887      1194    0.000
 For     TIME slope, B4
    INTRCPT2, G40           0.059017   0.017819     3.312       198    0.001
       SEX_1, G41           0.029472   0.011101     2.655       198    0.008
 ----------------------------------------------------------------------------
 Final estimation of fixed effects
 (with robust standard errors)
 ----------------------------------------------------------------------------
                                       Standard             Approx.
    Fixed Effect         Coefficient   Error      T-ratio   d.f.     P-value
 ----------------------------------------------------------------------------
 For       INTRCPT1, B0
    INTRCPT2, G00           2.472653   0.102489    24.126       199    0.000
 For      SEX slope, B1
    INTRCPT2, G10           0.076821   0.034651     2.217      1194    0.027
 For  HIGHGPA slope, B2
    INTRCPT2, G20           0.089820   0.024893     3.608      1194    0.001
 For      JOB slope, B3
    INTRCPT2, G30          -0.120165   0.015436    -7.784      1194    0.000
 For     TIME slope, B4
    INTRCPT2, G40           0.059017   0.017913     3.295       198    0.001
       SEX_1, G41           0.029472   0.011062     2.664       198    0.008
 ----------------------------------------------------------------------------
 Final estimation of variance components:
 -----------------------------------------------------------------------------
 Random Effect           Standard      Variance     df    Chi-square  P-value
                         Deviation     Component
 -----------------------------------------------------------------------------
 INTRCPT1,       U0        0.19855       0.03942   199     551.91797    0.000
     TIME slope, U4        0.06129       0.00376   198     508.91753    0.000
  level-1,       R         0.20449       0.04181
 -----------------------------------------------------------------------------
 Statistics for current covariance components model
 --------------------------------------------------
 Deviance                       = 212.147638
 Number of estimated parameters = 4
Figure 5.4 on page 84 based on Table 5.4 Part 2. Before the model is run, we have to request data for graphing equations. This is done through Basic Model Specifications by simply clicking on Graph equations.
Then we can run the model and we will be able to use the Graph Equations option from the File menu.
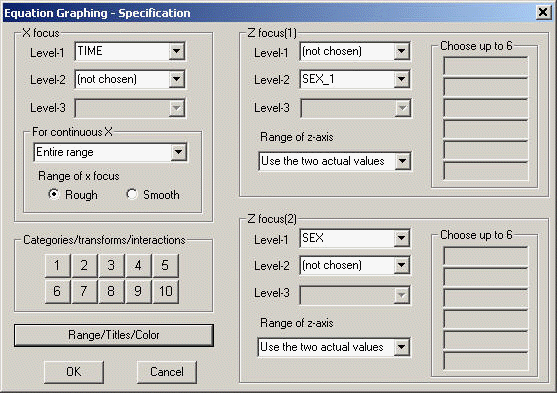
Select variables as shown from the above screen shot, we can produce the following plot. Notice that the title for the graph and the x-axis and y-axis can be modified by clicking on Range/Titles/Color. The dashed red line corresponds to the group of SEX = 2 and SEX_1 = 2 (level 2 variable of SEX), the female group and the solid blue line corresponds to the group of SEX = 1 and SEX_1 = 1, the male group.
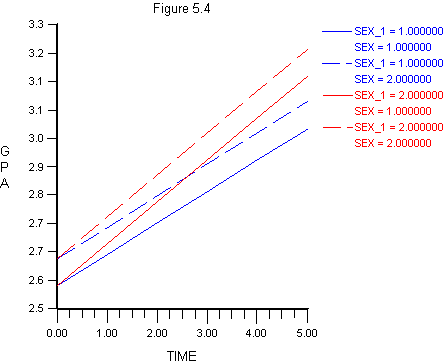
Table 5.5 on page 85. This requires some recoding of the variable time. Since HLM does not provide any data management facility, we will do the recoding using SPSS. The new data file will be https://stats.idre.ucla.edu/wp-content/uploads/2016/02/gpa4chp5_time.sav and the level 2 data file is the same as before.
Part 1: 1st occasion = 0, same as the first part of Table 5.4. We omit it here.
Part 2: The variable time has been recoded as -5, …,-1, 0, …with the last occasion coded as zero as variable time1.

 Sigma_squared =      0.04180
 Tau
 INTRCPT1,B0      0.11240       0.01713
    TIME1,B4      0.01713       0.00395

Tau (as correlations)
 INTRCPT1,B0  1.000  0.813
    TIME1,B4  0.813  1.000
 ----------------------------------------------------
  Random level-1 coefficient   Reliability estimate
 ----------------------------------------------------
  INTRCPT1, B0                        0.837
     TIME1, B4                        0.623
 ----------------------------------------------------
 Final estimation of fixed effects:
 ----------------------------------------------------------------------------
                                       Standard             Approx.
    Fixed Effect         Coefficient   Error      T-ratio   d.f.     P-value
 ----------------------------------------------------------------------------
 For       INTRCPT1, B0
    INTRCPT2, G00           2.929631   0.106862    27.415       199    0.000
 For      SEX slope, B1
    INTRCPT2, G10           0.116769   0.031779     3.674      1195    0.000
 For  HIGHGPA slope, B2
    INTRCPT2, G20           0.089845   0.026681     3.367      1195    0.001
 For      JOB slope, B3
    INTRCPT2, G30          -0.119271   0.017477    -6.824      1195    0.000
 For    TIME1 slope, B4
    INTRCPT2, G40           0.103980   0.005639    18.440       199    0.000
 ----------------------------------------------------------------------------
 Final estimation of fixed effects
 (with robust standard errors)
 ----------------------------------------------------------------------------
                                       Standard             Approx.
    Fixed Effect         Coefficient   Error      T-ratio   d.f.     P-value
 ----------------------------------------------------------------------------
 For       INTRCPT1, B0
    INTRCPT2, G00           2.929631   0.102510    28.579       199    0.000
 For      SEX slope, B1
    INTRCPT2, G10           0.116769   0.031295     3.731      1195    0.000
 For  HIGHGPA slope, B2
    INTRCPT2, G20           0.089845   0.024903     3.608      1195    0.001
 For      JOB slope, B3
    INTRCPT2, G30          -0.119271   0.015345    -7.773      1195    0.000
 For    TIME1 slope, B4
    INTRCPT2, G40           0.103980   0.005591    18.597       199    0.000
 ----------------------------------------------------------------------------

 Final estimation of variance components:
 -----------------------------------------------------------------------------
 Random Effect           Standard      Variance     df    Chi-square  P-value
                         Deviation     Component
 -----------------------------------------------------------------------------
 INTRCPT1,       U0        0.33525       0.11240   199    1215.34816    0.000
    TIME1 slope, U4        0.06282       0.00395   199     527.45147    0.000
  level-1,       R         0.20446       0.04180
 -----------------------------------------------------------------------------

 Statistics for current covariance components model
 --------------------------------------------------
 Deviance                       = 210.103292
 Number of estimated parameters = 4
Part 3: The variable time is recoded centered around its mean and is included as a fixed effect as variable timec.
 Sigma_squared =      0.04180
 Tau
 INTRCPT1,B0      0.05142       0.00726
    TIMEC,B4      0.00726       0.00395

Tau (as correlations)
 INTRCPT1,B0  1.000  0.510
    TIMEC,B4  0.510  1.000
 ----------------------------------------------------
  Random level-1 coefficient   Reliability estimate
 ----------------------------------------------------
  INTRCPT1, B0                        0.881
     TIMEC, B4                        0.623
 ----------------------------------------------------
 Final estimation of fixed effects:
 ----------------------------------------------------------------------------
                                       Standard             Approx.
    Fixed Effect         Coefficient   Error      T-ratio   d.f.     P-value
 ----------------------------------------------------------------------------
 For       INTRCPT1, B0
    INTRCPT2, G00           2.669686   0.105387    25.332       199    0.000
 For      SEX slope, B1
    INTRCPT2, G10           0.116766   0.031778     3.674      1195    0.000
 For  HIGHGPA slope, B2
    INTRCPT2, G20           0.089845   0.026681     3.367      1195    0.001
 For      JOB slope, B3
    INTRCPT2, G30          -0.119272   0.017477    -6.824      1195    0.000
 For    TIMEC slope, B4
    INTRCPT2, G40           0.103980   0.005639    18.441       199    0.000
 ----------------------------------------------------------------------------
 Final estimation of fixed effects
 (with robust standard errors)
 ----------------------------------------------------------------------------
                                       Standard             Approx.
    Fixed Effect         Coefficient   Error      T-ratio   d.f.     P-value
 ----------------------------------------------------------------------------
 For       INTRCPT1, B0
    INTRCPT2, G00           2.669686   0.100159    26.654       199    0.000
 For      SEX slope, B1
    INTRCPT2, G10           0.116766   0.031295     3.731      1195    0.000
 For  HIGHGPA slope, B2
    INTRCPT2, G20           0.089845   0.024903     3.608      1195    0.001
 For      JOB slope, B3
    INTRCPT2, G30          -0.119272   0.015345    -7.773      1195    0.000
 For    TIMEC slope, B4
    INTRCPT2, G40           0.103980   0.005591    18.597       199    0.000
 ----------------------------------------------------------------------------

 Final estimation of variance components:
 -----------------------------------------------------------------------------
 Random Effect           Standard      Variance     df    Chi-square  P-value
                         Deviation     Component
 -----------------------------------------------------------------------------
 INTRCPT1,       U0        0.22676       0.05142   199    1652.91589    0.000
    TIMEC slope, U4        0.06282       0.00395   199     527.44545    0.000
  level-1,       R         0.20446       0.04180
 -----------------------------------------------------------------------------

 Statistics for current covariance components model
 --------------------------------------------------
 Deviance                       = 210.103247
 Number of estimated parameters = 4
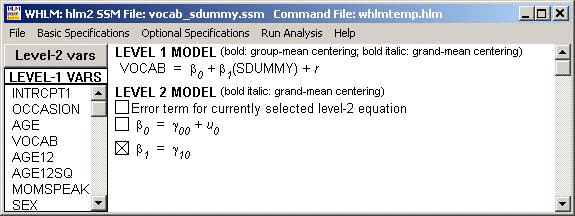
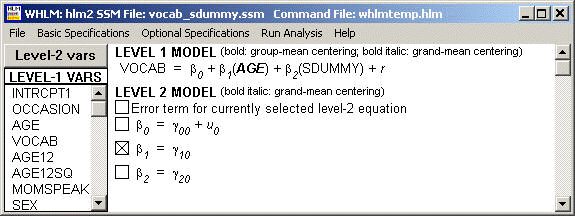
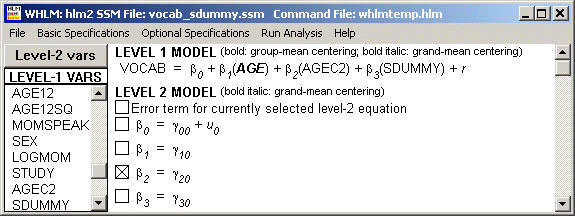
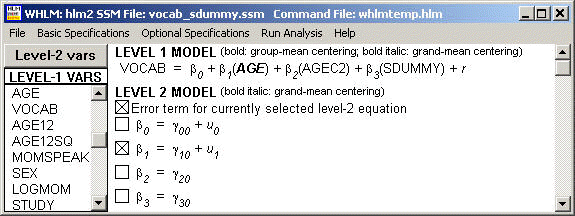
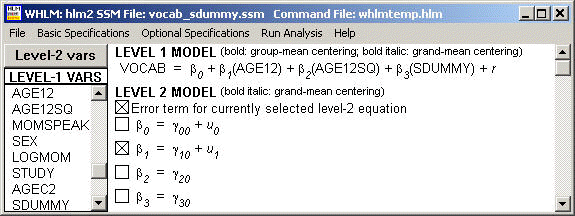
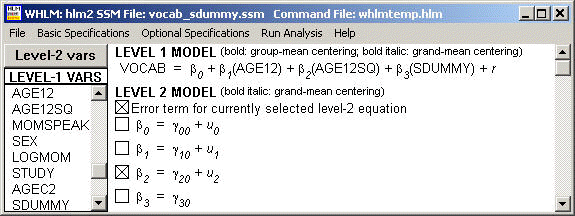
Table 5.7 on page 89 using children’s vocabulary data. Variable study has been recoded into variable sdummy. The variable sdummy is -.5 for the first study and .5 for the second study. We have created a level-1 SPSS data file https://stats.idre.ucla.edu/wp-content/uploads/2016/02/vocab_sdummy.sav and a level-2 SPSS https://stats.idre.ucla.edu/wp-content/uploads/2016/02/vocab_l2.sav data file. We assume that an SSM has been created based on these two files. The linking variable is child.
Part 1: Intercept only
 Sigma_squared =  31206.85925
 Tau
 INTRCPT1,B0   2999.57775

Tau (as correlations)
 INTRCPT1,B0  1.000
 ----------------------------------------------------
  Random level-1 coefficient   Reliability estimate
 ----------------------------------------------------
  INTRCPT1, B0                        0.347
 ----------------------------------------------------
 Final estimation of fixed effects:
 ----------------------------------------------------------------------------
                                       Standard             Approx.
    Fixed Effect         Coefficient   Error      T-ratio   d.f.     P-value
 ----------------------------------------------------------------------------
 For       INTRCPT1, B0
    INTRCPT2, G00         132.056729  20.225570     6.529        21    0.000
 For   SDUMMY slope, B1
    INTRCPT2, G10        -110.886184  40.451140    -2.741       124    0.007
 ----------------------------------------------------------------------------
 Final estimation of fixed effects
 (with robust standard errors)
 ----------------------------------------------------------------------------
                                       Standard             Approx.
    Fixed Effect         Coefficient   Error      T-ratio   d.f.     P-value
 ----------------------------------------------------------------------------
 For       INTRCPT1, B0
    INTRCPT2, G00         132.056729  16.147278     8.178        21    0.000
 For   SDUMMY slope, B1
    INTRCPT2, G10        -110.886184  32.294556    -3.434       124    0.001
 ----------------------------------------------------------------------------

 Final estimation of variance components:
 -----------------------------------------------------------------------------
 Random Effect           Standard      Variance     df    Chi-square  P-value
                         Deviation     Component
 -----------------------------------------------------------------------------
 INTRCPT1,       U0       54.76840    2999.57775    21      28.88002    0.117
  level-1,       R       176.65463   31206.85925
 -----------------------------------------------------------------------------

 Statistics for current covariance components model
 --------------------------------------------------
 Deviance                       = 1651.929448
 Number of estimated parameters = 2
Part 2: The variable age is grand mean centered and is included as a fixed effect.
 Sigma_squared =  10498.58940
 Tau
 INTRCPT1,B0   5471.56387

Tau (as correlations)
 INTRCPT1,B0  1.000
 ----------------------------------------------------
  Random level-1 coefficient   Reliability estimate
 ----------------------------------------------------
  INTRCPT1, B0                        0.735
 ----------------------------------------------------
 Final estimation of fixed effects:
 ----------------------------------------------------------------------------
                                       Standard             Approx.
    Fixed Effect         Coefficient   Error      T-ratio   d.f.     P-value
 ----------------------------------------------------------------------------
 For       INTRCPT1, B0
    INTRCPT2, G00         137.771784  18.457888     7.464        21    0.000
 For      AGE slope, B1
    INTRCPT2, G10          29.558847   2.025611    14.593       123    0.000
 For   SDUMMY slope, B2
    INTRCPT2, G20         -69.767209  37.013631    -1.885       123    0.059
 ----------------------------------------------------------------------------
 Final estimation of fixed effects
 (with robust standard errors)
 ----------------------------------------------------------------------------
                                       Standard             Approx.
    Fixed Effect         Coefficient   Error      T-ratio   d.f.     P-value
 ----------------------------------------------------------------------------
 For       INTRCPT1, B0
    INTRCPT2, G00         137.771784  17.151265     8.033        21    0.000
 For      AGE slope, B1
    INTRCPT2, G10          29.558847   4.124667     7.166       123    0.000
 For   SDUMMY slope, B2
    INTRCPT2, G20         -69.767209  28.676218    -2.433       123    0.015
 ----------------------------------------------------------------------------

 Final estimation of variance components:
 -----------------------------------------------------------------------------
 Random Effect           Standard      Variance     df    Chi-square  P-value
                         Deviation     Component
 -----------------------------------------------------------------------------
 INTRCPT1,       U0       73.97002    5471.56387    21      87.94757    0.000
  level-1,       R       102.46262   10498.58940
 -----------------------------------------------------------------------------

 Statistics for current covariance components model
 --------------------------------------------------
 Deviance                       = 1529.224765
 Number of estimated parameters = 2
Part 3: The variable agec2 (age being centered and squared) is also included.
 Sigma_squared =   7883.51225
 Tau
 INTRCPT1,B0   5749.18627

Tau (as correlations)
 INTRCPT1,B0  1.000
 ----------------------------------------------------
  Random level-1 coefficient   Reliability estimate
 ----------------------------------------------------
  INTRCPT1, B0                        0.794
 ----------------------------------------------------
 Final estimation of fixed effects:
 ----------------------------------------------------------------------------
                                       Standard             Approx.
    Fixed Effect         Coefficient   Error      T-ratio   d.f.     P-value
 ----------------------------------------------------------------------------
 For       INTRCPT1, B0
    INTRCPT2, G00          84.785740  20.215591     4.194        21    0.000
 For      AGE slope, B1
    INTRCPT2, G10          30.629929   1.764394    17.360       122    0.000
 For    AGEC2 slope, B2
    INTRCPT2, G20           2.557290   0.427127     5.987       122    0.000
 For   SDUMMY slope, B3
    INTRCPT2, G30         -68.233833  36.431132    -1.873       122    0.061
 ----------------------------------------------------------------------------
 Final estimation of fixed effects
 (with robust standard errors)
 ----------------------------------------------------------------------------
                                       Standard             Approx.
    Fixed Effect         Coefficient   Error      T-ratio   d.f.     P-value
 ----------------------------------------------------------------------------
 For       INTRCPT1, B0
    INTRCPT2, G00          84.785740  11.942216     7.100        21    0.000
 For      AGE slope, B1
    INTRCPT2, G10          30.629929   4.032159     7.596       122    0.000
 For    AGEC2 slope, B2
    INTRCPT2, G20           2.557290   0.308919     8.278       122    0.000
 For   SDUMMY slope, B3
    INTRCPT2, G30         -68.233833  28.490300    -2.395       122    0.017
 ----------------------------------------------------------------------------

 Final estimation of variance components:
 -----------------------------------------------------------------------------
 Random Effect           Standard      Variance     df    Chi-square  P-value
                         Deviation     Component
 -----------------------------------------------------------------------------
 INTRCPT1,       U0       75.82339    5749.18627    21     117.06725    0.000
  level-1,       R        88.78914    7883.51225
 -----------------------------------------------------------------------------

 Statistics for current covariance components model
 --------------------------------------------------
 Deviance                       = 1499.835215
 Number of estimated parameters = 2
Part 4: The variable age is centered and included as a random effect.
 Sigma_squared =    888.15776
 Tau
 INTRCPT1,B0   6723.81032    1315.60698
      AGE,B1   1315.60698     257.43050

Tau (as correlations)
 INTRCPT1,B0  1.000  1.000
      AGE,B1  1.000  1.000
 ----------------------------------------------------
  Random level-1 coefficient   Reliability estimate
 ----------------------------------------------------
  INTRCPT1, B0                        0.974
       AGE, B1                        0.968
 ----------------------------------------------------
 Final estimation of fixed effects:
 ----------------------------------------------------------------------------
                                       Standard             Approx.
    Fixed Effect         Coefficient   Error      T-ratio   d.f.     P-value
 ----------------------------------------------------------------------------
 For       INTRCPT1, B0
    INTRCPT2, G00          87.983071  17.952062     4.901        21    0.000
 For      AGE slope, B1
    INTRCPT2, G10          28.135347   3.477898     8.090        21    0.000
 For    AGEC2 slope, B2
    INTRCPT2, G20           2.174898   0.147545    14.741       122    0.000
 For   SDUMMY slope, B3
    INTRCPT2, G30          -4.825112   8.132635    -0.593       122    0.553
 ----------------------------------------------------------------------------
 Final estimation of fixed effects
 (with robust standard errors)
 ----------------------------------------------------------------------------
                                       Standard             Approx.
    Fixed Effect         Coefficient   Error      T-ratio   d.f.     P-value
 ----------------------------------------------------------------------------
 For       INTRCPT1, B0
    INTRCPT2, G00          87.983071  14.209464     6.192        21    0.000
 For      AGE slope, B1
    INTRCPT2, G10          28.135347   3.503365     8.031        21    0.000
 For    AGEC2 slope, B2
    INTRCPT2, G20           2.174898   0.201680    10.784       122    0.000
 For   SDUMMY slope, B3
    INTRCPT2, G30          -4.825112   3.476148    -1.388       122    0.165
 ----------------------------------------------------------------------------

 Final estimation of variance components:
 -----------------------------------------------------------------------------
 Random Effect           Standard      Variance     df    Chi-square  P-value
                         Deviation     Component
 -----------------------------------------------------------------------------
 INTRCPT1,       U0       81.99884    6723.81032    21    1047.69383    0.000
      AGE slope, U1       16.04464     257.43050    21     839.05987    0.000
  level-1,       R        29.80198     888.15776
 -----------------------------------------------------------------------------

 Statistics for current covariance components model
 --------------------------------------------------
 Deviance                       = 1289.907514
 Number of estimated parameters = 4
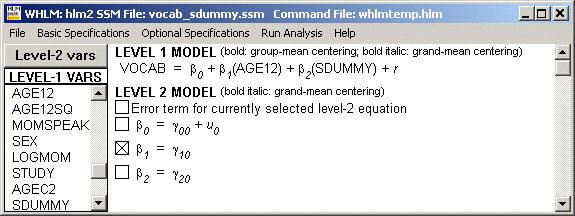
Table 5.9 on page 92.
Part 1: Intercept only model. This is the first part of Table 5.7 and we omit it here.
Part 2: The variable age is centered on 12 months and is included as a fixed effect.
 Sigma_squared =  10498.58940
 Tau
 INTRCPT1,B0   5471.56387

Tau (as correlations)
 INTRCPT1,B0  1.000
 ----------------------------------------------------
  Random level-1 coefficient   Reliability estimate
 ----------------------------------------------------
  INTRCPT1, B0                        0.735
 ----------------------------------------------------
 Final estimation of fixed effects:
 ----------------------------------------------------------------------------
                                       Standard             Approx.
    Fixed Effect         Coefficient   Error      T-ratio   d.f.     P-value
 ----------------------------------------------------------------------------
 For       INTRCPT1, B0
    INTRCPT2, G00         -65.855842  22.897709    -2.876        21    0.010
 For    AGE12 slope, B1
    INTRCPT2, G10          29.558847   2.025611    14.593       123    0.000
 For   SDUMMY slope, B2
    INTRCPT2, G20         -69.767209  37.013631    -1.885       123    0.059
 ----------------------------------------------------------------------------
 Final estimation of fixed effects
 (with robust standard errors)
 ----------------------------------------------------------------------------
                                       Standard             Approx.
    Fixed Effect         Coefficient   Error      T-ratio   d.f.     P-value
 ----------------------------------------------------------------------------
 For       INTRCPT1, B0
    INTRCPT2, G00         -65.855842  15.130493    -4.353        21    0.000
 For    AGE12 slope, B1
    INTRCPT2, G10          29.558847   4.124667     7.166       123    0.000
 For   SDUMMY slope, B2
    INTRCPT2, G20         -69.767209  28.676218    -2.433       123    0.015
 ----------------------------------------------------------------------------

 Final estimation of variance components:
 -----------------------------------------------------------------------------
 Random Effect           Standard      Variance     df    Chi-square  P-value
                         Deviation     Component
 -----------------------------------------------------------------------------
 INTRCPT1,       U0       73.97002    5471.56387    21      87.94757    0.000
  level-1,       R       102.46262   10498.58940
 -----------------------------------------------------------------------------

 Statistics for current covariance components model
 --------------------------------------------------
 Deviance                       = 1529.224765
 Number of estimated parameters = 2
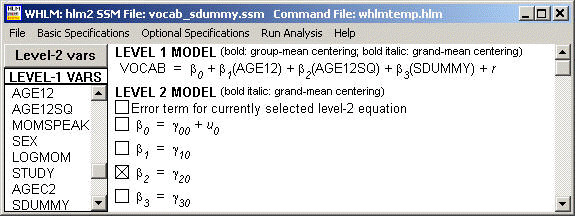
Part 3: The variable age12sq is included as a fixed effect.
 Sigma_squared =   7883.51227
 Tau
 INTRCPT1,B0   5749.18625

Tau (as correlations)
 INTRCPT1,B0  1.000
 ----------------------------------------------------
  Random level-1 coefficient   Reliability estimate
 ----------------------------------------------------
  INTRCPT1, B0                        0.794
 ----------------------------------------------------
 Final estimation of fixed effects:
 ----------------------------------------------------------------------------
                                       Standard             Approx.
    Fixed Effect         Coefficient   Error      T-ratio   d.f.     P-value
 ----------------------------------------------------------------------------
 For       INTRCPT1, B0
    INTRCPT2, G00          -4.820517  23.929343    -0.201        21    0.843
 For    AGE12 slope, B1
    INTRCPT2, G10          -4.609531   5.972419    -0.772       122    0.440
 For  AGE12SQ slope, B2
    INTRCPT2, G20           2.557290   0.427127     5.987       122    0.000
 For   SDUMMY slope, B3
    INTRCPT2, G30         -68.233833  36.431131    -1.873       122    0.061
 ----------------------------------------------------------------------------
 Final estimation of fixed effects
 (with robust standard errors)
 ----------------------------------------------------------------------------
                                       Standard             Approx.
    Fixed Effect         Coefficient   Error      T-ratio   d.f.     P-value
 ----------------------------------------------------------------------------
 For       INTRCPT1, B0
    INTRCPT2, G00          -4.820517   9.937283    -0.485        21    0.632
 For    AGE12 slope, B1
    INTRCPT2, G10          -4.609531   2.285767    -2.017       122    0.043
 For  AGE12SQ slope, B2
    INTRCPT2, G20           2.557290   0.308919     8.278       122    0.000
 For   SDUMMY slope, B3
    INTRCPT2, G30         -68.233833  28.490300    -2.395       122    0.017
 ----------------------------------------------------------------------------

 Final estimation of variance components:
 -----------------------------------------------------------------------------
 Random Effect           Standard      Variance     df    Chi-square  P-value
                         Deviation     Component
 -----------------------------------------------------------------------------
 INTRCPT1,       U0       75.82339    5749.18625    21     117.06726    0.000
  level-1,       R        88.78915    7883.51227
 -----------------------------------------------------------------------------

 Statistics for current covariance components model
 --------------------------------------------------
 Deviance                       = 1499.835215
 Number of estimated parameters = 2
Part 4: The variable age12 is a random effect.
 Sigma_squared =    888.15784
 Tau
 INTRCPT1,B0    814.50204    -457.80535
    AGE12,B1   -457.80535     257.43077

Tau (as correlations)
 INTRCPT1,B0  1.000 -1.000
    AGE12,B1 -1.000  1.000
 ----------------------------------------------------
  Random level-1 coefficient   Reliability estimate
 ----------------------------------------------------
  INTRCPT1, B0                        0.608
     AGE12, B1                        0.968
 ----------------------------------------------------
 Final estimation of fixed effects:
 ----------------------------------------------------------------------------
                                       Standard             Approx.
    Fixed Effect         Coefficient   Error      T-ratio   d.f.     P-value
 ----------------------------------------------------------------------------
 For       INTRCPT1, B0
    INTRCPT2, G00          -2.591218   8.483686    -0.305        21    0.763
 For    AGE12 slope, B1
    INTRCPT2, G10          -1.834766   3.973751    -0.462        21    0.649
 For  AGE12SQ slope, B2
    INTRCPT2, G20           2.174898   0.147545    14.741       122    0.000
 For   SDUMMY slope, B3
    INTRCPT2, G30          -4.825202   8.132632    -0.593       122    0.553
 ----------------------------------------------------------------------------
 Final estimation of fixed effects
 (with robust standard errors)
 ----------------------------------------------------------------------------
                                       Standard             Approx.
    Fixed Effect         Coefficient   Error      T-ratio   d.f.     P-value
 ----------------------------------------------------------------------------
 For       INTRCPT1, B0
    INTRCPT2, G00          -2.591218   2.794276    -0.927        21    0.365
 For    AGE12 slope, B1
    INTRCPT2, G10          -1.834766   1.862511    -0.985        21    0.336
 For  AGE12SQ slope, B2
    INTRCPT2, G20           2.174898   0.201680    10.784       122    0.000
 For   SDUMMY slope, B3
    INTRCPT2, G30          -4.825202   3.476167    -1.388       122    0.165
 ----------------------------------------------------------------------------

 Final estimation of variance components:
 -----------------------------------------------------------------------------
 Random Effect           Standard      Variance     df    Chi-square  P-value
                         Deviation     Component
 -----------------------------------------------------------------------------
 INTRCPT1,       U0       28.53948     814.50204    21      40.18939    0.007
    AGE12 slope, U1       16.04465     257.43077    21     839.06013    0.000
  level-1,       R        29.80198     888.15784
 -----------------------------------------------------------------------------

 Statistics for current covariance components model
 --------------------------------------------------
 Deviance                       = 1289.907521
 Number of estimated parameters = 4
Part 5: The variable age12 and age12sq are random effects.
 Sigma_squared =    679.38774
 Tau
 INTRCPT1,B0    128.31705     -84.78083      -7.03366
    AGE12,B1    -84.78083      57.62219       4.32581
  AGE12SQ,B2     -7.03366       4.32581       0.46216

Tau (as correlations)
 INTRCPT1,B0  1.000 -0.986 -0.913
    AGE12,B1 -0.986  1.000  0.838
  AGE12SQ,B2 -0.913  0.838  1.000
 ----------------------------------------------------
  Random level-1 coefficient   Reliability estimate
 ----------------------------------------------------
  INTRCPT1, B0                        0.178
     AGE12, B1                        0.434
   AGE12SQ, B2                        0.528
 ----------------------------------------------------
 Final estimation of fixed effects:
 ----------------------------------------------------------------------------
                                       Standard             Approx.
    Fixed Effect         Coefficient   Error      T-ratio   d.f.     P-value
 ----------------------------------------------------------------------------
 For       INTRCPT1, B0
    INTRCPT2, G00          -3.734573   5.708652    -0.654        21    0.520
 For    AGE12 slope, B1
    INTRCPT2, G10          -0.389827   2.415984    -0.161        21    0.874
 For  AGE12SQ slope, B2
    INTRCPT2, G20           2.040081   0.196456    10.384        21    0.000
 For   SDUMMY slope, B3
    INTRCPT2, G30          -1.117249   7.327091    -0.152       122    0.879
 ----------------------------------------------------------------------------
 Final estimation of fixed effects
 (with robust standard errors)
 ----------------------------------------------------------------------------
                                       Standard             Approx.
    Fixed Effect         Coefficient   Error      T-ratio   d.f.     P-value
 ----------------------------------------------------------------------------
 For       INTRCPT1, B0
    INTRCPT2, G00          -3.734573   2.763753    -1.351        21    0.191
 For    AGE12 slope, B1
    INTRCPT2, G10          -0.389827   2.080441    -0.187        21    0.853
 For  AGE12SQ slope, B2
    INTRCPT2, G20           2.040081   0.185602    10.992        21    0.000
 For   SDUMMY slope, B3
    INTRCPT2, G30          -1.117249   3.330613    -0.335       122    0.737
 ----------------------------------------------------------------------------

 Final estimation of variance components:
 -----------------------------------------------------------------------------
 Random Effect           Standard      Variance     df    Chi-square  P-value
                         Deviation     Component
 -----------------------------------------------------------------------------
 INTRCPT1,       U0       11.32771     128.31705    21       6.52714    >.500
    AGE12 slope, U1        7.59093      57.62219    21      33.17943    0.044
  AGE12SQ slope, U2        0.67982       0.46216    21      48.75723    0.001
  level-1,       R        26.06507     679.38774
 -----------------------------------------------------------------------------

 Statistics for current covariance components model
 --------------------------------------------------
 Deviance                       = 1265.180714
 Number of estimated parameters = 7
Table 5.10 on page 101.
Part 1: The variable time is a fixed effect and compound symmetry is assumed.
 Sigma_squared =      0.05562
 Standard Error of Sigma_squared =      0.00249

 Tau
 INTRCPT1,B0      0.04576

 Standard Errors of Tau
 INTRCPT1,B0      0.00552

Tau (as correlations)
 INTRCPT1,B0  1.000
 ----------------------------------------------------
  Random level-1 coefficient   Reliability estimate
 ----------------------------------------------------
  INTRCPT1, B0                        0.832
 ----------------------------------------------------
 Final estimation of fixed effects:
 ----------------------------------------------------------------------------
                                       Standard             Approx.
    Fixed Effect         Coefficient   Error      T-ratio   d.f.     P-value
 ----------------------------------------------------------------------------
 For       INTRCPT1, B0
    INTRCPT2, G00           2.465053   0.111312    22.145       199    0.000
 For      SEX slope, B1
    INTRCPT2, G10           0.148397   0.033312     4.455      1195    0.000
 For  HIGHGPA slope, B2
    INTRCPT2, G20           0.085838   0.027977     3.068      1195    0.003
 For      JOB slope, B3
    INTRCPT2, G30          -0.161774   0.018304    -8.838      1195    0.000
 For     TIME slope, B4
    INTRCPT2, G40           0.103148   0.004002    25.772      1195    0.000
 ----------------------------------------------------------------------------
 Final estimation of fixed effects
 (with robust standard errors)
 ----------------------------------------------------------------------------
                                       Standard             Approx.
    Fixed Effect         Coefficient   Error      T-ratio   d.f.     P-value
 ----------------------------------------------------------------------------
 For       INTRCPT1, B0
    INTRCPT2, G00           2.465053   0.105348    23.399       199    0.000
 For      SEX slope, B1
    INTRCPT2, G10           0.148397   0.033181     4.472      1195    0.000
 For  HIGHGPA slope, B2
    INTRCPT2, G20           0.085838   0.026778     3.206      1195    0.002
 For      JOB slope, B3
    INTRCPT2, G30          -0.161774   0.016276    -9.940      1195    0.000
 For     TIME slope, B4
    INTRCPT2, G40           0.103148   0.005508    18.726      1195    0.000
 ----------------------------------------------------------------------------

 Final estimation of variance components:
 -----------------------------------------------------------------------------
 Random Effect           Standard      Variance     df    Chi-square  P-value
                         Deviation     Component
 -----------------------------------------------------------------------------
 INTRCPT1,       U0        0.21391       0.04576   199    1187.22534    0.000
  level-1,       R         0.23583       0.05562
 -----------------------------------------------------------------------------

 Statistics for current covariance components model
 --------------------------------------------------
 Deviance                       = 294.544930
 Number of estimated parameters = 7
Part 2: The variable time is a random effect and compound symmetry is assumed.
 Sigma_squared =      0.04176
 Standard Error of Sigma_squared =      0.00209

 Tau
 INTRCPT1,B0      0.03897      -0.00256
     TIME,B4     -0.00256       0.00391

 Standard Errors of Tau
 INTRCPT1,B0      0.00618       0.00154
     TIME,B4      0.00154       0.00064

Tau (as correlations)
 INTRCPT1,B0  1.000 -0.208
     TIME,B4 -0.208  1.000
 ----------------------------------------------------
  Random level-1 coefficient   Reliability estimate
 ----------------------------------------------------
  INTRCPT1, B0                        0.640
      TIME, B4                        0.621
 ----------------------------------------------------
 Final estimation of fixed effects:
 ----------------------------------------------------------------------------
                                       Standard             Approx.
    Fixed Effect         Coefficient   Error      T-ratio   d.f.     P-value
 ----------------------------------------------------------------------------
 For       INTRCPT1, B0
    INTRCPT2, G00           2.410526   0.105075    22.941       199    0.000
 For      SEX slope, B1
    INTRCPT2, G10           0.116761   0.031532     3.703      1195    0.000
 For  HIGHGPA slope, B2
    INTRCPT2, G20           0.089835   0.026475     3.393      1195    0.001
 For      JOB slope, B3
    INTRCPT2, G30          -0.119622   0.017458    -6.852      1195    0.000
 For     TIME slope, B4
    INTRCPT2, G40           0.103973   0.005622    18.493       199    0.000
 ----------------------------------------------------------------------------
 Final estimation of fixed effects
 (with robust standard errors)
 ----------------------------------------------------------------------------
                                       Standard             Approx.
    Fixed Effect         Coefficient   Error      T-ratio   d.f.     P-value
 ----------------------------------------------------------------------------
 For       INTRCPT1, B0
    INTRCPT2, G00           2.410526   0.099711    24.175       199    0.000
 For      SEX slope, B1
    INTRCPT2, G10           0.116761   0.031292     3.731      1195    0.000
 For  HIGHGPA slope, B2
    INTRCPT2, G20           0.089835   0.024900     3.608      1195    0.001
 For      JOB slope, B3
    INTRCPT2, G30          -0.119622   0.015338    -7.799      1195    0.000
 For     TIME slope, B4
    INTRCPT2, G40           0.103973   0.005590    18.599       199    0.000
 ----------------------------------------------------------------------------

 Final estimation of variance components:
 -----------------------------------------------------------------------------
 Random Effect           Standard      Variance     df    Chi-square  P-value
                         Deviation     Component
 -----------------------------------------------------------------------------
 INTRCPT1,       U0        0.19741       0.03897   199     556.26173    0.000
     TIME slope, U4        0.06255       0.00391   199     527.84181    0.000
  level-1,       R         0.20436       0.04176
 -----------------------------------------------------------------------------

 Statistics for current covariance components model
 --------------------------------------------------
 Deviance                       = 180.204948
 Number of estimated parameters = 9
Part 3: The variable time is a fixed effect; MANOVA approach. HLM does not handle any model that does not have any random effect.