Table 6.1 on Thai educational data. This is a hierarchical generalized linear model. More precisely this is a logistic model. The setup of an SSM file is very similar to setting up an SSM file for a HLM model. We assume that an SSM file has been created and we have set up a model such as in the following screen shot.
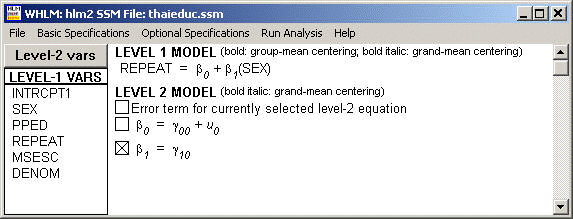
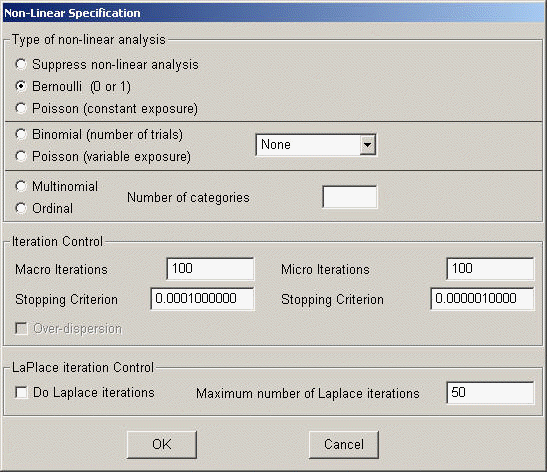
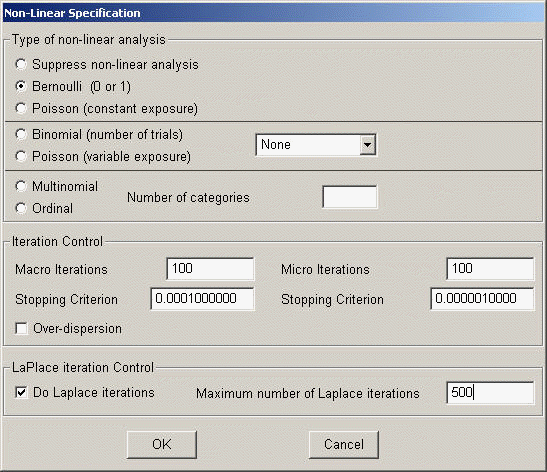
Method 1: The default estimation technique is PQL. We then set up the nonlinear part of the model. From Optional Specifications, select Setup Non-linear Model. Select Bernoulli from Type of non-linear analysis and leave other options unchanged.
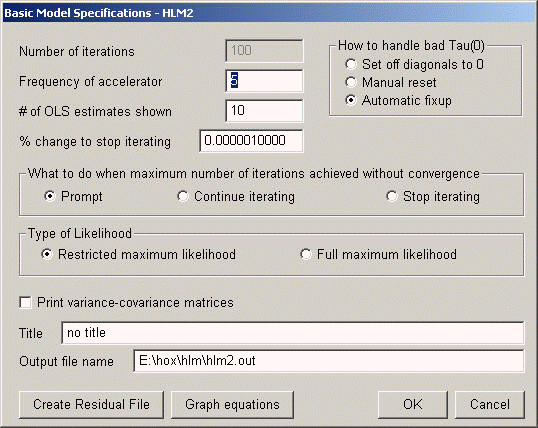
From Basic Specifications, select Restricted maximal likelihood estimation method.
RESULTS FOR NON-LINEAR MODEL WITH THE LOGIT LINK FUNCTION: Unit-Specific Model
(macro iteration 8)
 Tau
 INTRCPT1,B0      1.34611
Tau (as correlations)
 INTRCPT1,B0  1.000
 ----------------------------------------------------
  Random level-1 coefficient   Reliability estimate
 ----------------------------------------------------
  INTRCPT1, B0                        0.690
 ----------------------------------------------------
 Final estimation of fixed effects: (Unit-specific model)
 ----------------------------------------------------------------------------
                                       Standard             Approx.
    Fixed Effect         Coefficient   Error      T-ratio   d.f.     P-value
 ----------------------------------------------------------------------------
 For       INTRCPT1, B0
    INTRCPT2, G00          -2.316566   0.085600   -27.063       355    0.000
 For      SEX slope, B1
    INTRCPT2, G10           0.513746   0.073726     6.968      7514    0.000
 ----------------------------------------------------------------------------
 Final estimation of variance components:
 -----------------------------------------------------------------------------
 Random Effect           Standard      Variance     df    Chi-square  P-value
                         Deviation     Component
 -----------------------------------------------------------------------------
 INTRCPT1,       U0        1.16022       1.34611   355    1500.02535    0.000
 -----------------------------------------------------------------------------

RESULTS FOR NON-LINEAR MODEL WITH THE LOGIT LINK FUNCTION:
Population Average Model
 Final estimation of fixed effects: (Population-average model)
 ----------------------------------------------------------------------------
                                       Standard             Approx.
    Fixed Effect         Coefficient   Error      T-ratio   d.f.     P-value
 ----------------------------------------------------------------------------
 For       INTRCPT1, B0
    INTRCPT2, G00          -1.973530   0.079765   -24.742       355    0.000
 For      SEX slope, B1
    INTRCPT2, G10           0.449938   0.066668     6.749      7514    0.000
 ----------------------------------------------------------------------------
 Final estimation of fixed effects
 (Population-average model with robust standard errors)
 ----------------------------------------------------------------------------
                                       Standard             Approx.
    Fixed Effect         Coefficient   Error      T-ratio   d.f.     P-value
 ----------------------------------------------------------------------------
 For       INTRCPT1, B0
    INTRCPT2, G00          -1.973530   0.073613   -26.810       355    0.000
 For      SEX slope, B1
    INTRCPT2, G10           0.449938   0.062526     7.196      7514    0.000
 ----------------------------------------------------------------------------
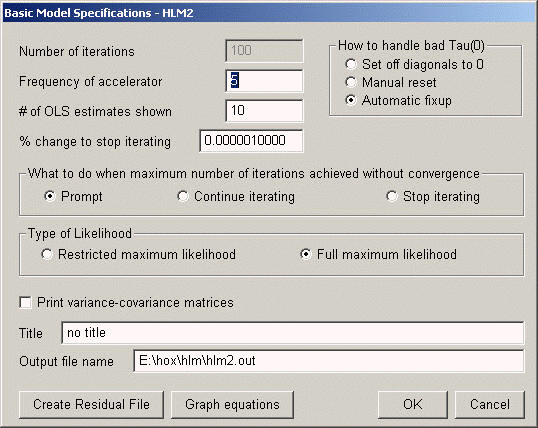
Method 2: Numerical integration technique. First of all, we select Full maximum likelihood as the type of likelihood to be estimated.
Then from the Optional Specifications-> Non-Linear Specifications, we check Laplace iteration control and set the maximum number of Laplace iterations to be 500 (rather arbitrary).
RESULTS FOR NON-LINEAR MODEL WITH THE LOGIT LINK FUNCTION: Unit-Specific Model
(macro iteration 8)
 Tau
 INTRCPT1,B0      1.33954
 Standard Errors of Tau
 INTRCPT1,B0      0.14285
Tau (as correlations)
 INTRCPT1,B0  1.000
 ----------------------------------------------------
  Random level-1 coefficient   Reliability estimate
 ----------------------------------------------------
  INTRCPT1, B0                        0.689
 ----------------------------------------------------
The value of the likelihood function at iteration 2 = -9.989744E+003

Final estimation of fixed effects: (Unit-specific model)
 ----------------------------------------------------------------------------
                                       Standard             Approx.
    Fixed Effect         Coefficient   Error      T-ratio   d.f.     P-value
 ----------------------------------------------------------------------------
 For       INTRCPT1, B0
    INTRCPT2, G00          -2.315749   0.085475   -27.093       355    0.000
 For      SEX slope, B1
    INTRCPT2, G10           0.513587   0.073714     6.967      7514    0.000
 ----------------------------------------------------------------------------
 Final estimation of variance components:
 -----------------------------------------------------------------------------
 Random Effect           Standard      Variance     df    Chi-square  P-value
                         Deviation     Component
 -----------------------------------------------------------------------------
 INTRCPT1,       U0        1.15738       1.33954   355    1499.52421    0.000
 -----------------------------------------------------------------------------

RESULTS FOR LAPLACE-6 ITERATION 5
 Tau
 INTRCPT1,B0      1.76868
 Standard Errors of Tau
 INTRCPT1,B0      0.22436
Tau (as correlations)
 INTRCPT1,B0  1.000
 ----------------------------------------------------
  Random level-1 coefficient   Reliability estimate
 ----------------------------------------------------
  INTRCPT1, B0                        0.741
 ----------------------------------------------------
 Final estimation of fixed effects
 (Laplace)
 ----------------------------------------------------------------------------
                                       Standard             Approx.
    Fixed Effect         Coefficient   Error      T-ratio   d.f.     P-value
 ----------------------------------------------------------------------------
 For       INTRCPT1, B0
    INTRCPT2, G00          -2.531153   0.097787   -25.884       355    0.000
 For      SEX slope, B1
    INTRCPT2, G10           0.541209   0.071905     7.527      7514    0.000
 ----------------------------------------------------------------------------
 Statistics for current covariance components model
 --------------------------------------------------
 Deviance                       = 19298.160494
 Number of estimated parameters = 3

RESULTS FOR NON-LINEAR MODEL WITH THE LOGIT LINK FUNCTION:
Population Average Model
 Final estimation of fixed effects: (Population-average model)
 ----------------------------------------------------------------------------
                                       Standard             Approx.
    Fixed Effect         Coefficient   Error      T-ratio   d.f.     P-value
 ----------------------------------------------------------------------------
 For       INTRCPT1, B0
    INTRCPT2, G00          -1.971750   0.087861   -22.442       355    0.000
 For      SEX slope, B1
    INTRCPT2, G10           0.452572   0.068658     6.592      7514    0.000
 ----------------------------------------------------------------------------
 Final estimation of fixed effects
 (Population-average model with robust standard errors)
 ----------------------------------------------------------------------------
                                       Standard             Approx.
    Fixed Effect         Coefficient   Error      T-ratio   d.f.     P-value
 ----------------------------------------------------------------------------
 For       INTRCPT1, B0
    INTRCPT2, G00          -1.971750   0.078327   -25.173       355    0.000
 For      SEX slope, B1
    INTRCPT2, G10           0.452572   0.066032     6.854      7514    0.000
 ----------------------------------------------------------------------------
Table 6.2 on page 116.
