HLM Textbook Examples
Multilevel Analysis by Tom Snijders and Roel Bosker
Chapter 5: The Hierarchical Linear Model
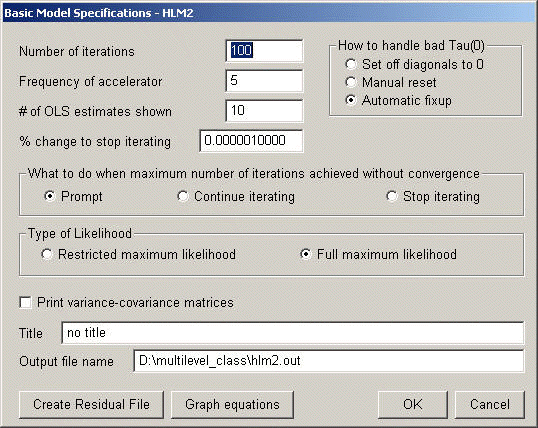
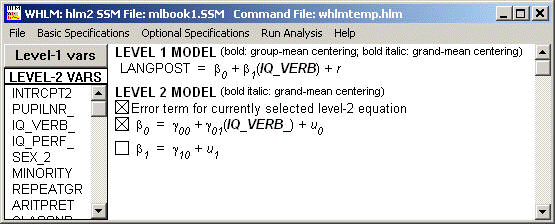
Example 5.1 on page 70-71 using https://stats.idre.ucla.edu/wp-content/uploads/2016/02/mlbook1.ssm. We use full maximum likelihood estimation method for this example. From Basic Model Specifications menu, choose Full maximum likelihood.

Level-1 variable IQ_VERB is entered as grand-mean centered. Level-2 variable IQ_VERB_ (which is the group mean of IQ_VERB) then is entered as grand-mean centered.

 Tau
 INTRCPT1,B0      7.91743      -0.82068
  IQ_VERB,B1     -0.82068       0.20026

 Standard Errors of Tau
 INTRCPT1,B0      1.31508       0.26744
  IQ_VERB,B1      0.26744       0.09832

Tau (as correlations)
 INTRCPT1,B0  1.000 -0.652
  IQ_VERB,B1 -0.652  1.000

 ----------------------------------------------------
  Random level-1 coefficient   Reliability estimate
 ----------------------------------------------------
  INTRCPT1, B0                        0.698
   IQ_VERB, B1                        0.217
 ----------------------------------------------------

The value of the likelihood function at iteration 10 = -7.605849E+003
 The outcome variable is LANGPOST

 Final estimation of fixed effects:
 ----------------------------------------------------------------------------
                                       Standard             Approx.
    Fixed Effect         Coefficient   Error      T-ratio   d.f.     P-value
 ----------------------------------------------------------------------------
 For       INTRCPT1, B0
    INTRCPT2, G00          40.571236   0.287602   141.067       129    0.000
    IQ_VERB_, G01           1.402053   0.321215     4.365       129    0.000
 For  IQ_VERB slope, B1
    INTRCPT2, G10           2.458424   0.082982    29.626       130    0.000
 ----------------------------------------------------------------------------

 The outcome variable is LANGPOST

 Final estimation of fixed effects
 (with robust standard errors)
 ----------------------------------------------------------------------------
                                       Standard             Approx.
    Fixed Effect         Coefficient   Error      T-ratio   d.f.     P-value
 ----------------------------------------------------------------------------
 For       INTRCPT1, B0
    INTRCPT2, G00          40.571236   0.286613   141.554       129    0.000
    IQ_VERB_, G01           1.402053   0.343986     4.076       129    0.000
 For  IQ_VERB slope, B1
    INTRCPT2, G10           2.458424   0.086208    28.517       130    0.000
 ---------------------------------------------------------------------------

 Final estimation of variance components:
 -----------------------------------------------------------------------------
 Random Effect           Standard      Variance     df    Chi-square  P-value
                         Deviation     Component
 -----------------------------------------------------------------------------
 INTRCPT1,       U0        2.81379       7.91743   129     526.93537    0.000
  IQ_VERB slope, U1        0.44751       0.20026   130     181.67794    0.002
  level-1,       R         6.43042      41.35027
 -----------------------------------------------------------------------------

 Statistics for current covariance components model
 --------------------------------------------------
 Deviance                       = 15211.697947
 Number of estimated parameters = 7
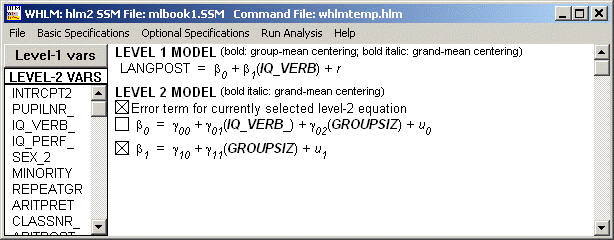
Example 5.2 on page 75. Based on the model above, level-2 variable GROUPSIZ is entered as grand-mean centered.

 Sigma_squared =     41.31530

 Standard Error of Sigma_squared =      1.28611

 Tau
 INTRCPT1,B0      7.66911      -0.77447
  IQ_VERB,B1     -0.77447       0.17972

 Standard Errors of Tau
 INTRCPT1,B0      1.28283       0.25936
  IQ_VERB,B1      0.25936       0.09512

Tau (as correlations)
 INTRCPT1,B0  1.000 -0.660
  IQ_VERB,B1 -0.660  1.000

 ----------------------------------------------------
  Random level-1 coefficient   Reliability estimate
 ----------------------------------------------------
  INTRCPT1, B0                        0.692
   IQ_VERB, B1                        0.200
 ----------------------------------------------------

The value of the likelihood function at iteration 12 = -7.602153E+003
 The outcome variable is LANGPOST

 Final estimation of fixed effects:
 ----------------------------------------------------------------------------
                                       Standard             Approx.
    Fixed Effect         Coefficient   Error      T-ratio   d.f.     P-value
 ----------------------------------------------------------------------------
 For       INTRCPT1, B0
    INTRCPT2, G00          40.567658   0.286348   141.672       128    0.000
    IQ_VERB_, G01           1.210282   0.326194     3.710       128    0.000
    GROUPSIZ, G02           0.072898   0.038028     1.917       128    0.055
 For  IQ_VERB slope, B1
    INTRCPT2, G10           2.513627   0.087337    28.781       129    0.000
    GROUPSIZ, G11          -0.025716   0.011032    -2.331       129    0.020
 ----------------------------------------------------------------------------

 The outcome variable is LANGPOST

 Final estimation of fixed effects
 (with robust standard errors)
 ----------------------------------------------------------------------------
                                       Standard             Approx.
    Fixed Effect         Coefficient   Error      T-ratio   d.f.     P-value
 ----------------------------------------------------------------------------
 For       INTRCPT1, B0
    INTRCPT2, G00          40.567658   0.282597   143.553       128    0.000
    IQ_VERB_, G01           1.210282   0.347659     3.481       128    0.001
    GROUPSIZ, G02           0.072898   0.038695     1.884       128    0.059
 For  IQ_VERB slope, B1
    INTRCPT2, G10           2.513627   0.094786    26.519       129    0.000
    GROUPSIZ, G11          -0.025716   0.011874    -2.166       129    0.030
 ----------------------------------------------------------------------------

 Final estimation of variance components:
 -----------------------------------------------------------------------------
 Random Effect           Standard      Variance     df    Chi-square  P-value
                         Deviation     Component
 -----------------------------------------------------------------------------
 INTRCPT1,       U0        2.76932       7.66911   128     516.08521    0.000
  IQ_VERB slope, U1        0.42394       0.17972   129     176.51886    0.004
  level-1,       R         6.42770      41.31530
 -----------------------------------------------------------------------------

 Statistics for current covariance components model
 --------------------------------------------------
 Deviance                       = 15204.305563
 Number of estimated parameters = 9
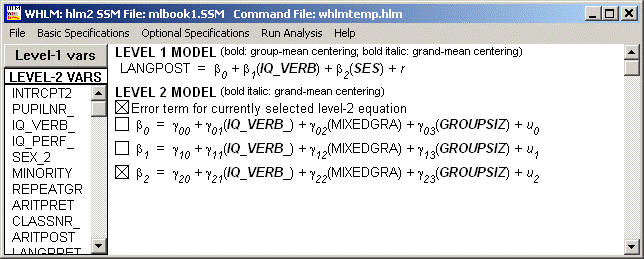
Example 5.3 on page 76, an extension of previous model. All variables except level-2 variable MIXEDGRD are entered as grand-mean centered. We didn’t constrain the covariance between u_1 and u_2.

Sigma_squared =     38.99286

 Standard Error of Sigma_squared =      1.23538

 Tau
 INTRCPT1,B0      7.38326      -0.60748      -0.00614
  IQ_VERB,B1     -0.60748       0.18584      -0.01634
      SES,B2     -0.00614      -0.01634       0.00223

 Standard Errors of Tau
 INTRCPT1,B0      1.23567       0.25611       0.04530
  IQ_VERB,B1      0.25611       0.09926       0.01393
      SES,B2      0.04530       0.01393       0.00327

Tau (as correlations)
 INTRCPT1,B0  1.000 -0.519 -0.048
  IQ_VERB,B1 -0.519  1.000 -0.803
      SES,B2 -0.048 -0.803  1.000

 ----------------------------------------------------
  Random level-1 coefficient   Reliability estimate
 ----------------------------------------------------
  INTRCPT1, B0                        0.606
   IQ_VERB, B1                        0.190
       SES, B2                        0.062
 ----------------------------------------------------

Note: The reliability estimates reported above are based on only 130 of 131
units that had sufficient data for computation.  Fixed effects and variance
components are based on all the data.

The value of the likelihood function at iteration 840 = -7.540441E+003
 The outcome variable is LANGPOST

 Final estimation of fixed effects:
 ----------------------------------------------------------------------------
                                       Standard             Approx.
    Fixed Effect         Coefficient   Error      T-ratio   d.f.     P-value
 ----------------------------------------------------------------------------
 For       INTRCPT1, B0
    INTRCPT2, G00          41.601726   0.434270    95.797       127    0.000
    IQ_VERB_, G01           0.770318   0.324693     2.372       127    0.018
    MIXEDGRA, G02          -2.065145   0.798976    -2.585       127    0.010
    GROUPSIZ, G03          -0.042985   0.051037    -0.842       127    0.400
 For  IQ_VERB slope, B1
    INTRCPT2, G10           2.138082   0.132861    16.093       127    0.000
    IQ_VERB_, G11          -0.031304   0.086105    -0.364       127    0.716
    MIXEDGRA, G12           0.381452   0.253692     1.504       127    0.133
    GROUPSIZ, G13          -0.003052   0.015920    -0.192       127    0.848
 For      SES slope, B2
    INTRCPT2, G20           0.160610   0.026352     6.095       127    0.000
    IQ_VERB_, G21          -0.022374   0.019494    -1.148       127    0.252
    MIXEDGRA, G22           0.021394   0.047708     0.448       127    0.653
    GROUPSIZ, G23          -0.001202   0.003006    -0.400       127    0.689
 ----------------------------------------------------------------------------

 The outcome variable is LANGPOST

 Final estimation of fixed effects
 (with robust standard errors)
 ----------------------------------------------------------------------------
                                       Standard             Approx.
    Fixed Effect         Coefficient   Error      T-ratio   d.f.     P-value
 ----------------------------------------------------------------------------
 For       INTRCPT1, B0
    INTRCPT2, G00          41.601726   0.398354   104.434       127    0.000
    IQ_VERB_, G01           0.770318   0.317983     2.423       127    0.016
    MIXEDGRA, G02          -2.065145   0.835415    -2.472       127    0.014
    GROUPSIZ, G03          -0.042985   0.047773    -0.900       127    0.369
 For  IQ_VERB slope, B1
    INTRCPT2, G10           2.138082   0.108641    19.680       127    0.000
    IQ_VERB_, G11          -0.031304   0.104537    -0.299       127    0.764
    MIXEDGRA, G12           0.381452   0.210430     1.813       127    0.069
    GROUPSIZ, G13          -0.003052   0.013019    -0.234       127    0.815
 For      SES slope, B2
    INTRCPT2, G20           0.160610   0.022928     7.005       127    0.000
    IQ_VERB_, G21          -0.022374   0.018983    -1.179       127    0.239
    MIXEDGRA, G22           0.021394   0.045037     0.475       127    0.634
    GROUPSIZ, G23          -0.001202   0.002640    -0.455       127    0.648
 ----------------------------------------------------------------------------

 Final estimation of variance components:
 -----------------------------------------------------------------------------
 Random Effect           Standard      Variance     df    Chi-square  P-value
                         Deviation     Component
 -----------------------------------------------------------------------------
 INTRCPT1,       U0        2.71721       7.38326   126     442.91213    0.000
  IQ_VERB slope, U1        0.43109       0.18584   126     174.18563    0.003
      SES slope, U2        0.04721       0.00223   126     130.52808    0.373
  level-1,       R         6.24443      38.99286
 -----------------------------------------------------------------------------

Note: The chi-square statistics reported above are based on only 130 of 131
units that had sufficient data for computation.  Fixed effects and variance
components are based on all the data.

 Statistics for current covariance components model
 --------------------------------------------------
 Deviance                       = 15080.881187
 Number of estimated parameters = 19
