This FAQ considers how to interpret the coefficients from multilevel models when different kinds of centering are used. Although the examples are illustrated with HLM, these principles apply to multilevel models solved in any statistical package.
The data file for this example is made like this
use https://stats.idre.ucla.edu/stat/paperexamples/singer/hsb12 , clear
keep  school student ses mathach
* make ses uncentered with a mean of 12.5
generate sesu = ses + 12.5
egen meanses = mean(ses), by(school)
egen meansesu = mean(sesu), by(school)
hlm mkmdm using hsb12hlm, id2( school) l1( mathach ses sesu ) l2( meanses meansesu )  replace
You can download the MDM file here: hsb12hlm
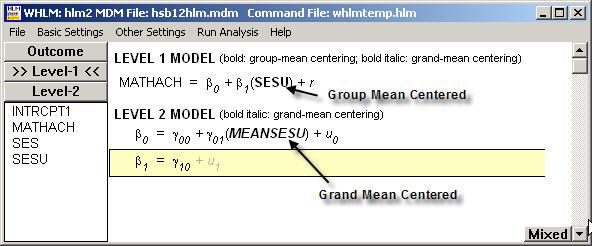
Model 1. SES Group mean centered at level 1, MeanSES Grand mean centered at level 2.
Consider this multilevel model where we are predicting math achievement (MATHACH) based on the student level SES (USES) that has been group mean centered at level 1 and school level average SES (MEANSES) that has been grand mean centered at level 2. This model is shown below.
MATHACHij = β0j + β1j (Group Mean Centered SES) + rij β0j = γ00 + γ01 (Grand Mean Centered Mean SES) + u0j β1j = γ10 + u1j
We can specify this in HLM like this.
When we run this in HLM using Maximum Likelihood Estimation, we get these results.
 Final estimation of fixed effects:
 ----------------------------------------------------------------------------
                                       Standard             Approx.
    Fixed Effect         Coefficient   Error      T-ratio   d.f.     P-value
 ----------------------------------------------------------------------------
 For       INTRCPT1, B0
    INTRCPT2, G00          12.647291   0.148414    85.216       158    0.000
    MEANSESU, G01           5.865601   0.359373    16.322       158    0.000
 For     SESU slope, B1
    INTRCPT2, G10           2.191172   0.108660    20.165      7182    0.000
 ----------------------------------------------------------------------------
In terms of the model, the results look like this.
MATHACHij = β0j + β1j (USES) + rij β0j = 12.64 + 5.86 (Grand Mean Centered Mean SES) + u0j β1j = 2.19
Interpretation. This decomposes the relationship between SES and MATCHACH into two components, the level 1 (within school) component and the level 2 (between school) component. At level 1, the regression coefficient is 2.19, meaning that for a one unit increase in a student’s SES, their math achievement would be predicted to increase by 2.19 units. The level 2 coefficient of 5.86 means that when the SES for a school increases by 1 unit, the school level math achievement would be expected to increase by 5.86 units.
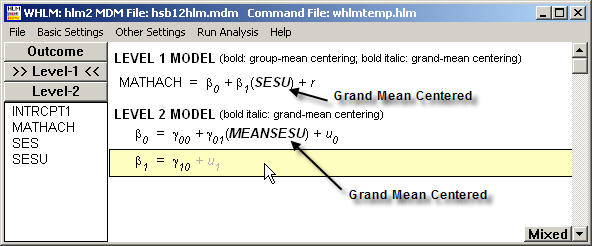
Model 2. SES Grand mean centered at level 1, MeanSES Grand mean centered at level 2.
Let’s now try this model where as compared to Model 1 SES was group mean centered it is now Grand Mean Centered. We continue to Grand mean center MEANSES at level 2.
MATHACHij = β0j + β1j (Grand Mean Centered SES) + rij β0j = γ00 + γ01 (Grand Mean Centered Mean SES) + u0j β1j = γ10
We can specify this in HLM like this.
When we run this in HLM using Maximum Likelihood Estimation, we get these results.
 Final estimation of fixed effects:
 ----------------------------------------------------------------------------
                                       Standard             Approx.
    Fixed Effect         Coefficient   Error      T-ratio   d.f.     P-value
 ----------------------------------------------------------------------------
 For       INTRCPT1, B0
    INTRCPT2, G00          12.661166   0.148416    85.309       158    0.000
    MEANSESU, G01           3.674429   0.375441     9.787       158    0.000
 For     SESU slope, B1
    INTRCPT2, G10           2.191172   0.108660    20.165      7182    0.000
 ----------------------------------------------------------------------------
In terms of the model, the results look like this.
MATHACHij = β0j + β1j (USES) + rij β0j = 12.66 + 3.67 (Grand Mean Centered Mean SES) + u0j β1j = 2.19
Interpretation. Like model 2, this decomposes the relationship between SES and MATCHACH into two components, the level 1 (within school) component and the level 2 (between school) component. Also, like model 2 the level 1 regression coefficient remains 2.19 with the same meaning. But, note how the coefficient associated with the grand mean centered SES has changed to 3.67. This value reflects the difference of the Between school regression coefficient for meanses minus the Within school regression coefficient for SES. Referring to the estimates from Model 2, 5.865601 – 2.191172 = 3.674429.
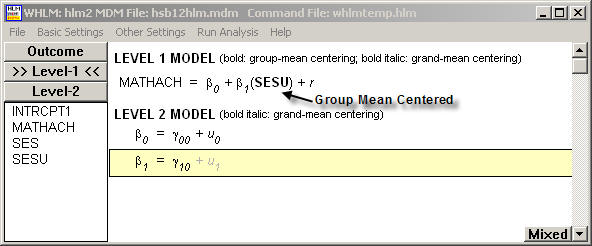
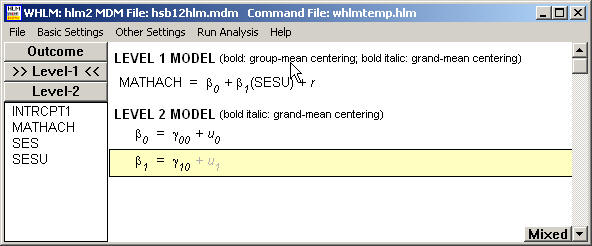
Model 3. Group Centered SES at level 1.
Suppose that we imagine that we are only concerned with the level 1 effect of SES (at the student level) and really do not care about the level 2 effect. We might construct a model like this to examine just the student level effect of SES.
MATHACHij = β0j + β1j (Group Centered SES) + rij β0j = γ00 + u0j β1j = γ10
We can specify this in HLM like this.
When we run this in HLM, we get these results.
 Final estimation of fixed effects:
 ----------------------------------------------------------------------------
                                       Standard             Approx.
    Fixed Effect         Coefficient   Error      T-ratio   d.f.     P-value
 ----------------------------------------------------------------------------
 For       INTRCPT1, B0
    INTRCPT2, G00          12.636226   0.243729    51.845       159    0.000
 For     SESU slope, B1
    INTRCPT2, G10           2.191172   0.108647    20.168      7183    0.000
 ----------------------------------------------------------------------------
In terms of the model, the results look like this.
MATHACHij = β0j + β1j (USES) + rij β0j = 12.63 + u0j β1j = 2.19 + u1j
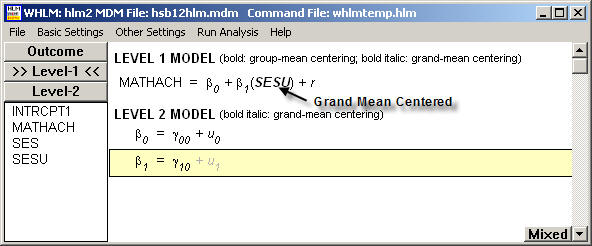
Model 4. Grand Mean Centered SES at level 1.
Suppose that we imagine that we are only concerned with the level 1 effect of SES (at the student level) and really do not care about the level 2 effect. We might construct a model like this to examine just the student level effect of SES.
MATHACHij = β0j + β1j (Uncentered SES) + rij β0j = γ00 + u0j β1j = γ10
We can specify this in HLM like this.
When we run this in HLM, we get these results.
 Final estimation of fixed effects:
 ----------------------------------------------------------------------------
                                       Standard             Approx.
    Fixed Effect         Coefficient   Error      T-ratio   d.f.     P-value
 ----------------------------------------------------------------------------
 For       INTRCPT1, B0
    INTRCPT2, G00          12.657979   0.187263    67.595       159    0.000
 For     SESU slope, B1
    INTRCPT2, G10           2.391617   0.105691    22.628      7183    0.000
 ----------------------------------------------------------------------------
In terms of the model, the results look like this.
MATHACHij = β0j + β1j (USES) + rij β0j = 12.65 + u0j β1j = 2.39 + u1j
Model 5. Uncentered SES at level 1.
Suppose that we imagine that we are only concerned with the level 1 effect of SES (at the student level) and really do not care about the level 2 effect. We might construct a model like this to examine just the student level effect of SES.
MATHACHij = β0j + β1j (Uncentered SES) + rij β0j = γ00 + u0j β1j = γ10
We can specify this in HLM like this.
When we run this in HLM, we get these results.
 Final estimation of fixed effects:
 ----------------------------------------------------------------------------
                                       Standard             Approx.
    Fixed Effect         Coefficient   Error      T-ratio   d.f.     P-value
 ----------------------------------------------------------------------------
 For       INTRCPT1, B0
    INTRCPT2, G00         -17.237571   1.333826   -12.923       159    0.000
 For     SESU slope, B1
    INTRCPT2, G10           2.391617   0.105691    22.628      7183    0.000
 ----------------------------------------------------------------------------
In terms of the model, the results look like this.
MATHACHij = β0j + β1j (USES) + rij β0j = -17.23 + u0j β1j = 2.39 + u1j