Excel is not a statistical package. Despite this, Excel is likely the software most often used for data analysis. So, even though we do not advocate its use, here are some Excel tips. We offer these tips in the hopes that they make it easy to move your data out of Excel and into a statistical package appropriate to your analysis. Hopefully, you will find them worthwhile, even if only in a "know thine enemy" kind of way.
Looking at Data in Excel: Freeze Panes, Splits, and Hides
Excel has rows and columns, not variables. If your variables have names other than the column headings (A, B, C), you are not able to see the names as you scroll through your data. Nor can you easily look at more than about 50 consecutive rows and 15 consecutive columns at a time. However, Excel does include options that make it easier to view your data as you wish to view it.
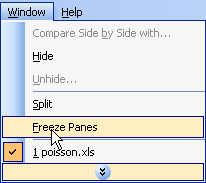
Freeze Pane allows you to pick a cell and freeze the rows above the cell and the columns to the left of the cell. Then, you can see row headings while scrolling down and row IDs as you scroll across your dataset. You can also use Freeze Panes if you wish to have certain columns or rows side by side for easy comparison, even though the columns or rows are not side by side in your dataset.
To use Freeze Panes, select it from the Window drop-down list. To unfreeze panes, select Unfreeze Panes from the same list.
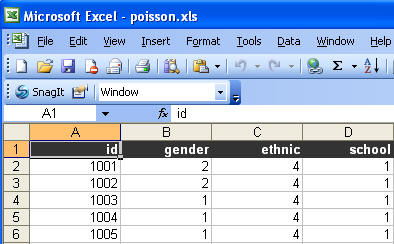
Split is a similar command. It divides your Excel window into four parts, and you can scroll down or across two of the four parts at a time. To split your spreadsheet, select a cell and choose Split from the Window drop down.
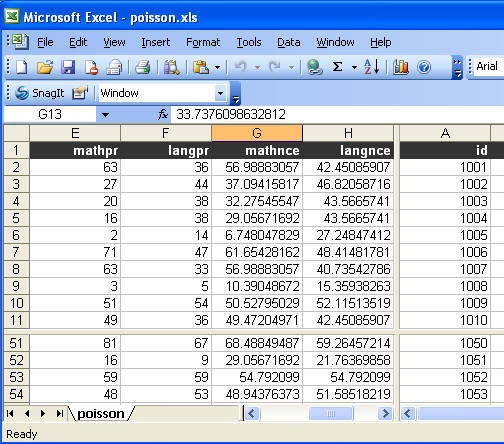
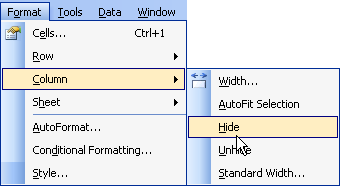
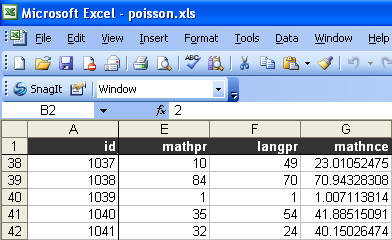
Another option that can make viewing data in Excel easier is the Hide option for rows and columns. Simply select any rows or columns that are, for the time being, getting in the way. Then choose Row or Column from the Format menu, and select Hide.
Very Special Pasting
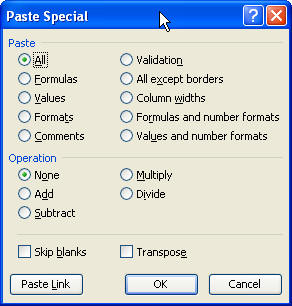
A surprising number of Excel’s more subtle tricks use the Paste Special option after "copying" data. In Excel, if you wish to use a formula or a format from a certain cell repeatedly, you can do so using Copy and Paste Special. If you’ve calculated values using a formula, and you want to copy the values (and not the formulas) into other cells, you can use Paste Special. Paste Special can even be used to transpose data or (in a weird, way) apply mathematical operations to a set of cells.
The full set of options can be seen by selecting Paste Special from the Edit menu after selecting and copying cells.

Subsetting in Excel: Data Filtering
AutoFilter is a function that allows you to view and subset your data easily and quickly without making any permanent changes to your data. You can filter your data by selecting your worksheet or the portion of your worksheet of interest. The first row is assumed to contain headers, and drop-down menus are created for each column containing the values within the column. Using these menus you can temporarily subset your data. There are options that allow for somewhat complex filtering.
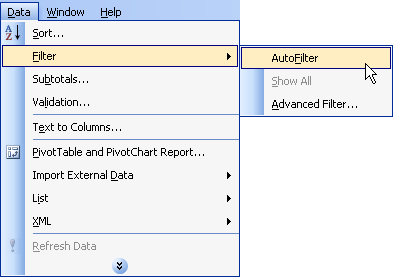
To filter your data in this way, choose Filter, then AutoFilter from the Data menu.
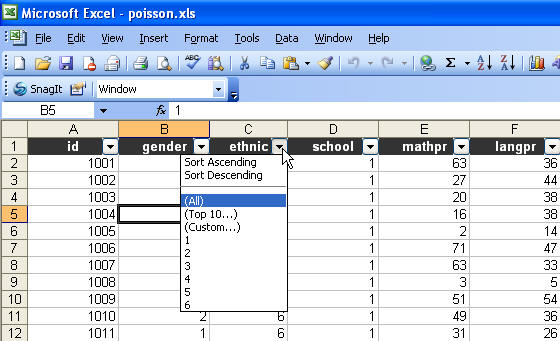
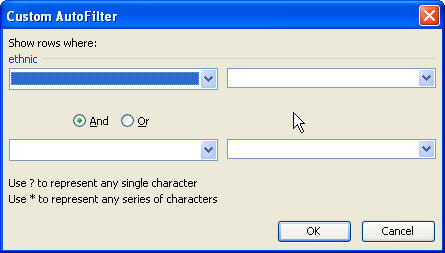
AutoFilter is also a useful tool for: identifying outliers or invalid values in certain variables, finding "subtotal" rows that may have been inserted into a long dataset, identifying the most common values that appear in a given column, identifying missing values.
User Written Formulas and Excel Functions
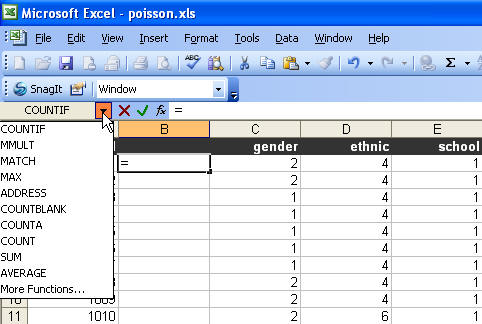
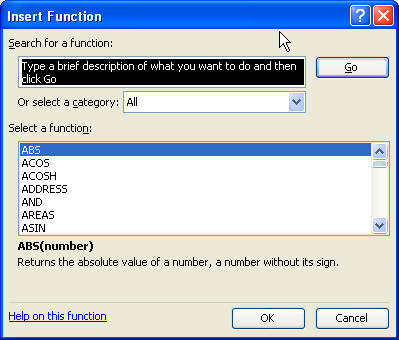
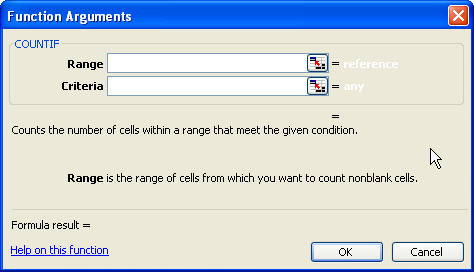
If you wish to create a new variable, conduct a check of an existing variable, or do any calculations based on other cells in Excel, you will find yourself writing formulas, using Excel functions, or doing both at once. To start, type "=" into a cell. This is necessary to tell Excel that you will be entering a formula or a function. You can type in a formula, referring to other cells by their column/row coordinate (A3, for example) and making use of Excels built in functions. These are worth exploring. Some are more useful than others. The Count functions are particularly nice.
"Programming" in Excel
If there is something that you will need to do repeatedly in Excel, it is possible to save these steps in a macro to be used as needed. For instance, you may want to use the same specific formatting for all tables you create in Excel with certain information in the header and footer above and below the table. The easiest way to create a macro in Excel is to select Macro from the Tools menu, and then Record New Macro. Once you’ve started "recording", execute the steps that you want tracked and will want to be repeated. When you’re done, click on the Stop Recording button on the macro window on the screen.
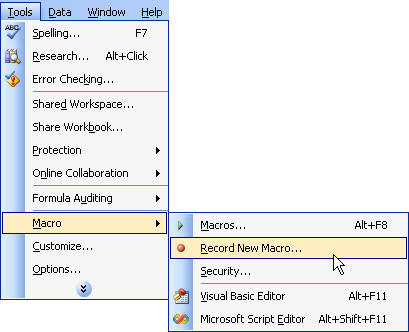
This might be useful if you have data arranged in strange, but consistent, ways and you need to put you data into a more comprehensible form.
Separating Variables in Excel
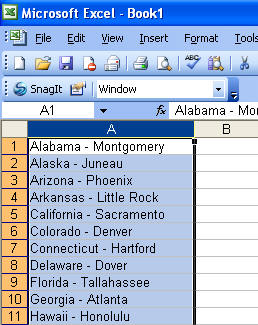
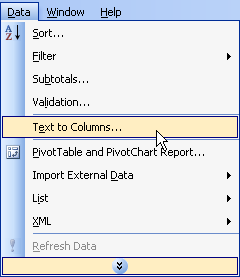
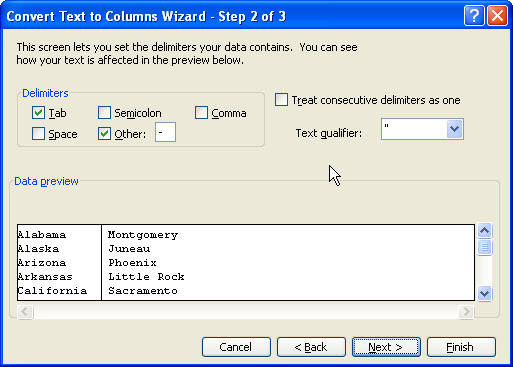
A common issue in Excel seems to be multiple variables in one column. Perhaps the best way to address this is the Text to Columns function. This allows you to specify how you would like to divide the contents in a given cell into multiple cells, and previews how your splitting strategy will work. This function can be found under the Data menu.
Common Problems in Excel
Assuming that we are looking at Excel primarily as a data vessel, ultimately aiming to get the data out of Excel and into a package appropriate for the given analysis, there are some common obstacles to moving data cleanly out of Excel.
1. Subtotal Rows – Excel makes it very easy to add subtotal rows to a dataset: sort on one variable, and then add a line between group breaks with subtotals. While this may be very useful for checking your data, it adds some very strange-looking observations to your dataset that can skew your analysis if they are not recognized and removed. If you are looking at an original dataset that has not been copied and pasted and passed around, these can be removed by selecting Data, then Subtotals, and then clicking the Remove All button. If you are not sure you are looking at the original dataset, AutoFilter can be good for finding such lines.
2. Pivot Tables – These are commonly used to summarize data. They are never a good thing when you are interested in transferring data from Excel to another package. If you are aiming to transfer data from Excel to another package, you will want the information that underlies the pivot table rather than the pivot table. This underlying data is usually in another tab in the same workbook.
3. Grand Totals – This is another variety of summary row that can look, at a glance, like another observation, but can have huge, misleading effects on results.
4. Data on Multiple Tabs – There are copy and paste methods and macro methods that are not perfect, but will often work. Using StatTransfer, it is likely easier to export each tab as a seperate dataset and then stack/merge them in SAS/Stata/SPSS. Before doing this, however, it is worth making sure that all of the worksheets in your file have the same column formatting. This can be done by formatting one worksheet in the way you would like to see on all others, and then using Paste Special to paste the formatting into all the other worksheets.
5. Bad Variable Names – Excel does not impose any rules on the text in a cell, so often the header row that one would like to use as the variable names contains spaces or names that begin with numbers that will be invalid in a statistical software. Spaces in the names can be removed with a find/replace on the header row.

