Version info: Code for this page was tested in R Under development (unstable) (2012-07-05 r59734)

 On: 2012-08-08

With: knitr 0.6.3
R allows users great flexibility in creating and formatting plots. Greek
letters can be included in titles and labels using the expression
command.
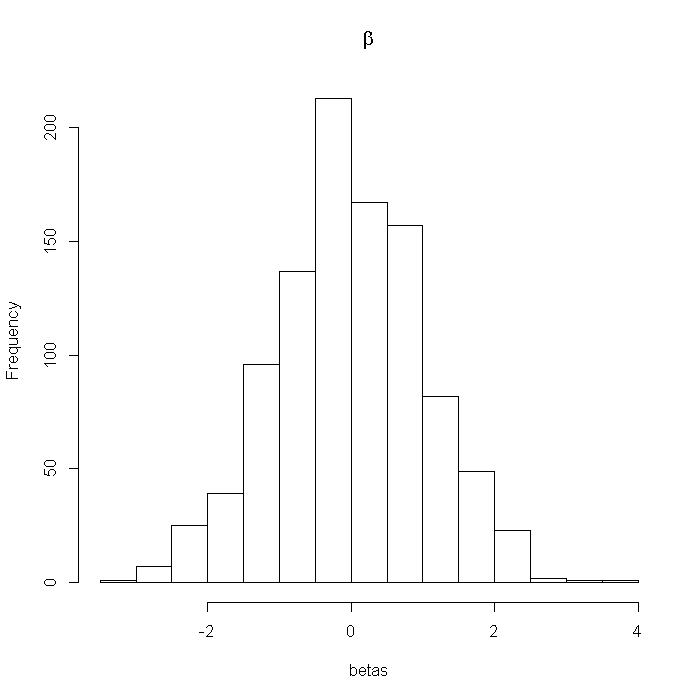
# Example 1
set.seed(1)  # for reproducible, pseudo-random numbers
betas <- rnorm(1000)
hist(betas, main = expression(beta))
If we want Greek letters embedded in the text of a title or label, we can use
expression with paste:
# Example 2
h <- rnorm(mean = 5, sd = 1, n = 1000)
hist(h, main = expression(paste("Sampled values, ", mu, "=5, ", sigma,
    "=1")))

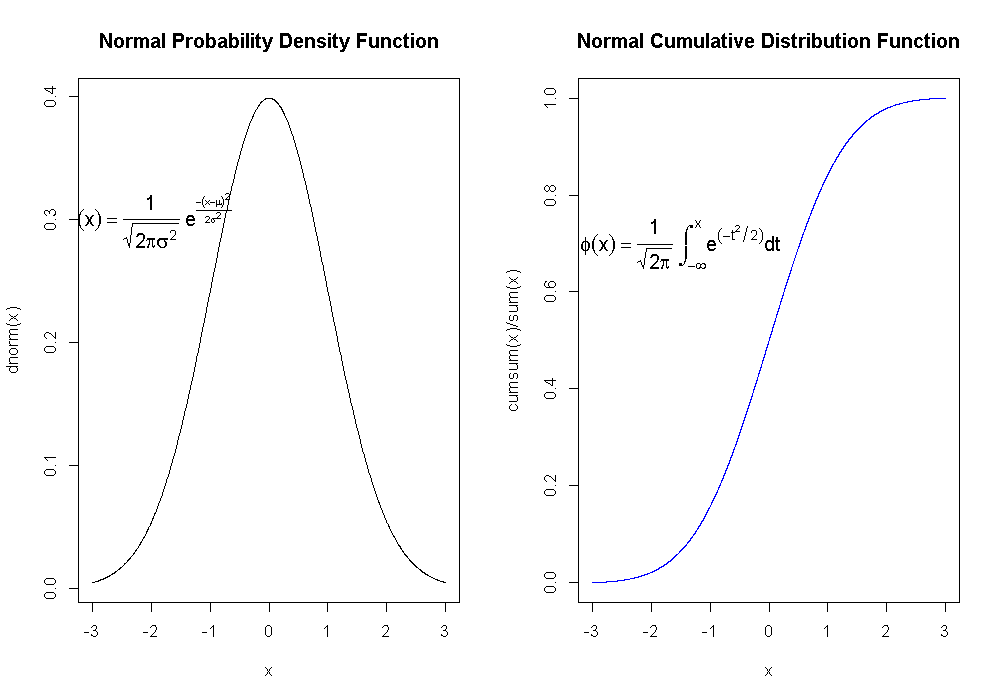
par(mfrow = c(1, 2))
curve(dnorm, from = -3, to = 3, n = 1000, main = "Normal Probability Density Function")
text(-2, 0.3, expression(f(x) == paste(frac(1, sqrt(2 * pi * sigma^2)),
    " ", e^{
        frac(-(x - mu)^2, 2 * sigma^2)
    })), cex = 1.2)
x <- dnorm(seq(-3, 3, 0.001))
plot(seq(-3, 3, 0.001), cumsum(x)/sum(x), type = "l", col = "blue",
    xlab = "x", main = "Normal Cumulative Distribution Function")
text(-1.5, 0.7, expression(phi(x) == paste(frac(1, sqrt(2 * pi)),
    " ", integral(e^(-t^2/2) * dt, -infinity, x))), cex = 1.2)