R Textbook Examples Applied Longitudinal Data Analysis: Modeling Change and Event Occurrence by Judith D. Singer and John B. Willett Chapter 10: Describing Discrete-time Event Occurrence Data
The examples on the page were written in R version 2.4.1. This page requires package survival.
library(survival)
Table 10.1 on page 327.
teachers<-read.table("https://stats.idre.ucla.edu/stat/examples/alda/teachers.csv", sep=",", header=T)
ts <- survfit( Surv(t, 1-censor)~ 1, conf.type="none", data=teachers)
h<-ts$n.event/ts$n.risk
nlost<-ts$n.risk-ts$n.event- ts$n.risk[-1]
nlost[12] = ts$n.risk[12]-ts$n.event[12]
tab10.1<-cbind(time=ts$time, risk=ts$n.risk, left=ts$n.event, censored=nlost, hazard=h, survival=ts$surv)
tab10.1
      time risk left censored     hazard  survival
 [1,]    1 3941  456        0 0.11570667 0.8842933
 [2,]    2 3485  384        0 0.11018651 0.7868561
 [3,]    3 3101  359        0 0.11576911 0.6957625
 [4,]    4 2742  295        0 0.10758570 0.6209084
 [5,]    5 2447  218        0 0.08908868 0.5655925
 [6,]    6 2229  184        0 0.08254823 0.5189038
 [7,]    7 2045  123      280 0.06014670 0.4876935
 [8,]    8 1642   79      307 0.04811206 0.4642295
 [9,]    9 1256   53      255 0.04219745 0.4446402
[10,]   10  948   35      265 0.03691983 0.4282242
[11,]   11  648   16      241 0.02469136 0.4176508
[12,]   12  391    5      386 0.01278772 0.4123100
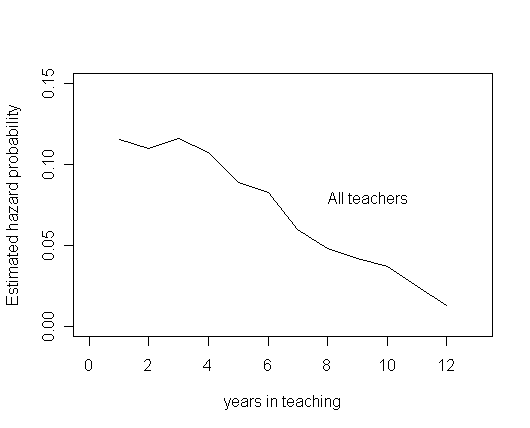
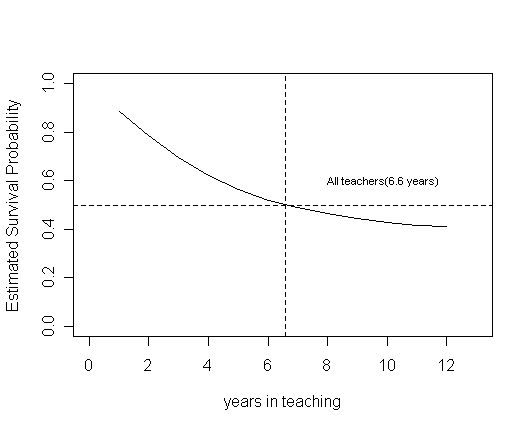
Figure 10.1, page 333.
plot(ts$time, h, type="l", ylab="Estimated hazard probability", xlab="years in teaching",
     ylim=c(0, .15), xlim=c(0, 13))
text(8, .08, "All teachers", adj=0)
plot(ts$time, ts$surv, type="l", ylab="Estimated Survival Probability", xlab="years in teaching",
     ylim=c(0, 1.), xlim=c(0, 13))
abline(h=c(.5), lty=2)
abline(v=c(6.6), lty=2)
text(8, .6, "All teachers(6.6 years)", adj=0, cex=.7)
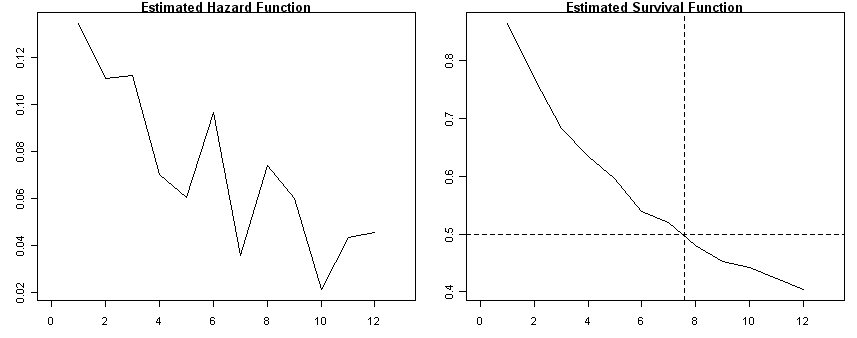
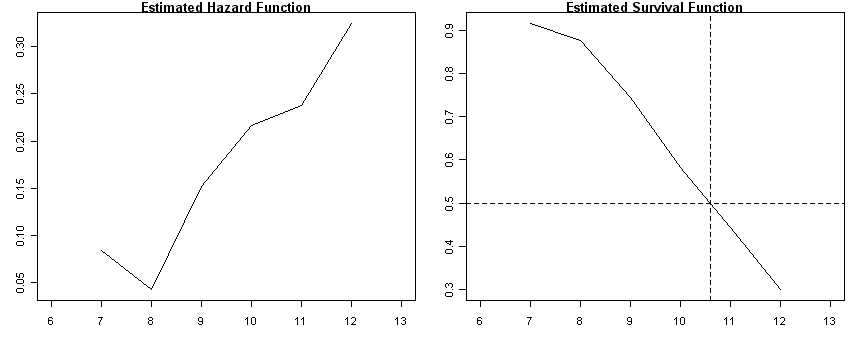
Fig. 10.2, page 340
par(mfrow=c(1, 2), cex=0.7)

# Panel A
cocaine<-read.table("https://stats.idre.ucla.edu/stat/examples/alda/cocaine_relapse.csv", sep=",", header=T)
ts <- survfit( Surv(week, 1-censor)~ 1, conf.type="none", data=cocaine)
h<-ts$n.event/ts$n.risk

plot(ts$time, h, type="l", ylab=" ", main="Estimated Hazard Function", xlim=c(0, 13))
plot(ts$time, ts$surv, type="l", ylab=" ", main="Estimated Survival Function", xlim=c(0, 13))
abline(h=c(.5), lty=2)
abline(v=c(7.6), lty=2)
# panel B

firstsex<-read.table("https://stats.idre.ucla.edu/stat/examples/alda/firstsex.csv", sep=",", header=T)
ts <- survfit( Surv(time, 1-censor)~ 1, conf.type="none", data=firstsex)
h<-ts$n.event/ts$n.risk

plot(ts$time, h, type="l", ylab=" ", main="Estimated Hazard Function", xlim=c(6, 13))
plot(ts$time, ts$surv, type="l", ylab=" ", main="Estimated Survival Function",  xlim=c(6, 13))
abline(h=c(.5), lty=2)
abline(v=c(10.6), lty=2)
# panel C
rm(list=ls())
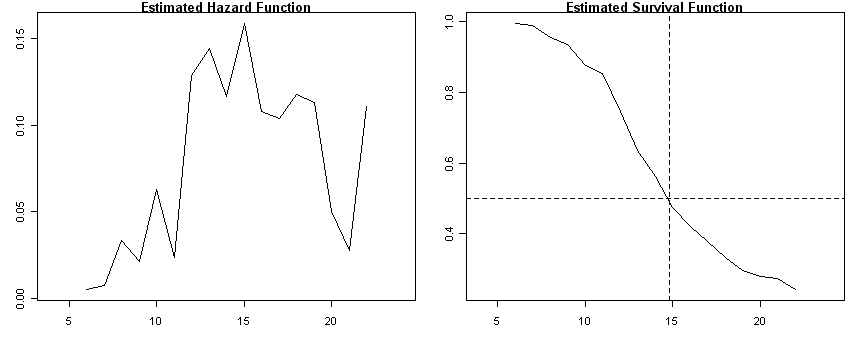
suicide<-read.table("https://stats.idre.ucla.edu/stat/examples/alda/suicide.csv", sep=",", header=T)
ts <- survfit( Surv(time, 1-censor)~ 1, conf.type="none", data=suicide)
h<-ts$n.event/ts$n.risk

plot(ts$time, h, type="l", ylab=" ", main="Estimated Hazard Function", xlim=c(4, 24))
plot(ts$time, ts$surv, type="l", ylab=" ", main="Estimated Survival Function",  xlim=c(4, 24))
abline(h=c(.5), lty=2)
abline(v=c(14.8), lty=2)
# panel D
congress<-read.table("https://stats.idre.ucla.edu/stat/examples/alda/congress.csv", sep=",", header=T)
ts <- survfit( Surv(time, 1-censor)~ 1, conf.type="none", data=congress)
h<-ts$n.event/ts$n.risk

plot(ts$time, h, type="l", ylab=" ", main="Estimated Hazard Function", xlim=c(0,8))
plot(ts$time, ts$surv, type="l", ylab=" ", main="Estimated Survival Function",  xlim=c(0,8))
abline(h=c(.5), lty=2)
abline(v=c(3.5), lty=2)
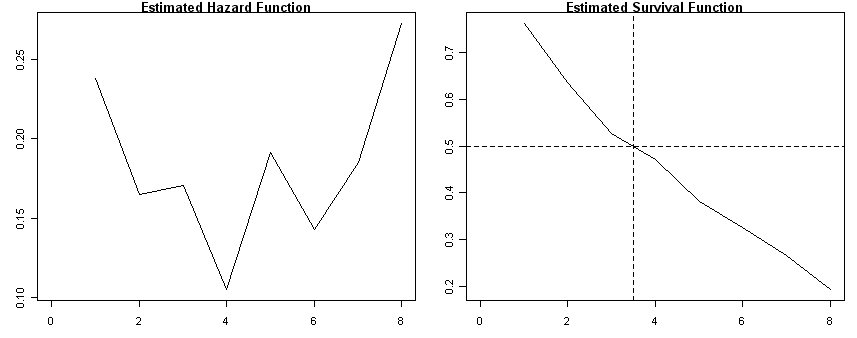
Table 10.2 on page 349. The middle column for the survival function is based on the formula (10.8) on page 350.
rm(list=ls())
teachers<-read.table("https://stats.idre.ucla.edu/stat/examples/alda/teachers.csv", sep=",", header=T)
ts <- summary(survfit( Surv(t, 1-censor)~ 1, conf.type="none", error="greenwood", data=teachers))
h<-ts$n.event/ts$n.risk
se.h<-sqrt(h*(1-h)/ts$n.risk)
s.sqrt<-(ts$std.err)^2/(ts$surv)^2
tab10.2<-cbind(t=ts$time, n=ts$n.risk, hazard = h, se.h, survival=ts$surv, s.sqrt, stderr=ts$std.err)
tab10.2
       t    n     hazard        se.h  survival       s.sqrt      stderr
 [1,]  1 3941 0.11570667 0.005095352 0.8842933 3.320134e-05 0.005095352
 [2,]  2 3485 0.11018651 0.005304108 0.7868561 6.873392e-05 0.006523503
 [3,]  3 3101 0.11576911 0.005745506 0.6957625 1.109546e-04 0.007328813
 [4,]  4 2742 0.10758570 0.005917344 0.6209084 1.549210e-04 0.007728276
 [5,]  5 2447 0.08908868 0.005758804 0.5655925 1.948890e-04 0.007895820
 [6,]  6 2229 0.08254823 0.005828952 0.5189038 2.352549e-04 0.007958957
 [7,]  7 2045 0.06014670 0.005257621 0.4876935 2.665487e-04 0.007962239
 [8,]  8 1642 0.04811206 0.005281208 0.4642295 2.973305e-04 0.008004838
 [9,]  9 1256 0.04219745 0.005672654 0.4446402 3.324074e-04 0.008106700
[10,] 10  948 0.03691983 0.006124306 0.4282242 3.728453e-04 0.008268668
[11,] 11  648 0.02469136 0.006096155 0.4176508 4.119139e-04 0.008476499
[12,] 12  391 0.01278772 0.005682161 0.4123100 4.450427e-04 0.008698106
Figure 10.4, page 353
Demonstrating the difference between the person-oriented data set teachers and the person-period data set teachers_pp.
teachers<-read.table("https://stats.idre.ucla.edu/stat/examples/alda/teachers.csv", sep=",", header=T)
teachers[teachers$id==20 | teachers$id == 126 | teachers$id ==129, ]
     id  t censor
19   20  3      0
125 126 12      0
128 129 12      1
To go from person-level/person-oriented data to person-period data, also see our FAQ page.
rm(list=ls())
teachers.pp<-read.table("https://stats.idre.ucla.edu/stat/examples/alda/teachers_pp.csv", sep=",", header=T)
t<-subset(teachers.pp, id %in% c(20, 126, 129))
t
     id period event
95   20      1     0
96   20      2     0
97   20      3     1
740 126      1     0
741 126      2     0
742 126      3     0
743 126      4     0
744 126      5     0
745 126      6     0
746 126      7     0
747 126      8     0
748 126      9     0
749 126     10     0
750 126     11     0
751 126     12     1
760 129      1     0
761 129      2     0
762 129      3     0
763 129      4     0
764 129      5     0
765 129      6     0
766 129      7     0
767 129      8     0
768 129      9     0
769 129     10     0
770 129     11     0
771 129     12     0
Table 10.3, page 355
Cross-tabulation of event indicator (event) and time-period indicator (period) in the person-period data set to yield components of the life table.
rm(list=ls())
teachers.pp<-read.table("https://stats.idre.ucla.edu/stat/examples/alda/teachers_pp.csv", sep=",", header=T)
attach(teachers.pp)
temp<-data.frame(table(period, event))
event0<-subset(temp, event==0)
event1<-subset(temp, event==1)
total<-event0$Freq + event1$Freq
proportion<-event1$Freq/total

tab10.3<-cbind(period=event0$period, event0=event0$Freq, event1=event1$Freq, total, proportion)
tab10.3
      period event0 event1 total proportion
 [1,]      1   3485    456  3941 0.11570667
 [2,]      2   3101    384  3485 0.11018651
 [3,]      3   2742    359  3101 0.11576911
 [4,]      4   2447    295  2742 0.10758570
 [5,]      5   2229    218  2447 0.08908868
 [6,]      6   2045    184  2229 0.08254823
 [7,]      7   1922    123  2045 0.06014670
 [8,]      8   1563     79  1642 0.04811206
 [9,]      9   1203     53  1256 0.04219745
[10,]     10    913     35   948 0.03691983
[11,]     11    632     16   648 0.02469136
[12,]     12    386      5   391 0.01278772

