R Textbook Examples Applied Longitudinal Data Analysis: Modeling Change and Event Occurrence by Judith D. Singer and John B. Willett Chapter 11: Fitting basic discrete-time hazard models
The examples on the page were written in R version 2.4.1. This page requires package survival.
library(survival)
Figure 11.1, page 359
firstsex<-read.table("https://stats.idre.ucla.edu/stat/examples/alda/firstsex.csv", sep=",", header=T)
ts0 <- survfit( Surv(time, 1-censor)~ 1, conf.type="none", subset=(pt==0), data=firstsex)
ts1 <- survfit( Surv(time, 1-censor)~ 1, conf.type="none", subset=(pt==1), data=firstsex)

h0<-ts0$n.event/ts0$n.risk
h1<-ts1$n.event/ts1$n.risk

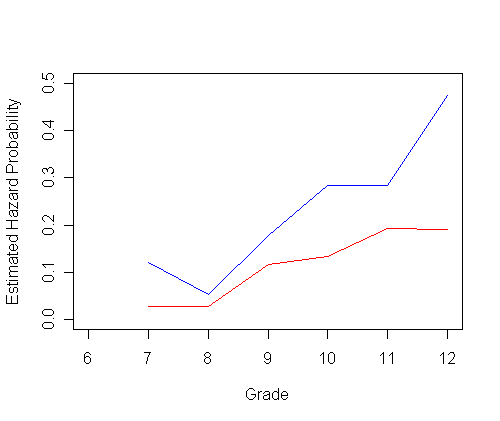
plot(ts0$time, h0, type="l", ylab="Estimated Hazard probability", xlab="Grade",
     ylim=c(0.0, 0.5), xlim=c(6, 12), col="red")
par(new=T)
plot(ts1$time, h1, type="l", ylab=" ", ylim=c(0.0, 0.5), xlim=c(6, 12), xlab="", col="blue")
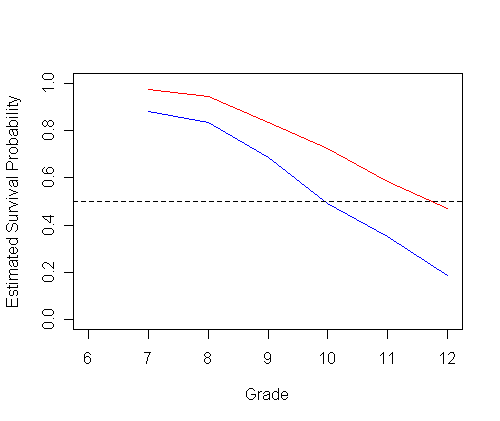
plot(ts0$time, ts0$surv, type="l", ylab="Estimated Survival Function", xlab="Grade",
     ylim=c(0.0, 1.0), xlim=c(6, 12), col="red")
par(new=T)
plot(ts1$time, ts1$surv, type="l", ylab=" ", ylim=c(0.0, 1.0), xlim=c(6, 12), xlab="", col="blue")
abline(h=c(.5), lty=2)
Table 11.1, page 360. We will do create the table in two parts. The first part is based on the result from previous example.
tab11.1.0<-cbind(time=ts0$time, nleft=ts0$n.risk, failed=ts0$n.event, hazard=h0, survival=ts0$surv)
tab11.1.1<-cbind(time=ts1$time, nleft=ts1$n.risk, failed=ts1$n.event, hazard=h1, survival=ts1$surv)
tab11.1 <-rbind(tab11.1.0, tab11.1.1)
tab11.1
      time nleft failed    hazard  survival
 [1,]    7    72      2 0.02777778 0.9722222
 [2,]    8    70      2 0.02857143 0.9444444
 [3,]    9    68      8 0.11764706 0.8333333
 [4,]   10    60      8 0.13333333 0.7222222
 [5,]   11    52     10 0.19230769 0.5833333
 [6,]   12    42      8 0.19047619 0.4722222
 [7,]    7   108     13 0.12037037 0.8796296
 [8,]    8    95      5 0.05263158 0.8333333
 [9,]    9    90     16 0.17777778 0.6851852
[10,]   10    74     21 0.28378378 0.4907407
[11,]   11    53     15 0.28301887 0.3518519
[12,]   12    38     18 0.47368421 0.1851852
tsall <- survfit( Surv(time, 1-censor)~ 1, conf.type="none", data=firstsex)
h<-tsall$n.event/tsall$n.risk
tab11.1.all<-cbind(time=tsall$time, nleft=tsall$n.risk, failed=tsall$n.event, hazard=h, survival=tsall$surv)
tab11.1.all

     time nleft failed    hazard  survival
[1,]    7   180     15 0.08333333 0.9166667
[2,]    8   165      7 0.04242424 0.8777778
[3,]    9   158     24 0.15189873 0.7444444
[4,]   10   134     29 0.21641791 0.5833333
[5,]   11   105     25 0.23809524 0.4444444
[6,]   12    80     26 0.32500000 0.3000000
Figure 11.2, page 363
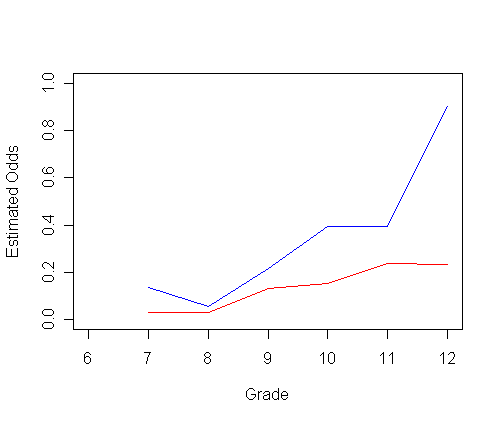
We will use the variables created for the previous example containing the hazard function created for Figure 11.1 in order to create the estimated odds and the estimated logit(hazard).
odds0<-h0/(1-h0)
odds1<-h1/(1-h1)
logith0<-log(odds0)
logith1<-log(odds1)
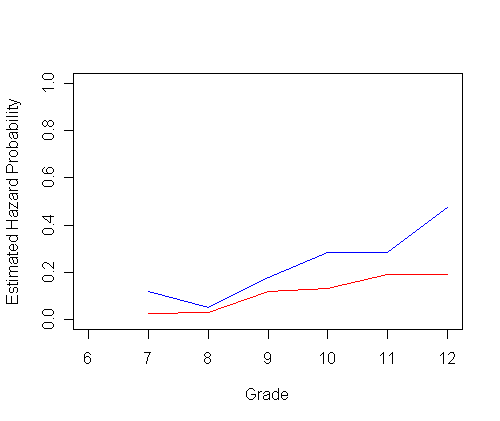
plot(ts0$time, h0, type="l", ylab="Estimated Hazard Probability", xlab="Grade",
ylim=c(0.0, 1), xlim=c(6, 12), col="red")
par(new=T)
plot(ts1$time, h1, type="l", ylab=" ", ylim=c(0.0, 1), xlim=c(6, 12), xlab="", col="blue")
 plot(ts0$time, odds0, type="l", ylab="Estimated Odds", xlab="Grade",
ylim=c(0,1), xlim=c(6, 12), col="red")
par(new=T)
plot(ts1$time, odds1, type="l", ylab=" ", ylim=c(0, 1), xlim=c(6, 12), xlab="", col="blue")
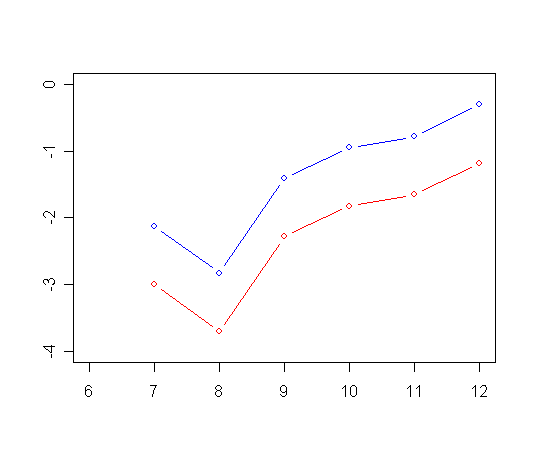
 plot(ts0$time, logith0, type="l", ylab="Estimated Logit", xlab="Grade",
ylim=c(-4, 0), xlim=c(6, 12), col="red")
par(new=T)
plot(ts1$time, logith1, type="l", ylab=" ", ylim=c(-4, 0), xlim=c(6, 12), xlab="", col="blue")
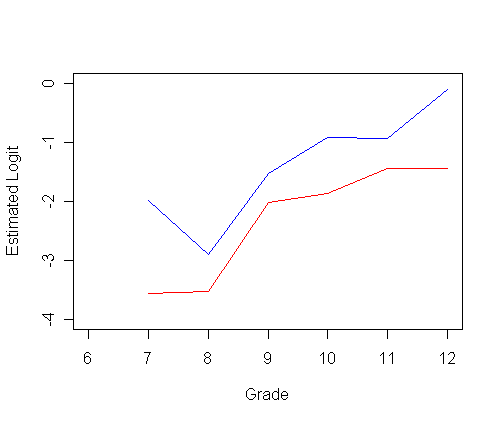
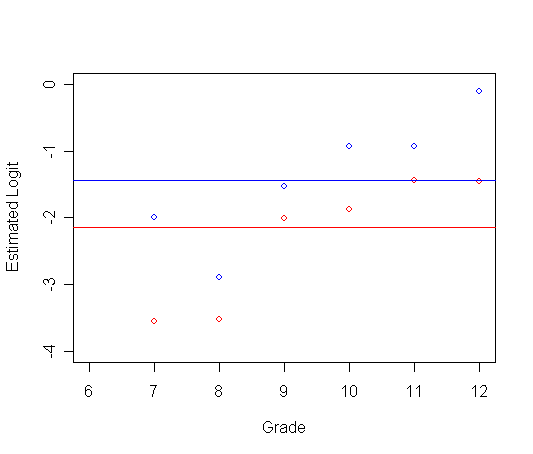
Figure 11.3 on page 366.
Panel A: logit hazard is horizontal with time.
firstsex.pp<-read.table("https://stats.idre.ucla.edu/stat/examples/alda/firstsex_pp.csv", sep=",", header=T)
afit <- glm(event ~ pt, family="binomial", data=firstsex.pp)
summary(afit)

Call:
glm(formula = event ~ pt, family = "binomial", data = firstsex.pp)

Deviance Residuals:
    Min       1Q   Median       3Q      Max
-0.6532  -0.6532  -0.4696  -0.4696   2.1258

Coefficients:
            Estimate Std. Error z value Pr(>|z|)
(Intercept)  -2.1493     0.1714 -12.539  < 2e-16 ***
pt            0.7131     0.2084   3.421 0.000623 ***

t<-data.frame(afit$coefficients)
p0<-t[1,1]
p1<-p0+t[2,1]

firstsex<-read.table("https://stats.idre.ucla.edu/stat/examples/alda/firstsex.csv", sep=",", header=T)
ts0 <- survfit( Surv(time, 1-censor)~ 1, conf.type="none", subset=(pt==0), data=firstsex)
ts1 <- survfit( Surv(time, 1-censor)~ 1, conf.type="none", subset=(pt==1), data=firstsex)
h0<-ts0$n.event/ts0$n.risk
h1<-ts1$n.event/ts1$n.risk

odds0<-h0/(1-h0)
odds1<-h1/(1-h1)
logith0<-log(odds0)
logith1<-log(odds1)
plot(ts0$time, logith0, type="p", ylab="Estimated Logit", xlab="Grade",
     ylim=c(-4, 0), xlim=c(6, 12), col="red")
par(new=T)
plot(ts1$time, logith1, type="p", ylab=" ", ylim=c(-4, 0), xlim=c(6, 12), xlab="", col="blue")
abline(h=c(p0), lty=1, col="red")
abline(h=c(p1), lty=1, col="blue")
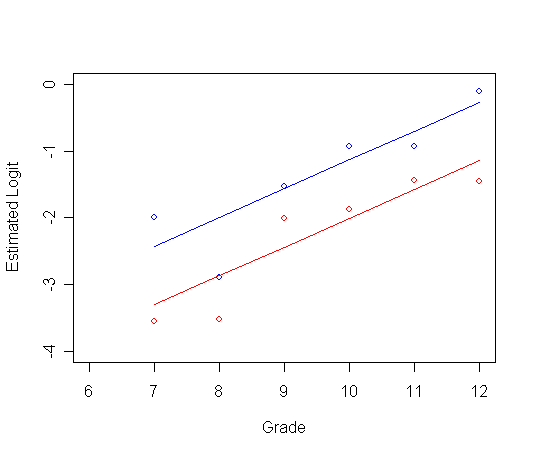
Panel B: logit hazard is linear with time
afit2<-glm(event~pt + period, family="binomial", data=firstsex.pp)
summary(afit2)

Call:
glm(formula = event ~ pt + period, family = "binomial", data = firstsex.pp)

Deviance Residuals:
    Min       1Q   Median       3Q      Max
-1.0653  -0.6177  -0.4128  -0.3329   2.5813

Coefficients:
            Estimate Std. Error z value Pr(>|z|)
(Intercept) -6.30534    0.67034  -9.406  < 2e-16 ***
pt           0.87544    0.21696   4.035 5.46e-05 ***
period       0.43003    0.06407   6.712 1.92e-11 ***
t<-data.frame(afit2$coefficients)
y0<-t[1,1] + t[3,1]*ts0$time
y1<-t[1,1] + t[2,1] + t[3,1]*ts0$time

plot(ts0$time, logith0, type="p", ylab="Estimated Logit", xlab="Grade",
     ylim=c(-4, 0), xlim=c(6, 12), col="red")
par(new=T)
plot(ts1$time, logith1, type="p", ylab=" ", ylim=c(-4, 0), xlim=c(6, 12), xlab="", col="blue")
par(new=T)
plot(ts1$time, y0, type="l", ylab=" ", ylim=c(-4, 0), xlim=c(6, 12), xlab="", col="red")
par(new=T)
plot(ts1$time, y1, type="l", ylab=" ", ylim=c(-4, 0), xlim=c(6, 12), xlab="", col="blue")
Panel C: Logit hazard is completely general with time.
afit3<-glm(event~pt + factor(period), family="binomial", data=firstsex.pp)
summary(afit3)
glm(formula = event ~ pt + factor(period), family = "binomial",
    data = firstsex.pp)

Deviance Residuals:
    Min       1Q   Median       3Q      Max
-1.0508  -0.6617  -0.4411  -0.3126   2.7293

Coefficients:
                 Estimate Std. Error z value Pr(>|z|)
(Intercept)       -2.9943     0.3175  -9.431  < 2e-16 ***
pt                 0.8736     0.2174   4.018 5.86e-05 ***
factor(period)8   -0.7058     0.4728  -1.493 0.135514
factor(period)9    0.7132     0.3519   2.027 0.042667 *
factor(period)10   1.1717     0.3452   3.394 0.000689 ***
factor(period)11   1.3401     0.3588   3.735 0.000188 ***
factor(period)12   1.8153     0.3674   4.941 7.78e-07 ***
t<-data.frame(cbind(y=afit3$linear.predictors, time=firstsex.pp$period, pt=firstsex.pp$pt))
t0<-t[t$pt==0,]
t0<-t0[order(t0$time),]
t1<-t[t$pt==1,]
t1<-t1[order(t1$time),]

plot(ts0$time, logith0, type="p", ylab="Estimated Logit", xlab="Grade",
     ylim=c(-4, 0), xlim=c(6, 12), col="red")
par(new=T)
plot(ts1$time, logith1, type="p", ylab=" ", ylim=c(-4, 0), xlim=c(6, 12), xlab="", col="blue")
par(new=T)
plot(t0$time, t0$y, type="l", ylab=" ", ylim=c(-4, 0), xlim=c(6, 12), xlab="", col="red")
par(new=T)
plot(t1$time, t1$y, type="l", ylab=" ", ylim=c(-4, 0), xlim=c(6, 12), xlab="", col="blue")
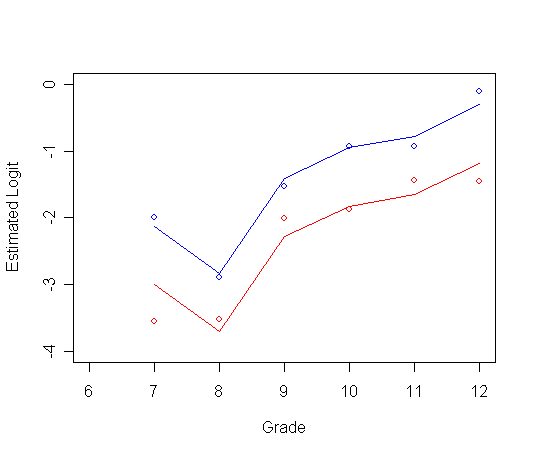
Figure 11.4, page 374
Panel A:
afit3<-glm(event~pt + factor(period), family="binomial", data=firstsex.pp)
t<-data.frame(cbind(y=afit3$linear.predictors, time=firstsex.pp$period, pt=firstsex.pp$pt))
t0<-t[t$pt==0,]
t0<-t0[order(t0$time),]
t1<-t[t$pt==1,]
t1<-t1[order(t1$time),]

plot(t0$time, t0$y, type="b", ylab=" ", ylim=c(-4, 0), xlim=c(6, 12), xlab="", col="red")
par(new=T)
plot(t1$time, t1$y, type="b", ylab=" ", ylim=c(-4, 0), xlim=c(6, 12), xlab="", col="blue")
Panel B:
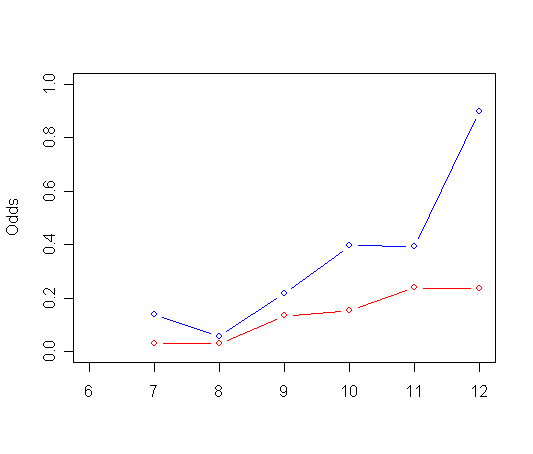
afit4<-glm(event~pt + factor(period) + pt*factor(period), family="binomial", data=firstsex.pp)

t<-data.frame(cbind(y=exp(afit4$linear.predictors), time=firstsex.pp$period, pt=firstsex.pp$pt))
t0<-t[t$pt==0,]
t0<-t0[order(t0$time),]
t1<-t[t$pt==1,]
t1<-t1[order(t1$time),]

plot(t0$time, t0$y, type="b", ylab="Odds", ylim=c(0, 1), xlim=c(6, 12), xlab="", col="red")
par(new=T)
plot(t1$time, t1$y, type="b", ylab=" ", ylim=c(0, 1), xlim=c(6, 12), xlab="", col="blue")
Panel C:
t<-data.frame(cbind(y=afit4$fitted.values, time=firstsex.pp$period, pt=firstsex.pp$pt))
t0<-t[t$pt==0,]
t0<-t0[order(t0$time),]
t1<-t[t$pt==1,]
t1<-t1[order(t1$time),]

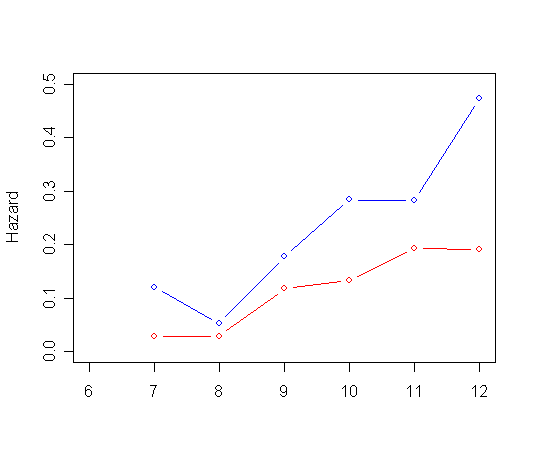
plot(t0$time, t0$y, type="b", ylab="Hazard", ylim=c(0, .5), xlim=c(6, 12), xlab="", col="red")
par(new=T)
plot(t1$time, t1$y, type="b", ylab=" ", ylim=c(0, .5), xlim=c(6, 12), xlab="", col="blue")
Table 11.3, page 386. Notice that in order to do the deviance test, sometimes we have to run the model multiple times, one for each variable being tested since the variable being tested has to appear at the end of the model.
Model A:
modelA<-glm(event~factor(period) - 1, family="binomial", data=firstsex.pp)
summary(modelA)
Call:
glm(formula = event ~ factor(period) - 1, family = "binomial",
    data = firstsex.pp)

Deviance Residuals:
    Min       1Q   Median       3Q      Max
-0.8866  -0.6984  -0.4172  -0.2945   2.5140

Coefficients:
                 Estimate Std. Error z value Pr(>|z|)
factor(period)7   -2.3979     0.2697  -8.892  < 2e-16 ***
factor(period)8   -3.1167     0.3862  -8.071 7.00e-16 ***
factor(period)9   -1.7198     0.2217  -7.759 8.56e-15 ***
factor(period)10  -1.2867     0.2098  -6.133 8.60e-10 ***
factor(period)11  -1.1632     0.2291  -5.076 3.85e-07 ***
factor(period)12  -0.7309     0.2387  -3.062   0.0022 **
---
Signif. codes:  0 '***' 0.001 '**' 0.01 '*' 0.05 '.' 0.1 ' ' 1

(Dispersion parameter for binomial family taken to be 1)

    Null deviance: 1139.53  on 822  degrees of freedom
Residual deviance:  651.96  on 816  degrees of freedom
AIC: 663.96

Number of Fisher Scoring iterations: 5
Model B:
modelB<-glm(event~factor(period) + pt - 1, family="binomial", data=firstsex.pp)
summary(modelB)
Call:
glm(formula = event ~ factor(period) + pt - 1, family = "binomial",
    data = firstsex.pp)

Deviance Residuals:
    Min       1Q   Median       3Q      Max
-1.0508  -0.6617  -0.4411  -0.3126   2.7293

Coefficients:
                 Estimate Std. Error z value Pr(>|z|)
factor(period)7   -2.9943     0.3175  -9.431  < 2e-16 ***
factor(period)8   -3.7001     0.4205  -8.800  < 2e-16 ***
factor(period)9   -2.2811     0.2724  -8.374  < 2e-16 ***
factor(period)10  -1.8226     0.2585  -7.052 1.77e-12 ***
factor(period)11  -1.6542     0.2691  -6.147 7.89e-10 ***
factor(period)12  -1.1791     0.2716  -4.341 1.42e-05 ***
pt                 0.8736     0.2174   4.018 5.86e-05 ***
---
Signif. codes:  0 '***' 0.001 '**' 0.01 '*' 0.05 '.' 0.1 ' ' 1

(Dispersion parameter for binomial family taken to be 1)

    Null deviance: 1139.53  on 822  degrees of freedom
Residual deviance:  634.66  on 815  degrees of freedom
AIC: 648.66

Number of Fisher Scoring iterations: 5
anova(modelB)
Analysis of Deviance Table

Model: binomial, link: logit

Response: event

Terms added sequentially (first to last)


                Df Deviance Resid. Df Resid. Dev
NULL                              822    1139.53
factor(period)   6   487.58       816     651.96
pt               1    17.29       815     634.66
Model C:
modelC<-glm(event~factor(period) + pas - 1, family="binomial", data=firstsex.pp)
summary(modelC)

Call:
glm(formula = event ~ factor(period) + pas - 1, family = "binomial",
    data = firstsex.pp)

Deviance Residuals:
    Min       1Q   Median       3Q      Max
-1.1548  -0.6360  -0.4475  -0.2725   2.6829

Coefficients:
                 Estimate Std. Error z value Pr(>|z|)
factor(period)7   -2.4646     0.2741  -8.991  < 2e-16 ***
factor(period)8   -3.1591     0.3889  -8.123 4.55e-16 ***
factor(period)9   -1.7297     0.2245  -7.705 1.31e-14 ***
factor(period)10  -1.2851     0.2127  -6.043 1.51e-09 ***
factor(period)11  -1.1360     0.2324  -4.889 1.01e-06 ***
factor(period)12  -0.6421     0.2428  -2.644 0.008187 **
pas                0.4428     0.1140   3.886 0.000102 ***
---
Signif. codes:  0 '***' 0.001 '**' 0.01 '*' 0.05 '.' 0.1 ' ' 1

(Dispersion parameter for binomial family taken to be 1)

    Null deviance: 1139.53  on 822  degrees of freedom
Residual deviance:  637.17  on 815  degrees of freedom
AIC: 651.17

Number of Fisher Scoring iterations: 5

anova(modelC)
Analysis of Deviance Table

Model: binomial, link: logit

Response: event

Terms added sequentially (first to last)


                Df Deviance Resid. Df Resid. Dev
NULL                              822    1139.53
factor(period)   6   487.58       816     651.96
pas              1    14.79       815     637.17
Model D:
modelD<-glm(event~factor(period) + pt + pas - 1, family="binomial", data=firstsex.pp)
summary(modelD)

Call:
glm(formula = event ~ factor(period) + pt + pas - 1, family = "binomial",
    data = firstsex.pp)

Deviance Residuals:
    Min       1Q   Median       3Q      Max
-1.1787  -0.6182  -0.4338  -0.2836   2.7862

Coefficients:
                 Estimate Std. Error z value Pr(>|z|)
factor(period)7   -2.8932     0.3206  -9.024  < 2e-16 ***
factor(period)8   -3.5848     0.4230  -8.474  < 2e-16 ***
factor(period)9   -2.1502     0.2775  -7.750 9.20e-15 ***
factor(period)10  -1.6932     0.2646  -6.398 1.58e-10 ***
factor(period)11  -1.5177     0.2757  -5.504 3.71e-08 ***
factor(period)12  -1.0099     0.2811  -3.592 0.000328 ***
pt                 0.6605     0.2367   2.790 0.005266 **
pas                0.2964     0.1254   2.364 0.018089 *
---
Signif. codes:  0 '***' 0.001 '**' 0.01 '*' 0.05 '.' 0.1 ' ' 1

(Dispersion parameter for binomial family taken to be 1)

    Null deviance: 1139.53  on 822  degrees of freedom
Residual deviance:  629.15  on 814  degrees of freedom
AIC: 645.15

Number of Fisher Scoring iterations: 5
modelD<-glm(event~factor(period) + pas + pt - 1, family="binomial", data=firstsex.pp)
anova(modelD)
Analysis of Deviance Table

Model: binomial, link: logit

Response: event

Terms added sequentially (first to last)


                Df Deviance Resid. Df Resid. Dev
NULL                              822    1139.53
factor(period)   6   487.58       816     651.96
pas              1    14.79       815     637.17
pt               1     8.02       814     629.15
modelD<-glm(event~factor(period) + pt + pas - 1, family="binomial", data=firstsex.pp)
anova(modelD)
Analysis of Deviance Table

Model: binomial, link: logit

Response: event

Terms added sequentially (first to last)


                Df Deviance Resid. Df Resid. Dev
NULL                              822    1139.53
factor(period)   6   487.58       816     651.96
pt               1    17.29       815     634.66
pas              1     5.51       814     629.15
Table 11.4, page 388
modelA<-glm(event~factor(period) - 1, family="binomial", data=firstsex.pp)
col0<-c(7:12)
col1<-c("D7", "D8", "D9", "D10", "D11", "D12")
col2<-exp(modelA$coefficients)
col3<- 1 /(1+exp(-modelA$coefficients))
tab11.4<-data.frame(time=col0, Predictor=col1, parameter=modelA$coefficients,
         fitted.odds=col2, fitted.hazard=col3, row.names=NULL)
tab11.4
  time Predictor  parameter fitted.odds fitted.hazard
1    7        D7 -2.3978953   0.0909091    0.08333333
2    8        D8 -3.1166848   0.0443038    0.04242425
3    9        D9 -1.7197860   0.1791045    0.15189873
4   10       D10 -1.2866645   0.2761905    0.21641791
5   11       D11 -1.1631508   0.3125000    0.23809524
6   12       D12 -0.7308875   0.4814815    0.32500000
Table 11.5 on page 392 based on Model B.
modelB<-glm(event~factor(period) + pt - 1, family="binomial", data=firstsex.pp)
t<-data.frame(hazard=modelB$fitted.values, time=firstsex.pp$period, pt=firstsex.pp$pt)
t$logit<-log(t$hazard/(1-t$hazard))

ta<-aggregate(t, list(pt=t$pt, time=t$time),mean)
ta.0<-ta[ta$pt==0, ]
ta.1<-ta[ta$pt==1, ]

c1<-c(7:12)
c2<-ta.0$logit
c3<-ta.1$logit-ta.0$logit
c4<-ta.0$logit
c5<-ta.1$logit
c6<-ta.0$hazard
c7<-ta.1$hazard

tab11.5<-data.frame(time=c1, alpha=c2, beta=c3, logit_0 = c4, logit_1= c5,
               hazard_0 = c6, hazard_1 = c7)

tab11.5$surv_0<-c(1:7)
tab11.5$surv_1<-c(1:7)
tab11.5$surv_0[1]<-1-tab11.5$hazard_0[1]
tab11.5$surv_1[1]<-1-tab11.5$hazard_1[1]
for(i in 2:6) {
tab11.5$surv_0[i] = tab11.5$surv_0[i-1]*(1-tab11.5$hazard_0[i])
tab11.5$surv_1[i] = tab11.5$surv_1[i-1]*(1-tab11.5$hazard_1[i])
 }

tab11.5
  time     alpha      beta   logit_0    logit_1   hazard_0   hazard_1    surv_0    surv_1
1    7 -2.994327 0.8736184 -2.994327 -2.1207082 0.04768284 0.10710033 0.9523172 0.8928997
2    8 -3.700124 0.8736184 -3.700124 -2.8265055 0.02412410 0.05590856 0.9293434 0.8429789
3    9 -2.281124 0.8736184 -2.281124 -1.4075051 0.09269841 0.19662787 0.8431947 0.6772258
4   10 -1.822599 0.8736184 -1.822599 -0.9489801 0.13912236 0.27908998 0.7258875 0.4882189
5   11 -1.654227 0.8736184 -1.654227 -0.7806088 0.16053845 0.31418869 0.6093546 0.3348260
6   12 -1.179057 0.8736184 -1.179057 -0.3054385 0.23522180 0.42422854 0.4660211 0.1927833
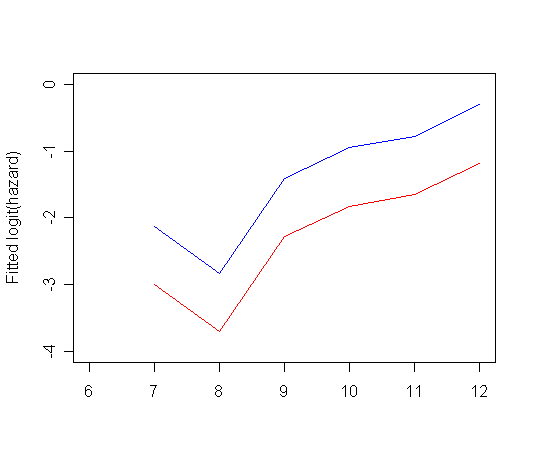
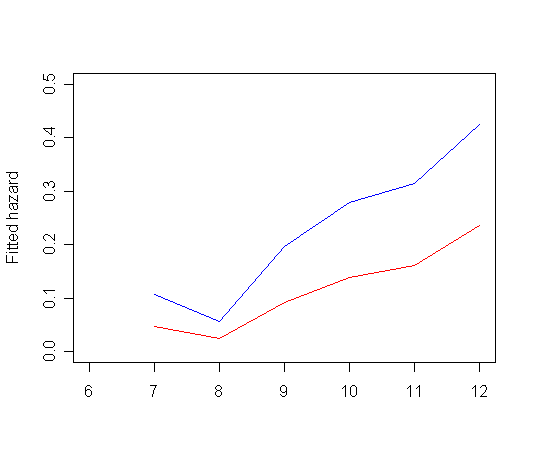
Figure 11.6, page 393 using Model B. The data for the graphs, tab11.5, has been created in previous example.
plot(tab11.5$time, tab11.5$logit_0, type="l", ylab="Fitted logit(hazard)",
     ylim=c(-4, 0), xlim=c(6, 12), xlab="", col="red")
par(new=T)
plot(tab11.5$time, tab11.5$logit_1, type="l", ylab="", ylim=c(-4, 0), xlim=c(6, 12), xlab="", col="blue")
plot(tab11.5$time, tab11.5$hazard_0, type="l", ylab="Fitted hazard",
     ylim=c(0, 0.5), xlim=c(6, 12), xlab="", col="red")
par(new=T)
plot(tab11.5$time, tab11.5$hazard_1, type="l", ylab="", ylim=c(0, 0.5), xlim=c(6, 12), xlab="", col="blue")
plot(tab11.5$time, tab11.5$surv_0, type="l", ylab="Fitted survival probability",
     ylim=c(0, 1), xlim=c(6, 12), xlab="", col="red")
par(new=T)
plot(tab11.5$time, tab11.5$surv_1, type="l", ylab="", ylim=c(0,1), xlim=c(6, 12), xlab="", col="blue")
abline(h=c(.5), lty=2)
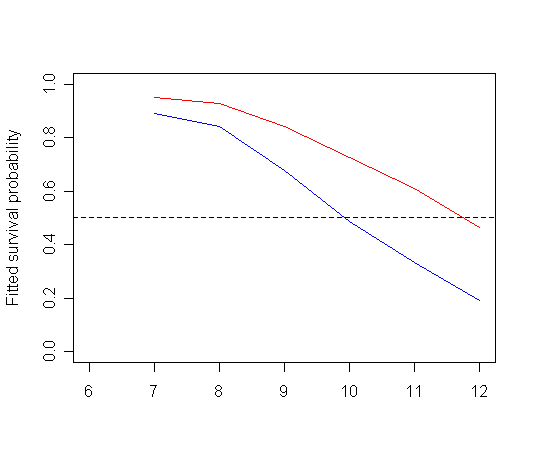
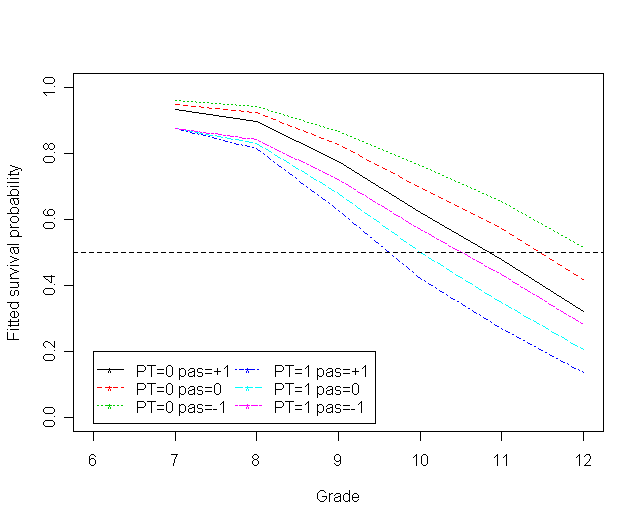
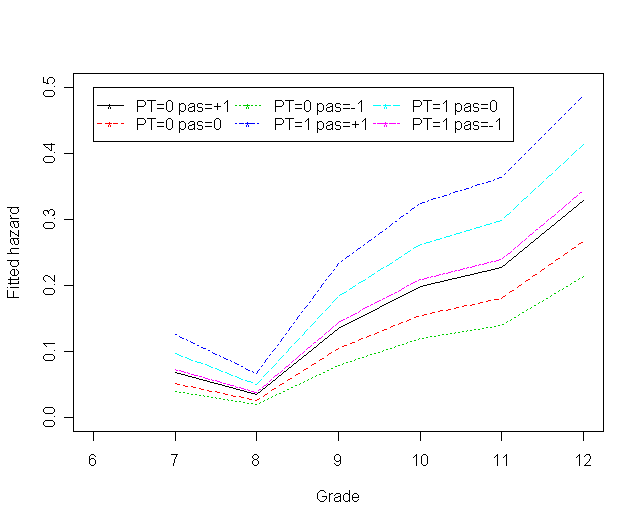
Figure 11.7 on page 395 based on Model D.
modelD<-glm(event~factor(period) + pt + pas - 1, family="binomial", data=firstsex.pp)
coeff<-data.frame(modelD$coefficients)
myt<-c(1:6)
h0_pas1<-c(1:6)
h0_pas0<-c(1:6)
h0_pasn1<-c(1:6)
h1_pas1<-c(1:6)
h1_pas0<-c(1:6)
h1_pasn1<-c(1:6)

for(i in 1:6) {
myt[i]<-i+6
h0_pas1[i]<-1/(1+ exp(-(coeff[i,] + coeff[8,])))
h0_pas0[i]<-1/(1+ exp(-coeff[i,]))
h0_pasn1[i]<-1/(1+ exp(-(coeff[i,] - coeff[8,])))
h1_pas1[i]<-1/(1+ exp(-(coeff[i,] + coeff[8,] + coeff[7,])))
h1_pas0[i]<-1/(1+ exp(-(coeff[i,] + coeff[7,])))
h1_pasn1[i]<-1/(1+ exp(-(coeff[i,] - coeff[8,] + coeff[7,])))
}
f<-cbind(h0_pas1,h0_pas0,h0_pasn1, h1_pas1,h1_pas0,h1_pasn1)

matplot(myt, f, type="l", ylab="Fitted hazard", ylim=c(0, 0.5), xlim=c(6, 12),
     xlab="Grade", col=1:6, lty=1:6)
legend(6, .5, c("PT=0 pas=+1", "PT=0 pas=0", "PT=0 pas=-1",
                "PT=1 pas=+1", "PT=1 pas=0", "PT=1 pas=-1"),
                col=1:6, lty=1:6, pch = "*",
                ncol =3, cex = 1)
surv0_pas1<-c(1:6)
surv0_pas0<-c(1:6)
surv0_pasn1<-c(1:6)
surv1_pas1<-c(1:6)
surv1_pas0<-c(1:6)
surv1_pasn1<-c(1:6)

surv0_pas1[1]<-1-h0_pas1[1]
surv0_pas0<-1-h0_pas0[1]
surv0_pasn1<-1-h0_pasn1[1]
surv1_pas1<-1-h1_pas1[1]
surv1_pas0<-1-h1_pas1[1]
surv1_pasn1<-1-h1_pas1[1]

for(i in 2:6) {
surv0_pas1[i] = surv0_pas1[i-1]*(1-h0_pas1[i])
surv0_pas0[i] = surv0_pas0[i-1]*(1-h0_pas0[i])
surv0_pasn1[i] = surv0_pasn1[i-1]*(1-h0_pasn1[i])
surv1_pas1[i] = surv1_pas1[i-1]*(1-h1_pas1[i])
surv1_pas0[i] = surv1_pas0[i-1]*(1-h1_pas0[i])
surv1_pasn1[i] = surv1_pasn1[i-1]*(1-h1_pasn1[i])
 }

s<-cbind(surv0_pas1,surv0_pas0,surv0_pasn1,surv1_pas1,surv1_pas0,surv1_pasn1)
matplot(myt, s, type="l", ylab="Fitted survival probability", ylim=c(0, 1), xlim=c(6, 12),
     xlab="Grade", col=1:6, lty=1:6)
abline(h=c(.5), lty=2)
legend(6, .2, c("PT=0 pas=+1", "PT=0 pas=0", "PT=0 pas=-1",
                "PT=1 pas=+1", "PT=1 pas=0", "PT=1 pas=-1"),
                col=1:6, lty=1:6, pch = "*",
                ncol =2, cex = 1)
