Applied Longitudinal Data Analysis: Modeling Change and Event Occurrence by Judith D. Singer and John B. Willett Chapter 3: Introducing the Multilevel Model for Change
Please note that the “early_int” data file (which is used in Chapter 3) is not included among the data files. This was done at the request of the researchers who contributed this data file to ensure the privacy of the participants in the study. Although the web page shows how to obtain the results with this data file, we regret that visitors do not have access to this file to be able to replicate the results for themselves.
Inputting and printing the early intervention data set, table 3.1, p. 48.
#reading in the early.int data
early.int <- read.table("d:/earlyint_pp.txt", header=T, sep=",")

early.int1 <- early.int[c(1:12, 175:186)

#Table 3.1, p. 48

early.int1
   obs  id age cog program
1    1  68 1.0 103       1
2    2  68 1.5 119       1
3    3  68 2.0  96       1
4    4  70 1.0 106       1
5    5  70 1.5 107       1
6    6  70 2.0  96       1
7    7  71 1.0 112       1
8    8  71 1.5  86       1
9    9  71 2.0  73       1
10  10  72 1.0 100       1
11  11  72 1.5  93       1
12  12  72 2.0  87       1
13 175 902 1.0 119       0
14 176 902 1.5  93       0
15 177 902 2.0  99       0
16 178 904 1.0 112       0
17 179 904 1.5  98       0
18 180 904 2.0  79       0
19 181 906 1.0  89       0
20 182 906 1.5  66       0
21 183 906 2.0  81       0
22 184 908 1.0 117       0
23 185 908 1.5  90       0
24 186 908 2.0  76       0
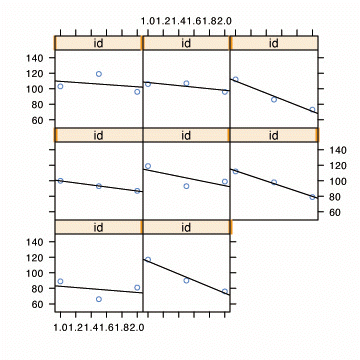
Fig. 3.1, p. 50. OLS trajectories superimposed on the empirical growth plots.
xyplot(cog~age | id, data=early.int1,
  panel = function(x, y){
    panel.xyplot(x, y)
    panel.lmline(x, y)
  }, ylim=c(50, 150), as.table=T)
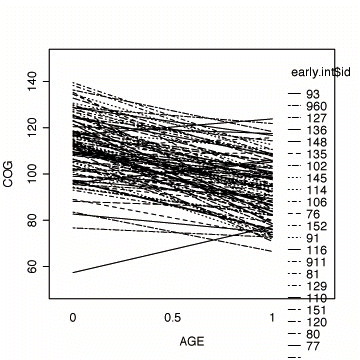
Fig. 3.3, p. 57. Fitted OLS trajectories and stem plots of fitted initial status and fitted rate of change by id.
#fitting the linear model by id
fit <- by(early.int, early.int$id, function(data) fitted.values(lm(cog ~ age, data=data)))
fit1 <- unlist(fit)
names(fit1) <- NULL

#plotting the linear fit by id
interaction.plot(early.int$age, early.int$id, fit1, xlab="AGE", ylab="COG", ylim=c(50, 150))
#stem plot for fitted initial value
int <- by(early.int, early.int$id,
          function(data) coefficients(lm(cog ~ age, data=data))[[1]] )
int <- unlist(int)
names(int) <- NULL
stem(int)

Decimal point is 1 place to the right of the colon

   5 | 7
   6 |
   6 |
   7 |
   7 | 7
   8 | 34
   8 | 89
   9 | 344
   9 | 6666677799
  10 | 0012222244
  10 | 55666788999
  11 | 000111112222333334444
  11 | 55677777888999
  12 | 12233344
  12 | 5556778999
  13 | 0013
  13 | 55568
  14 | 0

#stem plot for fitted rate of change
rate <- by(early.int, early.int$id,
          function(data) coefficients(lm(cog ~ age, data=data))[[2]] )
rate <- unlist(rate)
names(rate) <- NULL
stem(rate)

Decimal point is 1 place to the right of the colon

  -4 : 443111
  -3 : 987
  -3 : 443322100000
  -2 : 9999877776655
  -2 : 44322211110000
  -1 : 99888877666655
  -1 : 4333322211000
  -0 : 99998888777765
  -0 : 4444332
   0 : 134
   0 : 79
   1 : 0
   1 :
   2 : 0

#stem plot for sigma.sq
sig <- by(early.int, early.int$id,
          function(data) (summary(lm(cog ~ age, data=data))$sigma)^2 )
sig <- unlist(sig)
names(sig) <- NULL
stem(sig)

Decimal point is 1 place to the right of the colon

   0 | 0000111111233334444444466668111113337
   2 | 04444888833337778888
   4 | 333844
   6 | 77734
   8 | 1118886666
  10 | 44433
  12 | 21
  14 |
  16 | 00011
  18 | 3
  20 |
  22 | 8
  24 | 1333
  26 | 7
  28 | 4
  30 |
  32 | 3
  34 |
  36 | 8
  38 |
  40 | 00
  42 |
  44 |
  46 | 8
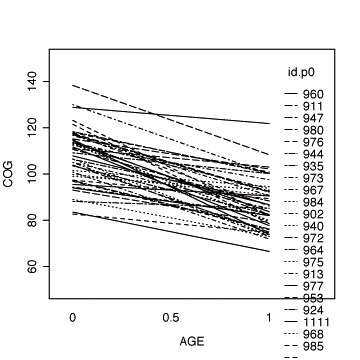
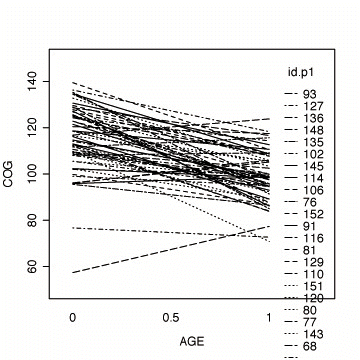
Fig. 3.4, p. 59. The top panel represents fitted OLS trajectories for program=0; the bottom panel represents fitted OLS trajectories for program=1.
#fitting the linear model by id, program=0
early.p0 <- early.int[early.int$program==0, ]

fit.p0 <- by(early.p0, early.p0$id,
          function(data) fitted(lm(cog ~ age, data=data)))
fit.p0 <- unlist(fit.p0)
names(fit.p0) <- NULL

#appending the average for the whole group
lm.p0 <- fitted( lm(cog ~ age, data=early.p0) )
names(lm.p0) <- NULL
fit.p0 <- c(fit.p0, lm.p0[1:3])
age.p0 <- c(early.p0$age, c(0, .5, 1))
id.p0 <- c(early.p0$id, rep(1111, 3))

#plotting the linear fit by id
interaction.plot(age.p0, id.p0, fit.p0,
                 xlab="AGE", ylab="COG", ylim=c(50, 150))
#fitting the linear model by id, program=1
early.p1 <- early.int[early.int$program==1, ]

fit.p1 <- by(early.p1, early.p1$id,
          function(data) fitted.values(lm(cog ~ age, data=data)))
fit.p1 <- unlist(fit.p1)
names(fit.p1) <- NULL

#appending the average for the whole group
lm.p1 <- fitted( lm(cog ~ age, data=early.p1) )
names(lm.p1) <- NULL
fit.p1 <- c(fit.p1, lm.p1[1:3])
age.p1 <- c(early.p1$age, c(1, 1.5, 2))
id.p1 <- c(early.p1$id, rep(1111, 3))

#plotting the linear fit by id
interaction.plot(age.p1, id.p1, fit.p1,
                 xlab="AGE", ylab="COG", ylim=c(50, 150))
Table 3.3, p. 69
library(nlme)

model1<- lme(cog~time*program, data=early.int, random= ~time | id, method="ML")
summary(model1)

       AIC      BIC    logLik
  2385.942 2415.809 -1184.971

Random effects:
 Formula:  ~ time | id
 Structure: General positive-definite
               StdDev   Corr
(Intercept) 11.135975 (Inter
       time  3.187612 -0.997
   Residual  8.644657

Fixed effects: cog ~ time * program
                 Value Std.Error  DF   t-value p-value
 (Intercept)  107.8407  2.047915 204  52.65879  <.0001
        time  -21.1333  1.895694 204 -11.14807  <.0001
     program    6.8547  2.729082 101   2.51171  0.0136
time:program    5.2713  2.526229 204   2.08661  0.0382

Standardized Within-Group Residuals:
       Min         Q1        Med        Q3      Max
 -2.347486 -0.5673839 0.02896275 0.5661698 2.330276

Number of Observations: 309
Number of Groups: 103
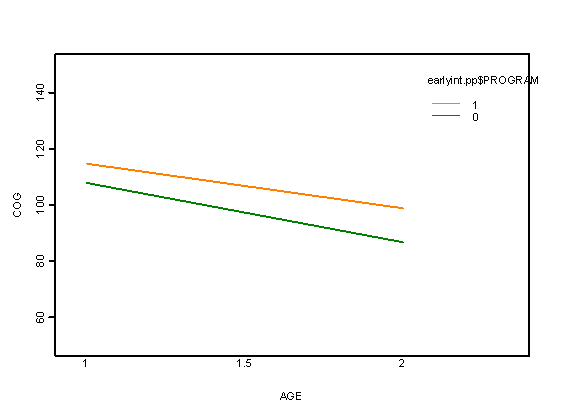
Fig. 3.5 on page 71.
a<-fitted.values(lme(cog~time*program, data=early.int, random= ~time | id, method="REML"))
a<-unlist(a)
interaction.plot(early.int$age, early.int$program, a, xlab="AGE", ylab="COG",
                 ylim=c(50, 150), lwd=4, lty=1, col=4:5)

