R Textbook Examples Applied Longitudinal Data Analysis: Modeling Change and Event Occurrence by Judith D. Singer and John B. Willett Chapter 9: A framework for investigating event occurrence
The examples on the page were written in R version 2.4.1.
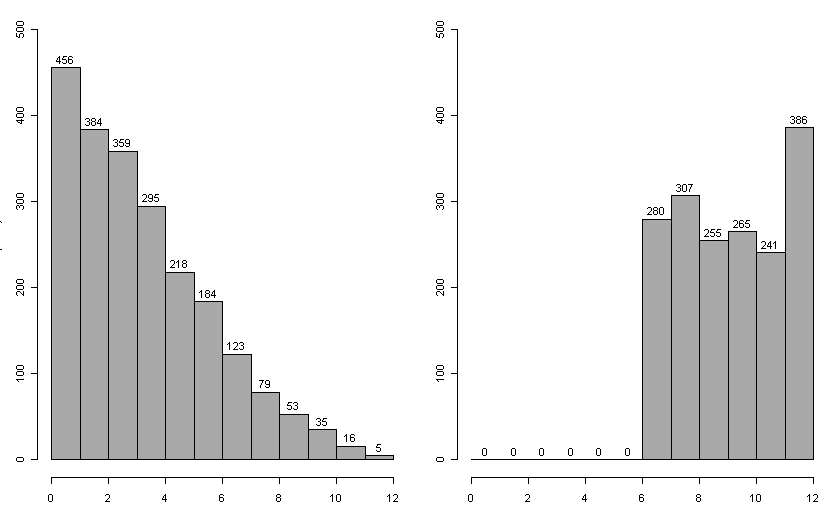
Fig. 9.1 on page 321.
teachers<-read.table("https://stats.idre.ucla.edu/stat/r/examples/alda/data/teachers.csv", sep=",", header=T)
attach(teachers)
t0<-teachers$t[censor==0]
t1<-teachers$t[censor==1]
par(mfrow=c(1, 2), mar=c(3, 3, 1, 1), cex=0.7)
h0<-hist(t0, breaks=c(0:12),  plot=FALSE)
h1<-hist(t1, breaks=c(0:12),  plot=FALSE)
plot(h0, labels=TRUE, col="darkgray", ylim=c(0, 500), main=" ")
plot(h1, labels=TRUE, ylim=c(0, 500), col="darkgray", main=" ", ylab="")

