The R package(s) needed for this chapter is the survival package.
We currently use R 2.0.1 patched version. You may want to make sure that
packages on your local machine are up to date. You can perform updating in R
using update.packages() function.
Table 1.1 on page 4, data set is hmohiv.csv.
 hmohiv<-read.table("https://stats.idre.ucla.edu/stat/r/examples/asa/hmohiv.csv", sep=",", header = TRUE)
 attach(hmohiv)
 hmohiv
     ID time age drug censor     entdate     enddate
1     1    5  46    0      1  5/15/1990  10/14/1990
2     2    6  35    1      0  9/19/1989   3/20/1990
3     3    8  30    1      1  4/21/1991  12/20/1991
4     4    3  30    1      1   1/3/1991    4/4/1991
5     5   22  36    0      1  9/18/1989   7/19/1991
6     6    1  32    1      0  3/18/1991   4/17/1991
7     7    7  36    1      1 11/11/1989   6/11/1990
8     8    9  31    1      1 11/25/1989   8/25/1990
9     9    3  48    0      1  2/11/1991   5/13/1991
10   10   12  47    0      1  8/11/1989   8/11/1990
...........(part of output omitted here)...........
91   91    4  35    0      1  4/10/1990    8/9/1990
92   92   57  36    0      1 12/11/1990    9/9/1995
93   93    1  41    1      1 12/15/1990   1/14/1991
94   94   12  36    1      0  1/13/1989   1/13/1990
95   95    7  35    1      1  8/22/1991   3/21/1992
96   96    1  34    1      1   8/2/1991    9/1/1991
97   97    5  28    0      1  5/22/1991  10/21/1991
98   98   60  29    0      0   4/2/1990    4/1/1995
99   99    2  35    1      0   5/1/1991   6/30/1991
100 100    1  34    1      1  5/11/1989   6/10/1989
Figure 1.1 on page 6 using the hmohiv data set. To control the type of
symbol, a variable called psymbol is created. It takes value 1 and 2, so the symbol type will be 1 and 2.
psymbol<-censor+1
table(psymbol)
  psymbol
   1  2
  20 80
plot(age, time, pch=(psymbol))
legend(40, 60, c("Censor=1", "Censor=0"), pch=(psymbol))
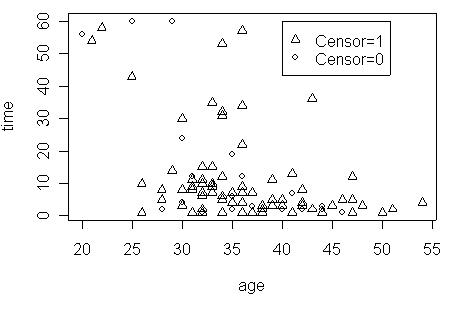
Figure 1.2 on page 7 using the hmohiv data set.
age1<-1000/age
plot(age1, time, pch=(psymbol))
legend(40, 30, c("Censor=1", "Censor=0"), pch=(psymbol))
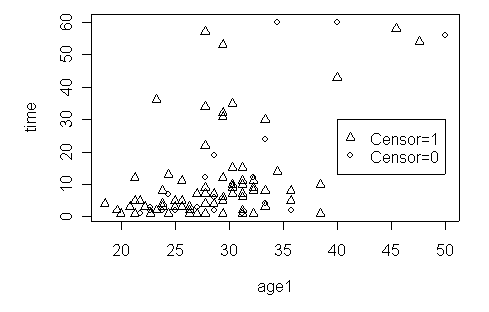
Table 1.2 on page 14 using the data set hmohiv. Package “survival”
is needed for this analysis and for most of the analyses in the book.
library(survival)
test

Call:
survreg(formula = Surv(time, censor) ~ age, dist = "exponential")
             Value Std. Error     z        p
(Intercept)  5.859     0.5853 10.01 1.37e-23
age         -0.094     0.0158 -5.96 2.59e-09

Scale fixed at 1

Exponential distribution
Loglik(model)= -275   Loglik(intercept only)= -292.3
        Chisq= 34.5 on 1 degrees of freedom, p= 4.3e-09
Number of Newton-Raphson Iterations: 4
n= 100
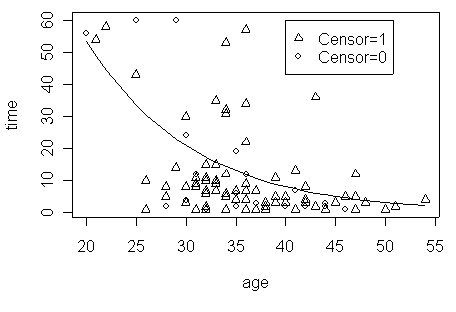
Figure 1.3 on page 16 using data set hmohiv and the model created for Table
1.2 in previous example.
pred