The R packages needed for this chapter are the survival package and the KMsurv package. We currently use R 2.0.1 patched version. You may want to make sure that packages on your local machine are up to date. You can perform update in R using update.packages() function.
Table 2.1 using a subset of data set hmohiv.
 hmohiv<-read.table("https://stats.idre.ucla.edu/stat/r/examples/asa/hmohiv.csv", sep=",", header = TRUE)
 library(survival)
 attach(hmohiv)
 mini<-hmohiv[ID<=5,]
 mini
  ID time age drug censor    entdate     enddate
1  1    5  46    0      1 5/15/1990  10/14/1990
2  2    6  35    1      0 9/19/1989   3/20/1990
3  3    8  30    1      1 4/21/1991  12/20/1991
4  4    3  30    1      1  1/3/1991    4/4/1991
5  5   22  36    0      1 9/18/1989   7/19/1991
Table 2.2 on page 32 using data set created for Table 2.1 previously. We use the conf.type=”none” argument to specify that we do not want to include any confidence intervals for the survival function.
attach(mini)
mini.surv
time n.risk n.event survival std.err
   3      5      1       0.8   0.179
   5      4      1       0.6   0.219
   8      2      1       0.3   0.239
  22      1      1       0.0      NA
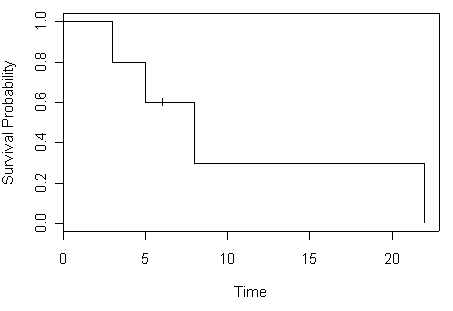
Figure 2.1 on page 32 based on Table 2.2.
plot(mini.surv, xlab="Time", ylab="Survival Probability")
Figure 2.2 and Table 2.3 on page 34 and 35 using the entire data set hmohiv.
detach(mini)
attach(hmohiv)
hmohiv.surv

 time n.risk n.event survival std.err
    1    100      15   0.8500  0.0357
    2     83       5   0.7988  0.0402
    3     73      10   0.6894  0.0473
  ...................................
   53      7       1   0.0934  0.0349
   54      6       1   0.0778  0.0324
   57      4       1   0.0584  0.0296
   58      3       1   0.0389  0.0253
plot (hmohiv.surv, xlab="Time", ylab="Survival Probability" )
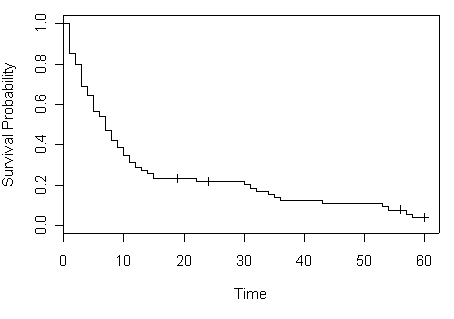
Table 2.4 on page 38 using data set hmohiv with life-table estimator. We will use lifetab function presented in package KMsurv. You can download the package from CRAN by typing from the R prompt install.packages(“KMsurv”). In order to be able to use function lifetab, we need to create a couple of variables, mainly the number of censored at each time point and the number of events at each time point. Also notice that the time intervals have been grouped. The first step is to create grouped data. We use function gsummary from package nlme here to create grouped data. Based on the grouped data, we will create a couple of new variables for lifetab. Function lifetab requires that the length of the time variable is 1 greater than other variables, such as the variable of number of events, or the variable of number of censored.
library(KMsurv)
library(nlme)
t6m<-floor(time/6)
tall<-data.frame(t6m, censor)
die<-gsummary(tall, sum, groups=t6m)
total<-gsummary(tall, length, groups=t6m)
rm(t6m)
ltab.data<-cbind(die[,1:2], total[,2])
detach(hmohiv)
attach(ltab.data)

lt=length(t6m)
t6m[lt+1]=NA
nevent=censor
nlost=total[,2] - censor
mytable<-lifetab(t6m, 100, nlost, nevent)
mytable[,1:5]
      nsubs nlost nrisk nevent       surv
0-1     100    10  95.0     41 1.00000000
1-2      49     3  47.5     21 0.56842105
2-3      25     2  24.0      6 0.31711911
3-4      17     1  16.5      1 0.23783934
4-5      15     1  14.5      0 0.22342483
5-6      14     0  14.0      5 0.22342483
6-7       9     0   9.0      1 0.14363025
7-8       8     0   8.0      1 0.12767133
8-9       7     0   7.0      1 0.11171242
9-10      6     1   5.5      3 0.09575350
10-NA     2     2   1.0      0 0.04352432
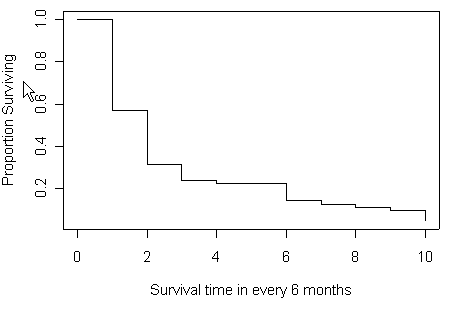
Figure 2.3 and Figure 2.4 on page 38-39 based on Table 2.4 from previous example.
plot(t6m[1:11], mytable[,5], type="s", xlab="Survival time in every 6 month",
     ylab="Proportion Surviving")
plot(t6m[1:11], mytable[,5], type="b", xlab="Survival time in every 6 month",
     ylab="Proportion Surviving")
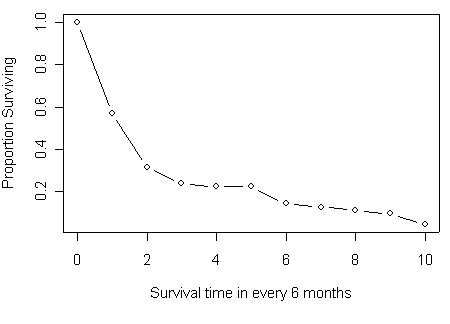
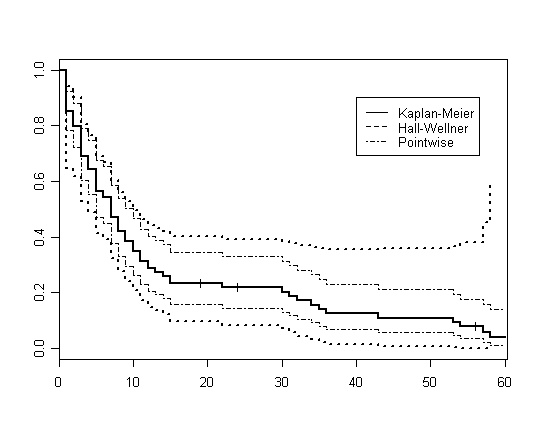
Figure 2.5 on page 46.
library(survival)
library(km.ci)

hmohiv.surv <- survfit( Surv(time, censor) ~ 1)
a<-km.ci(hmohiv.surv, conf.level=0.95, tl=NA, tu=NA, method="loghall")

par(cex=.8)
plot(a, lty=2, lwd=2)
time.conf <- survfit( Surv(time, censor)~ 1)
lines(time.conf, lwd=2, lty=1)
lines(time.conf, lwd=1, lty=4, conf.int=T)
linetype<-c(1, 2, 4)
legend(40, .9, c("Kaplan-Meier", "Hall-Wellner", "Pointwise"), lty=(linetype))
Figure 2.6 on page 48 using the mini data.
detach()
attach(mini)
mini.surv <- survfit(Surv(time, censor)~ 1, conf.type="none")
summary(mini.surv)
 time n.risk n.event survival std.err
    3      5       1      0.8   0.179
    5      4       1      0.6   0.219
    8      2       1      0.3   0.239
   22      1       1      0.0      NA
par(cex=.8)
plot(mini.surv, xlab="Time", ylab="Survival Probability")
lines(x=c(5,5),y=c(0,.6), lty=2)
lines(x=c(8,8),y=c(0,.3), lty=2)
lines(x=c(0,22),y=c(.25,.25), lty=2)
lines(x=c(0,8),y=c(.5,.5), lty=2)
lines(x=c(0,5),y=c(.75,.75), lty=2)
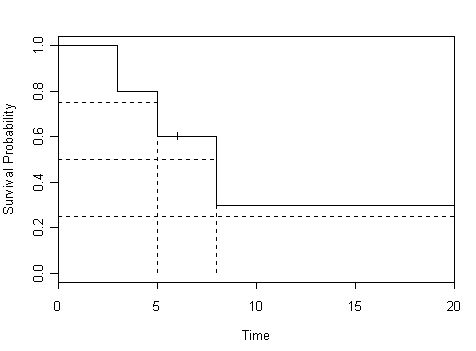
Table 2.5 on page 50, estimating quartiles using the full hmohiv data set. The confidence intervals in the book are calculated based on the standard errors. We write a function called stci for this calculation. Here is the definition of stci:
stci = function(qn, y)
  {
  temp<-data.frame(time=y$time, surv=y$surv, std.err=y$std.err)
  temp$std.err<-temp$std.err*temp$surv
  attach(temp)
  q.lp<-temp[surv<= qn/100 -.05,][1,]
  q<-temp[surv<=qn/100,][1,]
  q.u<-temp[surv>=qn/100+.05,]
  rnm<-nrow(q.u)
  q.up<-q.u[rnm, ]
  fp = (q.up$surv - q.lp$surv)/( q.lp$time - q.up$time)
  std = (q$std.err)/fp
  lower = q$time - 1.96*std
  upper = q$time + 1.96*std
  print(rbind(c(quantile=qn, time=q$time, std.err=std, cie.lower=lower, cie.upper=upper)))
  }
Now we can create the table using this function.
rm(list=ls()) #cleaning up
hmohiv<-read.table("https://stats.idre.ucla.edu/stat/r/examples/asa/hmohiv.csv", sep=",", header = TRUE)
library(survival)
attach(hmohiv)
h.surv <- survfit(Surv(time, censor)~ 1, conf.type="log-log")
stci(75, h.surv)
     quantile time   std.err cie.lower cie.upper
[1,]       75    3 0.5891626  1.845241  4.154759

stci(50, h.surv)
     quantile time  std.err cie.lower cie.upper
[1,]       50    7 1.114345  4.815884  9.184116

/* Note: there is a typo error in the book for the lower value of the confidence interval */

stci(25, h.surv)

quantile time  std.err cie.lower cie.upper
[1,]       25   15 7.451834 0.3944059  29.60559
Table 2.6 on page 52 based on the object h.surv created in previous example.
/* Note: there is a typo error for the upper confidence interval for time 4  */

summary(h.surv)

 time n.risk n.event survival std.err lower 95% CI upper 95% CI
    1    100      15   0.8500  0.0357      0.76359        0.907
    2     83       5   0.7988  0.0402      0.70566        0.865
    3     73      10   0.6894  0.0473      0.58622        0.772
    4     61       4   0.6442  0.0493      0.53868        0.731
    5     56       7   0.5636  0.0517      0.45636        0.658
    6     49       2   0.5406  0.0521      0.43343        0.636
    7     46       6   0.4701  0.0526      0.36440        0.569
    8     39       4   0.4219  0.0525      0.31832        0.522
    9     35       3   0.3857  0.0520      0.28454        0.486
..................more output omitted .........................
The mean of the survivorship function, p. 57 based on h.surv created previously.
print(h.surv, show.rmean=T)

        n    events     rmean se(rmean)    median   0.95LCL   0.95UCL
   100.00     80.00     14.67      1.97      7.00      5.00      9.00
Figure 2.7 on page 58 using hmohiv data set.
timestrata.surv <- survfit( Surv(time, censor)~ strata(drug), hmohiv, conf.type=”log-log”) plot(timestrata.surv, lty=c(1,3), xlab=”Time”, ylab=”Survival Probability”) legend(40, 1.0, c(“Drug – No”, “Drug – Yes”) , lty=c(1,3) )
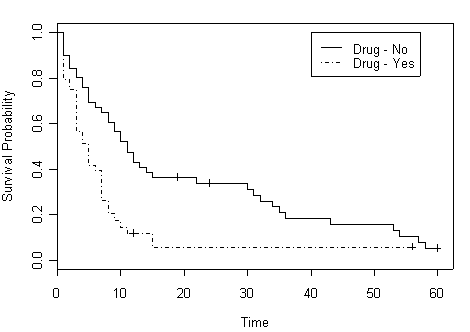
Table 2.8 on page 63, a smaller version of data set hmohiv.
rm(list=ls()) #cleaning up
minitest<-read.table("https://stats.idre.ucla.edu/stat/r/examples/asa/minitest.txt", header = TRUE)
attach(minitest)
minitest
   time censor drug
1     3      1    0
2     4      0    0
3     5      1    0
4    22      1    0
5    34      1    0
6     2      1    1
7     3      1    1
8     4      0    1
9     7      1    1
10   11      1    1
Table 2.9 on page 64 using the data set created in previous example.
Table 2.10 on page 64 testing survivor curves using the minitest data set.
We will use survdiff for tests. Function survdiff is a family of tests parameterized by parameter rho. The following description is from R Documentation on survdiff: “This function implements the G-rho family of Harrington and Fleming (1982, A class of rank test procedures for censored survival data. _Biometrika_ *69*, 553-566.), with weights on each death of S(t)^rho, where S is the Kaplan-Meier estimate of survival. With ‘rho = 0’ this is the log-rank or Mantel-Haenszel test, and with ‘rho = 1’ it is equivalent to the Peto & Peto modification of the Gehan-Wilcoxon test.”
survdiff(Surv(time, censor) ~ drug, data=minitest, rho=0)
       N Observed Expected (O-E)^2/E (O-E)^2/V
drug=0 5        4     5.38     0.353      1.36
drug=1 5        4     2.62     0.724      1.36
Chisq= 1.4 on 1 degrees of freedom, p= 0.243

survdiff(Surv(time, censor) ~ drug, data=minitest, rho=1)
       N Observed Expected (O-E)^2/E (O-E)^2/V
drug=0 5     2.02      2.9     0.267     0.927
drug=1 5     2.88      2.0     0.387     0.927
Chisq= 0.9 on 1 degrees of freedom, p= 0.336
Table 2.11 on page 65 testing for differences between drug group.
rm(list=ls()) #cleaning up
hmohiv<-read.table("https://stats.idre.ucla.edu/stat/r/examples/asa/hmohiv.csv", sep=",", header = TRUE)
attach(hmohiv)

survdiff(Surv(time, censor) ~ drug, rho=0)
        N Observed Expected (O-E)^2/E (O-E)^2/V
drug=0 51       42     54.9      3.02      11.9
drug=1 49       38     25.1      6.60      11.9
Chisq= 11.9 on 1 degrees of freedom, p= 0.000575

survdiff(Surv(time, censor) ~ drug, data=hmohiv, rho=1)
        N Observed Expected (O-E)^2/E (O-E)^2/V
drug=0 51     20.0     29.3      2.94      11.7
drug=1 49     27.7     18.4      4.69      11.7
Chisq= 11.7 on 1 degrees of freedom, p= 0.000622
Table 2.12 on page 65. We will create a categorical age variable, agecat first.
agecat

                                n events median 0.95LCL 0.95UCL
strata(agecat)=agecat=(19.9,29] 12      8     43       5     Inf
strata(agecat)=agecat=(29,34]   34     29      9       6      12
strata(agecat)=agecat=(34,39]   25     20      7       3       9
strata(agecat)=agecat=(39,54.1] 29     23      4       2       5
Figure 2.8 on page 69 using hmohiv data set with the four age groups created in the previous example.
plot(age.surv, lty=c(6, 1, 4, 3), xlab="Time", ylab="Survival Probability")
legend(40, 1.0, c("Group 1", "Group 2", "Group 3", "Group 4"), lty=c(6, 1, 4, 3))
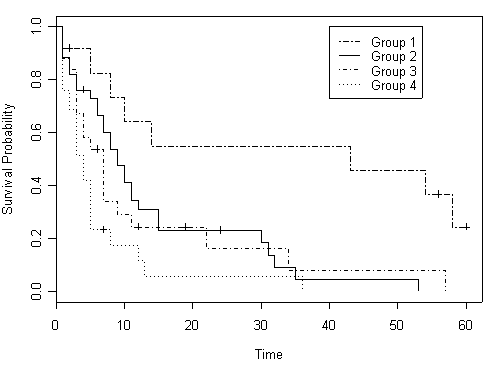
Table 2.14 on page 70, test on survivor curves.
survdiff(Surv(time, censor) ~ agecat, rho=0)
                        N Observed Expected (O-E)^2/E (O-E)^2/V
agecat=19.9+ thru 29.0 12        8     19.9   7.10608   12.4419
agecat=29.0+ thru 34.0 34       29     29.4   0.00641    0.0117
agecat=34.0+ thru 39.0 25       20     17.8   0.26894    0.3834
agecat=39.0+ thru 54.1 29       23     12.9   7.98170   11.1799
Chisq= 19.9 on 3 degrees of freedom, p= 0.000178

survdiff(Surv(time, censor) ~ agecat, data=hmohiv, rho=1)
                        N Observed Expected (O-E)^2/E (O-E)^2/V
agecat=19.9+ thru 29.0 12     3.05     8.37    3.3859     7.225
agecat=29.0+ thru 34.0 34    15.11    18.21    0.5267     1.320
agecat=34.0+ thru 39.0 25    12.48    11.48    0.0872     0.172
agecat=39.0+ thru 54.1 29    17.06     9.64    5.7134    10.355
Chisq= 15.4 on 3 degrees of freedom, p= 0.00154
Fig. 2.9 and table 2.16 are not reproduced since we don’t have the data set.
Table 2.17 on page 76 to calculate the Nelson-Aalen estimator of the survivorship function for hmohiv data. The easiest way to get Nelson-Aalen estimator is via cox regression using coxph function.
a<- survfit(coxph(Surv(time,censor)~1), type="aalen")
summary(a)

 time n.risk n.event survival std.err lower 95% CI upper 95% CI
    1    100      15   0.8607  0.0333       0.7978        0.929
    2     83       5   0.8104  0.0382       0.7388        0.889
    3     73      10   0.7066  0.0453       0.6233        0.801
    4     61       4   0.6618  0.0476       0.5747        0.762
   ............................................................
   54      6       1   0.0897  0.0350       0.0417        0.193
   57      4       1   0.0698  0.0324       0.0281        0.173
   58      3       1   0.0500  0.0286       0.0163        0.153
With object a we can create Table 2.17 as follows.
h.aalen<-(-log(a$surv))
aalen.est<-cbind(time=a$time, d=a$n.event, n=a$n.risk,
                 h.aalen, s1=a$surv)
b<-survfit(Surv(time, censor)~1)
km.est<-cbind(time=b$time, s2=b$surv)
all<-merge(data.frame(aalen.est), data.frame(km.est), by="time")
all
   time  d   n   h.aalen         s1         s2
1     1 15 100 0.1500000 0.86070798 0.85000000
2     2  5  83 0.2102410 0.81038895 0.79879518
3     3 10  73 0.3472273 0.70664471 0.68937118
4     4  4  61 0.4128010 0.66179394 0.64416652
5     5  7  56 0.5378010 0.58403110 0.56364570
6     6  2  49 0.5786174 0.56067304 0.54063975
7     7  6  46 0.7090521 0.49211043 0.47012153
8     8  4  39 0.8116162 0.44413965 0.42190393
9     9  3  35 0.8973305 0.40765643 0.38574074
10   10  3  32 0.9910805 0.37117541 0.34957754
11   11  3  28 1.0982234 0.33346299 0.31212281
12   12  2  25 1.1782234 0.30782514 0.28715298
13   13  1  21 1.2258424 0.29351033 0.27347903
14   14  1  20 1.2758424 0.27919566 0.25980508
15   15  2  19 1.3811056 0.25130056 0.23245718
16   22  1  16 1.4436056 0.23607503 0.21792860
17   30  1  14 1.5150342 0.21980067 0.20236227
18   31  1  13 1.5919572 0.20352687 0.18679595
19   32  1  12 1.6752906 0.18725376 0.17122962
20   34  1  11 1.7661997 0.17098154 0.15566329
21   35  1  10 1.8661997 0.15471050 0.14009696
22   36  1   9 1.9773108 0.13844104 0.12453063
23   43  1   8 2.1023108 0.12217379 0.10896430
24   53  1   7 2.2451679 0.10590975 0.09339797
25   54  1   6 2.4118346 0.08965067 0.07783164
26   57  1   4 2.6618346 0.06982001 0.05837373
27   58  1   3 2.9951679 0.05002823 0.03891582
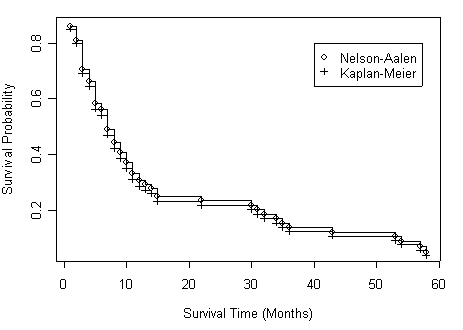
Figure 2.10 on page 77 based on the output from previous example.
plot(all$time, all$s1, type="s", xlab="Survival Time (Months)",
     ylab="Survival Probability")
points(all$time, all$s1, pch=1)
lines(all$time, all$s2, type="s")
points(all$time, all$s2, pch=3)
legend(40, .8, c("Nelson-Aalen", "Kaplan-Meier"), pch=c(1, 3))
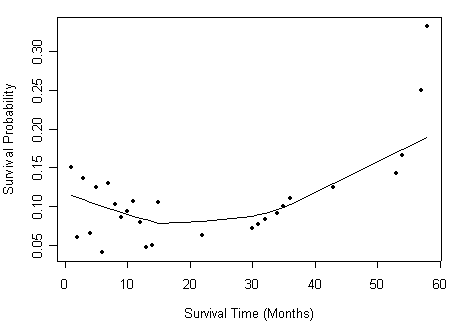
Figure 2.12 on page 82 based on the data set created from previous example.
h2<-all$d/all$n
plot.new()
plot(all$time, h2, type="p", pch=20, xlab="Survival Time (Months)",
     ylab="Hazard Ratio")
lines(lowess(all$time, h2,f=.75, iter=5))

