library(foreign)
library(lme4)
Table 2.1 on page 17 using the popular dataset.
Part 1: Intercept only.
popdata<-read.dta("https://stats.idre.ucla.edu/stat/stata/examples/mlm_ma_hox/popular.dta")

m2.1.1<-lmer(popular ~ (1|school), popdata)
summary(m2.1.1)

Linear mixed model fit by REML
Formula: popular ~ (1 | school)
   Data: popdata
  AIC  BIC logLik deviance REMLdev
 5122 5138  -2558     5113    5116
Random effects:
 Groups   Name        Variance Std.Dev.
 school   (Intercept) 0.87981  0.93798
 Residual             0.63868  0.79917
Number of obs: 2000, groups: school, 100

Fixed effects:
            Estimate Std. Error t value
(Intercept)   5.3076     0.0955   55.58
Part 2: intercept plus pupil level variables
m2.1.2<-lmer(popular ~ sex + texp +(1 + sex|school), popdata)
summary(m2.1.2)

Linear mixed model fit by REML
Formula: popular ~ sex + texp + (1 + sex | school)
   Data: popdata
  AIC  BIC logLik deviance REMLdev
 4290 4329  -2138     4261    4276
Random effects:
 Groups   Name        Variance Std.Dev. Corr
 school   (Intercept) 0.41158  0.64155
          sexgirl     0.27329  0.52278  0.062
 Residual             0.39248  0.62648
Number of obs: 2000, groups: school, 100

Fixed effects:
            Estimate Std. Error t value
(Intercept)  3.34001    0.16079   20.77
sexgirl      0.84315    0.05969   14.13
texp         0.10835    0.01022   10.61

Correlation of Fixed Effects:
        (Intr) sexgrl
sexgirl -0.020
texp    -0.908  0.000
Table 2.2 on page 20, part 2 (first part is part 2 of Table 2.1)
m2.2.2

Linear mixed model fit by REML
Formula: popular ~ texp + sex + texp * sex + (1 + sex | school)
   Data: popdata
  AIC  BIC logLik deviance REMLdev
 4284 4329  -2134     4246    4268
Random effects:
 Groups   Name        Variance Std.Dev. Corr
 school   (Intercept) 0.41198  0.64186
          sexgirl     0.22641  0.47582  0.077
 Residual             0.39241  0.62643
Number of obs: 2000, groups: school, 100

Fixed effects:
              Estimate Std. Error t value
(Intercept)   3.313521   0.161017  20.579
texp          0.110235   0.010232  10.773
sexgirl       1.329594   0.133052   9.993
texp:sexgirl -0.034035   0.008457  -4.024

Correlation of Fixed Effects:
            (Intr) texp   sexgrl
texp        -0.909
sexgirl     -0.046  0.042
texp:sexgrl  0.042 -0.046 -0.908
Table 2.3 on page 21, part 2 (first part is part 2 of Table 2.2)
attach(popdata)
sex01 <- (sex=="girl")
zsex <- (sex01-mean(sex01))/sd(sex01)
ztexp <- (texp - mean(texp))/sd(texp)
zpop <- (popular - mean(popular))/sd(popular)

m2.3.2 <-lmer(zpop ~ ztexp + zsex + (1 + zsex | school))
summary(m2.3.2)

Linear mixed model fit by REML
Formula: zpop ~ ztexp + zsex + (1 + zsex | school)
  AIC  BIC logLik deviance REMLdev
 3474 3513  -1730     3446    3460
Random effects:
 Groups   Name        Variance Std.Dev. Corr
 school   (Intercept) 0.330522 0.57491
          zsex        0.045453 0.21320  0.418
 Residual             0.261151 0.51103
Number of obs: 2000, groups: school, 100

Fixed effects:
             Estimate Std. Error t value
(Intercept) -0.009779   0.058669  -0.167
ztexp        0.579071   0.054596  10.606
zsex         0.343852   0.024341  14.126

Correlation of Fixed Effects:
      (Intr) ztexp
ztexp -0.005
zsex   0.359  0.000
Figure 2.1 on page 23.
linres
Figure 2.2 on page 24.
linp
Figure 2.3 on page 24.
re
plot(x = smeans, y = randslopes, pch = 'x', xlab = "Predicted Values", ylab = "(sex)")
abline(a = 0, b = 0)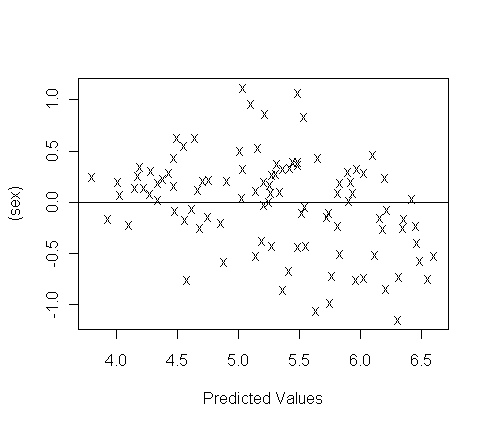
Figure 2.4 on page 25–we have skipped this figure for now.
Figure 2.6 on page 28–we have skipped this figure for now.