The R program for chapter 14.
Creating the hypothetical data set of pairs of data from a multivariate normal distribution with N(100, 100), N(50, 50) and rho=0.707.
rm2 <- rmvnorm(100, mean=c(100, 50), cov=matrix(c(100, 50, 50, 50), 2))
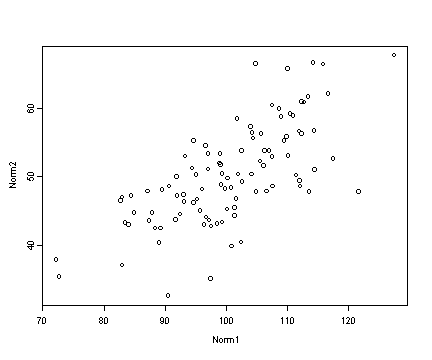
Fig. 14.1, p. 371.
Scatterplot of Norm1 versus Norm2.
plot(rm2[, 1], rm2[, 2], xlab="Norm1", ylab="Norm2")
Table 14.1, p. 372.
Sample statistics for the hypothetical data set.
apply( rm2, 2, mean)
[1] 100.52162  50.18179

apply( rm2, 2, stdev)
[1] 10.304296  7.183615

apply( rm2, 2, var)
[1] 106.17852  51.60432

cor(rm2)
          [,1]      [,2]
[1,] 1.0000000 0.6914247
[2,] 0.6914247 1.0000000
Principal components, middle p. 373.
pr1 <- princomp(rm2)
loadings(pr1)

   Comp.1 Comp.2
X1 -0.857  0.515
X2 -0.515 -0.857

#eigenvalues:
pr1.eigen <- pr1$sdev^2
print(pr1.eigen)

   Comp.1   Comp.2
 135.5229 20.68208
Creating a subset of the depression data set. To minimize the typing we will attach the depression data set and after creating the subset we will detach it.
attach(depress)
cesd.subset <- data.frame(c1, c2, c3, c4, c5, c6, c7, c8, c9, c10,
c11, c12, c13, c14, c15, c16, c17, c18, c19, c20)
detach(depress)
Creating the data set std.cesd which contains the standardizing the variables c1-c20 from the cesd.subset data set because the princomp function does not automatically standardize the variables.
std.cesd <- cesd.subset
std.cesd$c1 <- cesd.subset$c1/stdev(cesd.subset$c1)
std.cesd$c2 <- cesd.subset$c2/stdev(cesd.subset$c2)
std.cesd$c3 <- cesd.subset$c3/stdev(cesd.subset$c3)
std.cesd$c4 <- cesd.subset$c4/stdev(cesd.subset$c4)
std.cesd$c5 <- cesd.subset$c5/stdev(cesd.subset$c5)
std.cesd$c6 <- cesd.subset$c6/stdev(cesd.subset$c6)
std.cesd$c7 <- cesd.subset$c7/stdev(cesd.subset$c7)
std.cesd$c8 <- cesd.subset$c8/stdev(cesd.subset$c8)
std.cesd$c9 <- cesd.subset$c9/stdev(cesd.subset$c9)
std.cesd$c10 <- cesd.subset$c10/stdev(cesd.subset$c10)

std.cesd$c11 <- cesd.subset$c11/stdev(cesd.subset$c11)
std.cesd$c12 <- cesd.subset$c12/stdev(cesd.subset$c12)
std.cesd$c13 <- cesd.subset$c13/stdev(cesd.subset$c13)
std.cesd$c14 <- cesd.subset$c14/stdev(cesd.subset$c14)
std.cesd$c15 <- cesd.subset$c15/stdev(cesd.subset$c15)
std.cesd$c16 <- cesd.subset$c16/stdev(cesd.subset$c16)
std.cesd$c17 <- cesd.subset$c17/stdev(cesd.subset$c17)
std.cesd$c18 <- cesd.subset$c18/stdev(cesd.subset$c18)
std.cesd$c19 <- cesd.subset$c19/stdev(cesd.subset$c19)
std.cesd$c20 <- cesd.subset$c20/stdev(cesd.subset$c20)
Table 14.2, p. 380.
Principal component analysis for the standardized CESD scale items.
pr.std <- princomp(std.cesd)
pr.std$coef

<output omitted>

    Comp.1 Comp.2 Comp.3 Comp.4 Comp.5 Comp.6 Comp.7 Comp.8 Comp.9 Comp.10
 c1  0.277  0.145                       0.119 -0.120  0.181 -0.388  0.197
 c2  0.313               -0.248        -0.101 -0.131        -0.114
 c3  0.268  0.155        -0.247 -0.218        -0.109 -0.111  0.246 -0.393
 c4  0.244  0.319  0.177        -0.173  0.141         0.153 -0.128  0.410
 c5  0.287         0.138 -0.279
 c6  0.221         0.224 -0.182 -0.340  0.151  0.255  0.274        -0.339
 c7  0.284  0.164                                           -0.196
 c8  0.108  0.305  0.110  0.557        -0.321  0.381        -0.115 -0.374
 c9  0.176  0.169 -0.396         0.535 -0.127               -0.136 -0.120
c10  0.277                       0.365                0.163  0.233
c11  0.243  0.105 -0.131         0.242                0.124  0.364
c12  0.179 -0.230  0.163 -0.145        -0.367  0.461 -0.304  0.254  0.391
c13  0.126 -0.213  0.265  0.540         0.191 -0.452         0.302
c14  0.180 -0.401 -0.101  0.246                0.171  0.508  0.229
c15  0.200 -0.210  0.270               -0.390 -0.356 -0.288
c16  0.192 -0.417 -0.185               -0.202               -0.305 -0.200
c17  0.210 -0.390                       0.318  0.204        -0.382
c18  0.172         0.202         0.275  0.550  0.292 -0.474
c19  0.131        -0.633        -0.335  0.158 -0.117 -0.316  0.162
c20  0.236  0.228 -0.193  0.240 -0.291               -0.177  0.102  0.375

#Eigenvalues:
pr.std.eigen <- pr.std$sdev^2
print(pr.std.eigen)

  Comp.1   Comp.2   Comp.3  Comp.4   Comp.5  Comp.6    Comp.7    Comp.8
 7.03142 1.480516 1.227321 1.06206 1.009188 0.96417 0.9435959 0.7666211

#Correlations:
r.pr <- 0.5/sqrt(pr.std.eigen)
print(r.pr)

   Comp.1    Comp.2    Comp.3    Comp.4    Comp.5    Comp.6   Comp.7
 0.1885595 0.4109258 0.4513266 0.4851717 0.4977186 0.5092056 0.514727
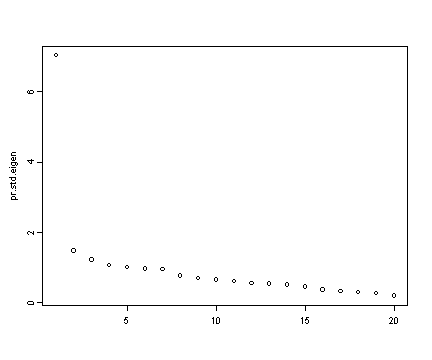
Fig. 14.5, p. 381
Eigenvalues.
plot(pr.std.eigen)


