Figure 1.1
n <- length(levels(barley$year))
dotplot(variety ~ yield | site, data = barley, groups = year,
  panel = function(x, y, ...) {
    dot.line <- trellis.par.get("dot.line")
    abline(h = y, lwd = dot.line$lwd, lty = dot.line$lty, col = dot.line$col)
    panel.superpose(x, y, ...)
  },
  layout = c(1, 6), aspect = .5, sub = list("Figure 1.1",cex=.8),
  xlab = "Barley Yield (bushels/acre)",
  key = list(points = Rows(trellis.par.get("superpose.symbol"), 1:n),
    text = list(levels(barley$year)), columns = n))
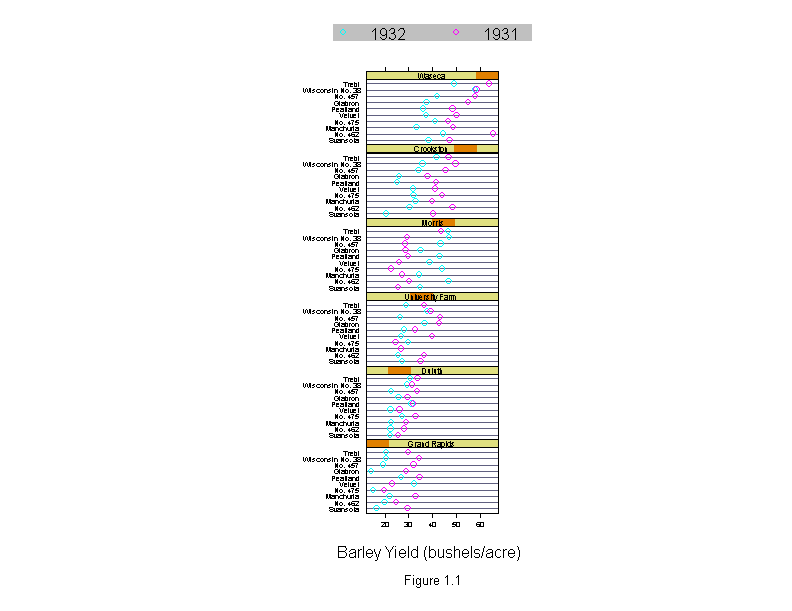
Figure 1.2
histogram(~ height | voice.part, data = singer, nint = 17, endpoints = c(59.5, 76.5),
            layout = c(2, 4), aspect = 1, sub = list("Figure 1.2",cex=.8),
            xlab = "Height (inches)")
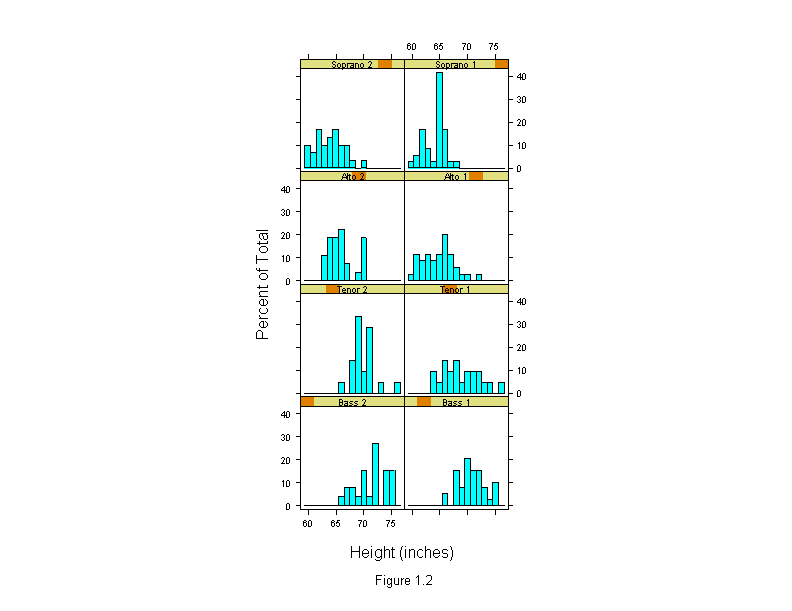
Figure 1.3
xyplot(babinet ~ concentration, data = polarization, aspect = 1,
       sub = list("Figure 1.3",cex=.8), xlab = "Concentration (micrograms per cubic meter)",
       ylab = "Babinet Point (degrees)")
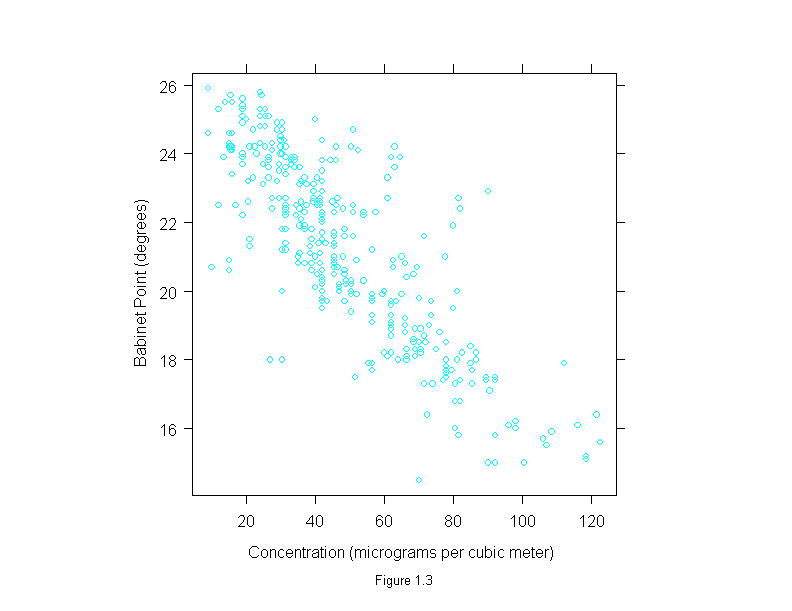
Figure 1.4
xyplot(NOx ~ E, data = ethanol, aspect = 1, sub = list("Figure 1.4",cex=.8),
       xlab= "E", ylab= "Oxides of Nitrogenn(micrograms/J)")
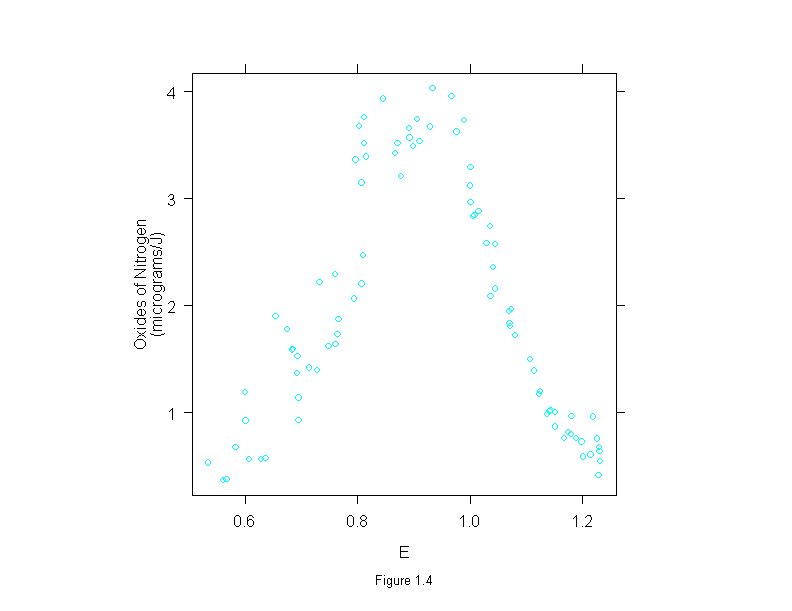
Figure 1.5
xyplot(NOx ~ C, data = ethanol, aspect = 1, sub = list("Figure 1.5",cex=.8),
       xlab= "C", ylab= "Oxides of Nitrogenn(micrograms/J)")
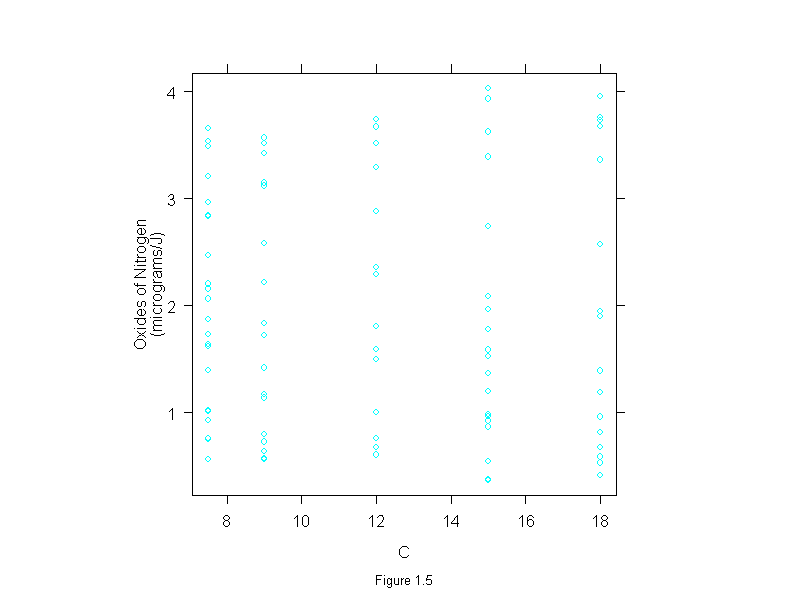
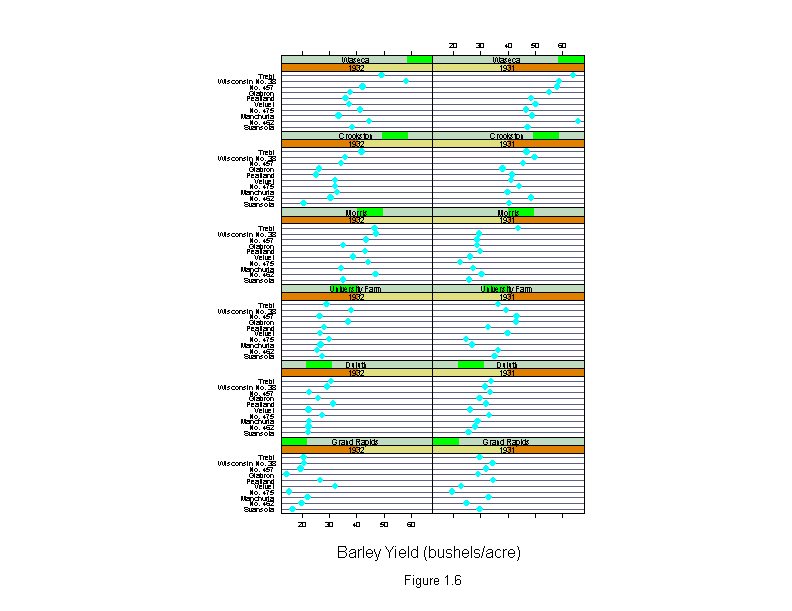
Figure 1.6
dotplot( variety ~ yield | year * site, data = barley, aspect = .4,
         sub = list("Figure 1.6",cex=.8), xlab = "Barley Yield (bushels/acre)")
