Figure 2.1
qqmath(~ height | voice.part,
  distribution=qunif,
  data=singer,
  panel = function(x, y) {
    panel.grid()
    panel.xyplot(x, y)
  },
  layout=c(2,4),
  aspect=1,
  sub = list("Figure 2.1",cex=.8),
  xlab = "f-value",
  ylab="Height (inches)")
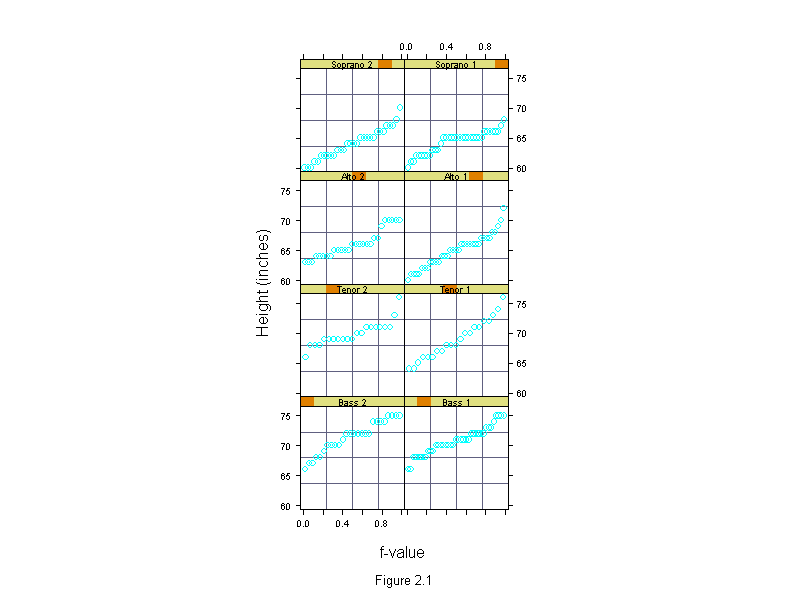
Figure 2.2
qqmath(~ sort(singer$height[singer$voice.part=="Tenor 1"]),
  distribution = qunif,
  panel = function(x, y) {
    panel.qqmath(c(0, x, 1), c(min(y), y, max(y)), type = "l")
    panel.qqmath(x, y, col = 0, pch = 16)
    panel.qqmath(x, y)
  },
  aspect = 1,
  sub = list("Figure 2.2",cex=.8),
  xlab = "f-value",
  ylab = "Tenor 1 Height (inches)")
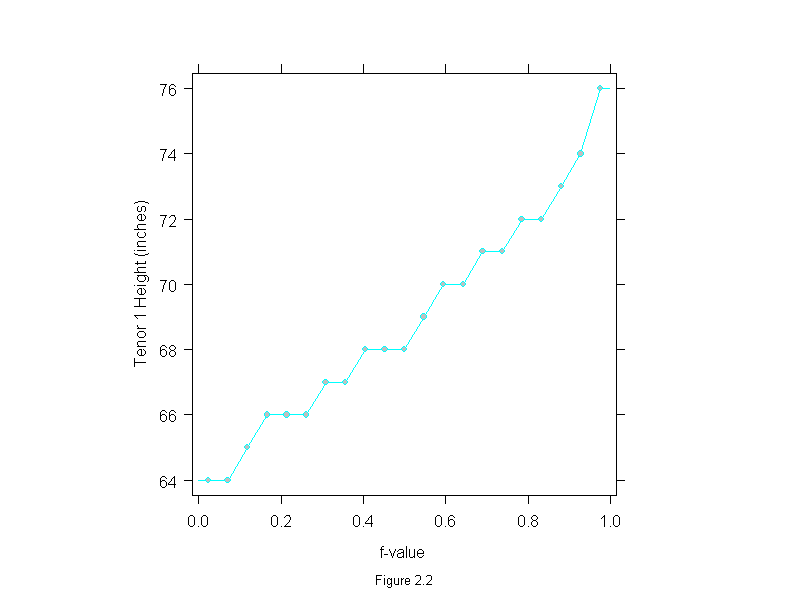
Figure 2.3
voice.part <- ordered(singer$voice.part,
  c("Soprano 1", "Soprano 2", "Alto 1", "Alto 2",
    "Tenor 1", "Tenor 2", "Bass 1", "Bass 2"))
qq(voice.part ~ singer$height,
  subset=voice.part=="Bass 2" | voice.part=="Tenor 1",
  aspect=1,
  sub = list("Figure 2.3",cex=.8),
  xlab = "Tenor 1 Height (inches)",
  ylab = "Base 2 Height (inches)")
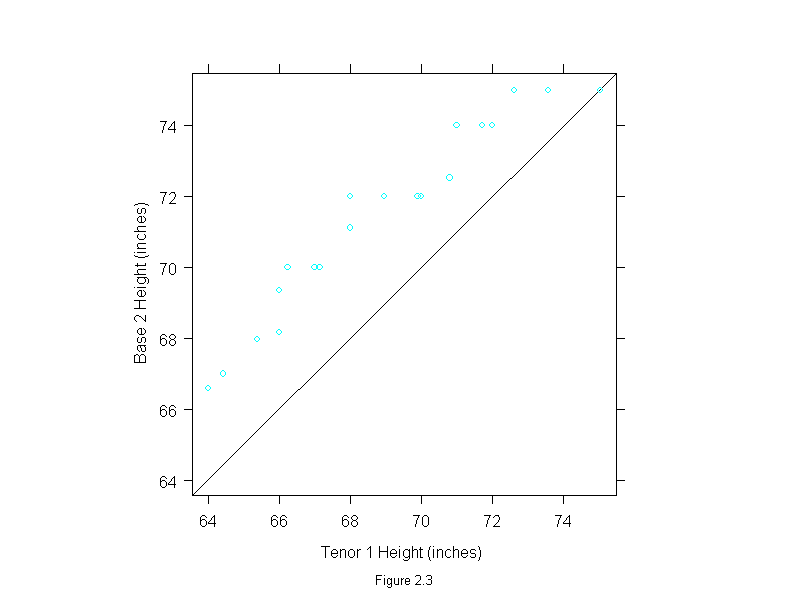
Figure 2.4
voice.part <- ordered(singer$voice.part,
  c("Soprano 1", "Soprano 2", "Alto 1", "Alto 2",
    "Tenor 1", "Tenor 2", "Bass 1", "Bass 2"))
bass.tenor.qq <- qq(voice.part ~ singer$height,
  subset=voice.part=="Bass 2" | voice.part=="Tenor 1")
tmd(bass.tenor.qq,
  aspect=1,
  ylab = "Difference (inches)",
  sub = list("Figure 2.4",cex=.8),
  xlab = "Mean (inches)")
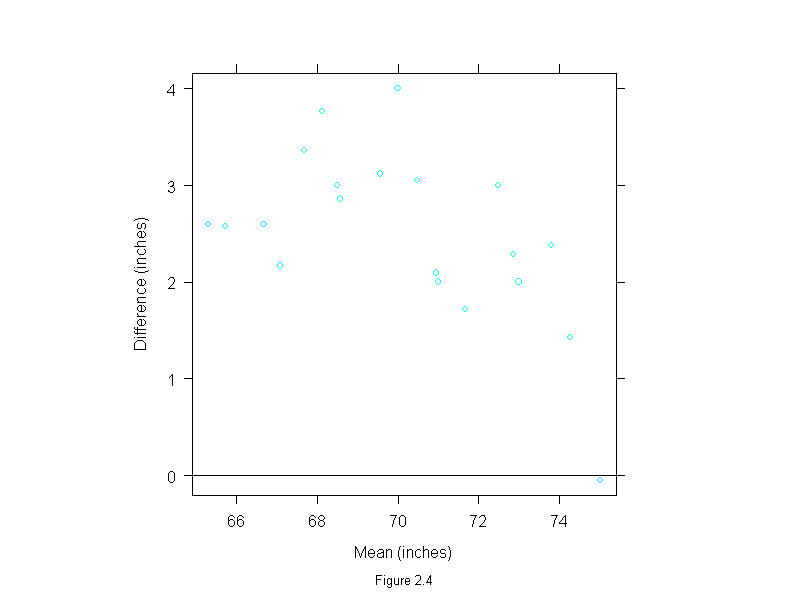
Figure 2.5 missing
Figure 2.6
oldpty <- par("pty")
par(pty = "s")
data <-
c(0.9, 1.6, 2.26305, 2.55052, 2.61059, 2.69284, 2.78511, 2.80955,
  2.94647, 2.96043, 3.05728, 3.15748, 3.18033, 3.20021,
  3.20156, 3.24435, 3.33231, 3.34176, 3.3762, 3.39578, 3.4925,
  3.55195, 3.56207, 3.65149, 3.72746, 3.73338, 3.73869,
  3.80469, 3.85224, 3.91386, 3.93034, 4.02351, 4.03947,
  4.05481, 4.10111, 4.26249, 4.28782, 4.37586, 4.48811,
  4.6001, 4.65677, 4.66167, 4.73211, 4.80803, 4.9812, 5.17246,
  5.3156, 5.35086, 5.36848, 5.48167, 5.68, 5.98848, 6.2, 7.1,
  7.4)
boxplot(data, rep(NA, length(data)), ylab = "Data")
usr <- par("usr")
x <- usr[1] + (usr[2] - usr[1]) * 0.5
at <- c(0.9, 1.6, 3.2, 3.8, 4.65, 6.2, 7.2)
arrows(rep(x * 1.15, 7), at, rep(x, 7), at)
mtext("Figure 2.6",1,1,cex=.8)
text(rep(x * 1.2, 7), at, adj = 0,
  labels = c("outside value", "lower adjacent value",
    "lower quartile", "median", "upper quartile",
    "upper adjacent value", "outside values"))
par(pty = oldpty)
invisible()
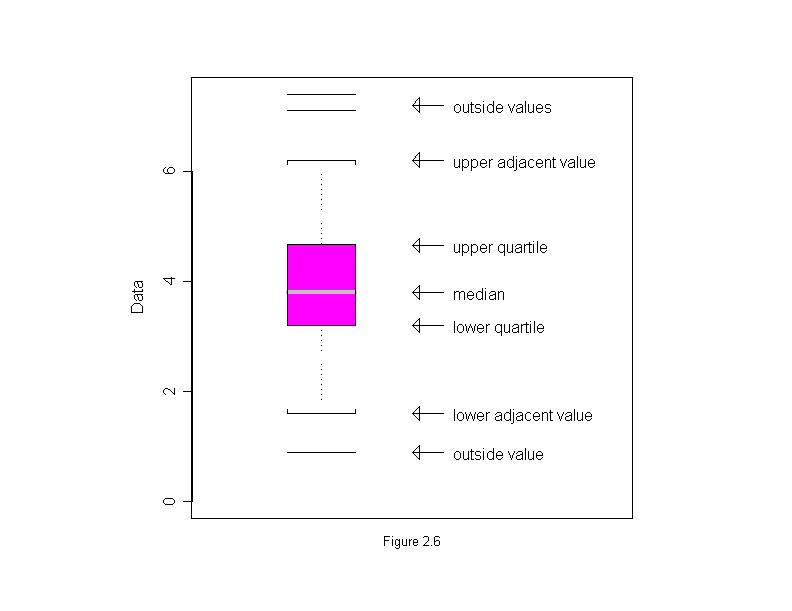
Figure 2.7
data <- round(c(0.9, 1.6, 2.263047,
  2.550518, 2.610592, 2.69284, 2.785113,
  2.809547, 2.946467, 2.96044, 3.057283,
  3.15748, 3.180327, 3.200206,
  3.20156, 3.244347, 3.332312,
  3.341763, 3.3762, 3.395778, 3.492497,
  3.551945, 3.562066, 3.65149,
  3.7274632, 3.73338, 3.738686, 3.80469,
  3.85224, 3.91386, 3.93034,
  4.02351, 4.039466, 4.05481, 4.101108, 4.262486,
  4.28782, 4.375864, 4.48811, 4.6001,
  4.656775, 4.661673, 4.73211,
  4.80803, 4.9812, 5.172464,
  5.3156, 5.35086, 5.36848,
  5.48167, 5.68, 5.98848, 6.2,
  7.1, 7.4),5)
uq <- quantile(data,.75)
lq <- quantile(data,.25)
r <- 1.5*(uq-lq)
h <- c(lq-r,1.6,lq,uq,6.2,uq+r)
writing <- c("lower quartile - 1.5 r",
  "lower adjacent value",
  "lower quartile",
  "upper quartile",
   "upper adjacent value",
   "upper quartile + 1.5 r")
qqmath(~ data,
  distribution = qunif,
  panel = substitute(function(x, y) {
    reference.line <- trellis.par.get("reference.line")
    panel.abline(h = h, lwd = reference.line$lwd, lty = reference.line$lty, col = reference.line$col)
    panel.qqmath(x, y, col = 0, pch = 16)
    panel.qqmath(x, y)
    text(rep(0,3), h[4:6], writing[4:6], adj=0)
    text(rep(1,3), h[1:3], writing[1:3], adj=1)
  }),
  aspect = 1,
  sub = list("Figure 2.7",cex=.8),
  xlab = "f-value",
  ylab = "Data")
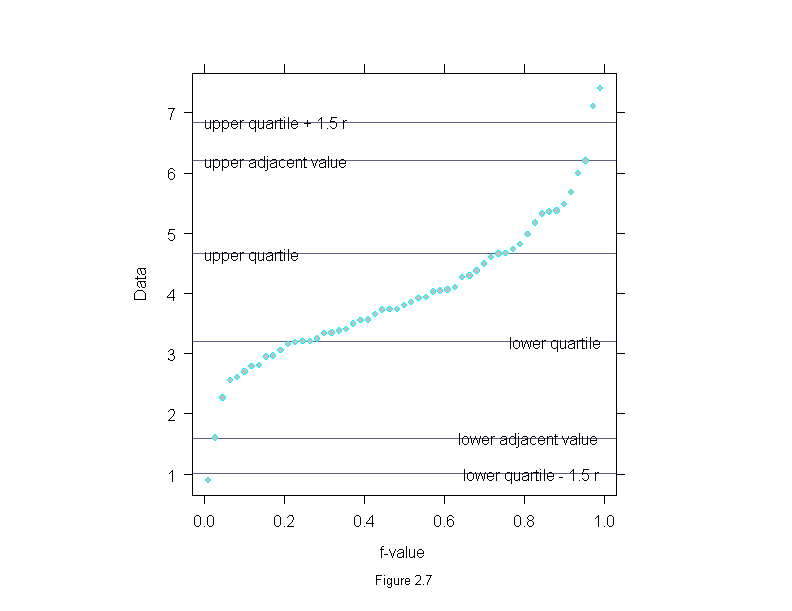
Figure 2.8
bwplot(voice.part ~ height,
  data=singer,
  aspect=1,
  sub = list("Figure 2.8",cex=.8),
  xlab="Height (inches)")
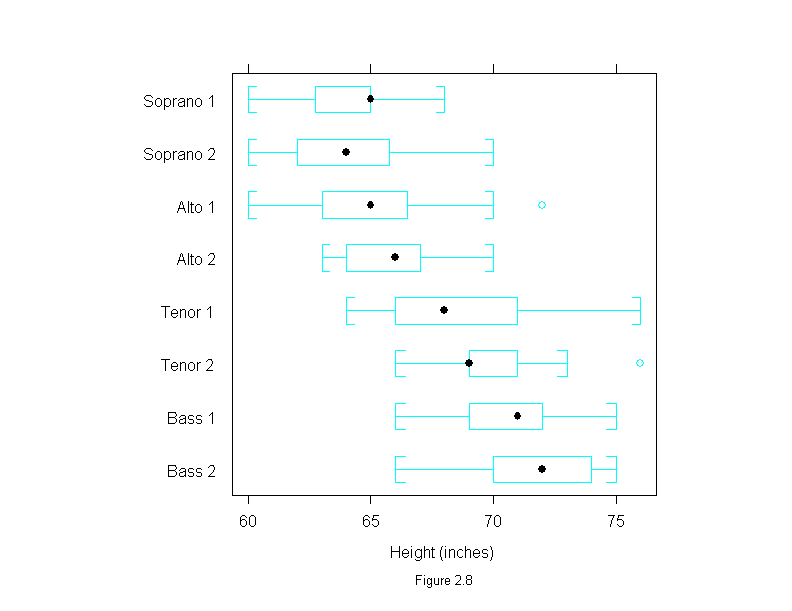
Figure 2.9
data <- sort(singer$height[singer$voice.part=="Alto 1"])
qqmath(~ data,
  distribution = qunif,
  panel = function(x, y) {
    panel.grid()
    panel.qqmath(c(0, x, 1), c(min(y), y, max(y)), type = "l")
    panel.qqmath(x, y, col = 0, pch = 16)
    panel.qqmath(x, y)
  },
  aspect = 1,
  ylim = range(data, qnorm(ppoints(data), mean(data), sqrt(var(data)))),
  sub = list("Figure 2.9",cex=.8),
  xlab = "f-value",
  ylab = "Alto 1 Height (inches)")
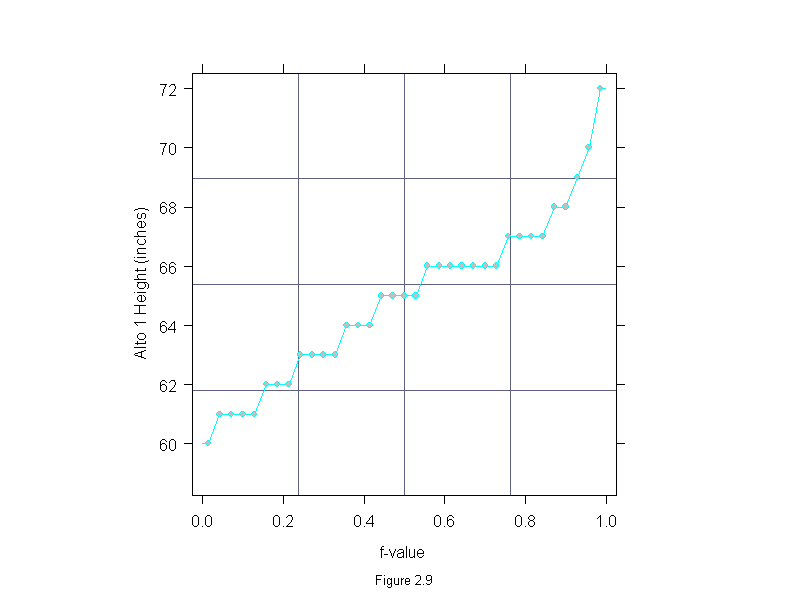
Figure 2.10
data <- sort(singer$height[singer$voice.part=="Alto 1"])
x <- ppoints(data)
y <- qnorm(x, mean(data), sqrt(var(data)))
xyplot(y ~ x,
  panel = function(x, y){
    panel.grid()
    panel.xyplot(x, y, type = "l")
  },
  ylim = range(data, y),
  aspect = 1,
  sub = list("Figure 2.10",cex=.8),
  xlab = "f-value",
  ylab = "Normal Quantile Function")
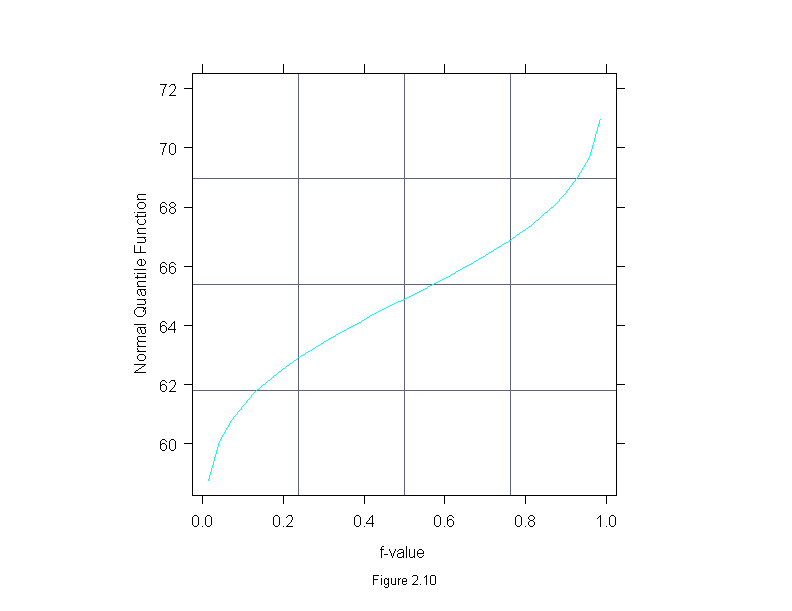
Figure 2.11
qqmath(~ height | voice.part,
  data=singer,
  prepanel = prepanel.qqmathline,
  panel = function(x, y) {
    panel.grid()
    panel.qqmathline(y, distribution = qnorm)
    panel.qqmath(x, y)
  },
  layout=c(2,4),
  aspect=1,
  sub = list("Figure 2.11",cex=.8),
  xlab = "Unit Normal Quantile",
  ylab="Height (inches)")
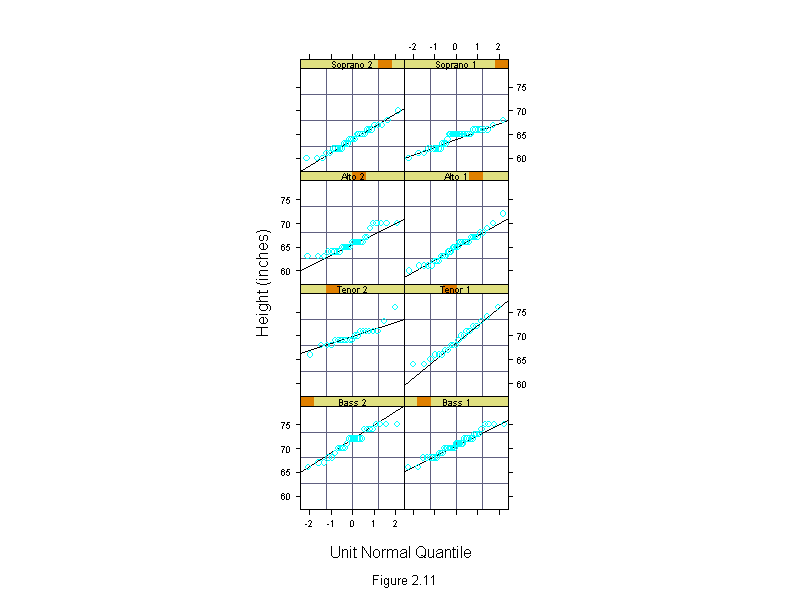
Figure 2.12
dotplot(tapply(singer$height,singer$voice.part,mean),
  aspect=1,
  sub = list("Figure 2.12",cex=.8),
  xlab="Mean Height (inches)")
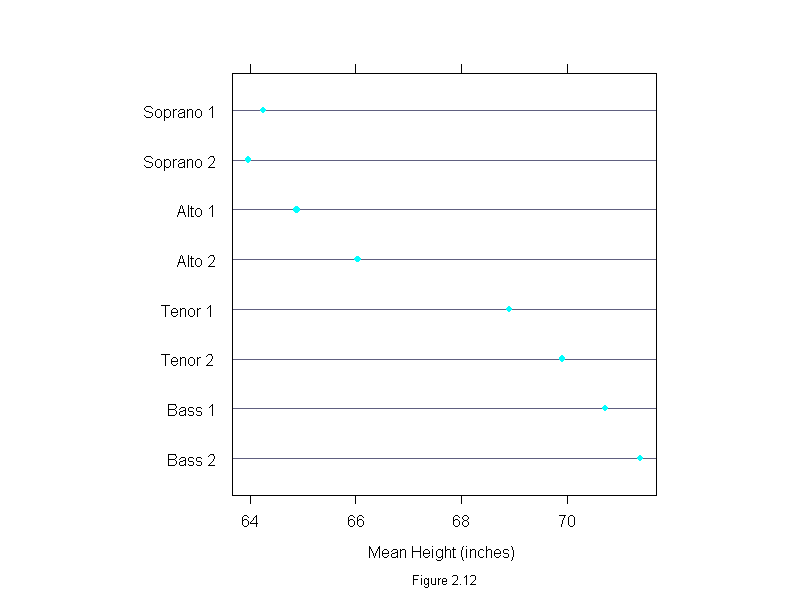
Figure 2.13
bwplot(voice.part ~ oneway(height~voice.part, spread = 1)$residuals,
  data = singer,
  aspect=0.75,
  panel = function(x,y){
    panel.bwplot(x,y)
    panel.abline(v=0)
  },
  sub = list("Figure 2.13",cex=.8),
  xlab = "Residual Height (inches)")
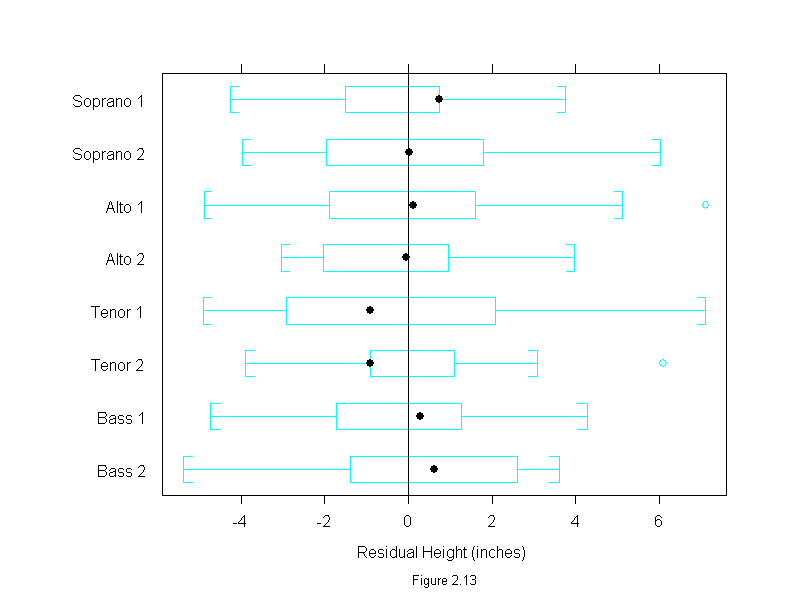
Figure 2.14
res.height <- oneway(height ~ voice.part, data = singer, spread = 1)$residuals
qqmath(~ res.height | singer$voice.part,
  distribution = substitute(function(p) quantile(res.height, p)),
  panel=function(x,y){
    panel.grid()
    panel.abline(0, 1)
    panel.qqmath(x, y)
  },
  aspect=1,
  layout=c(2,4),
  sub = list("Figure 2.14",cex=.8),
  xlab = "Pooled Residual Height (inches)",
  ylab = "Residual Height (inches)")
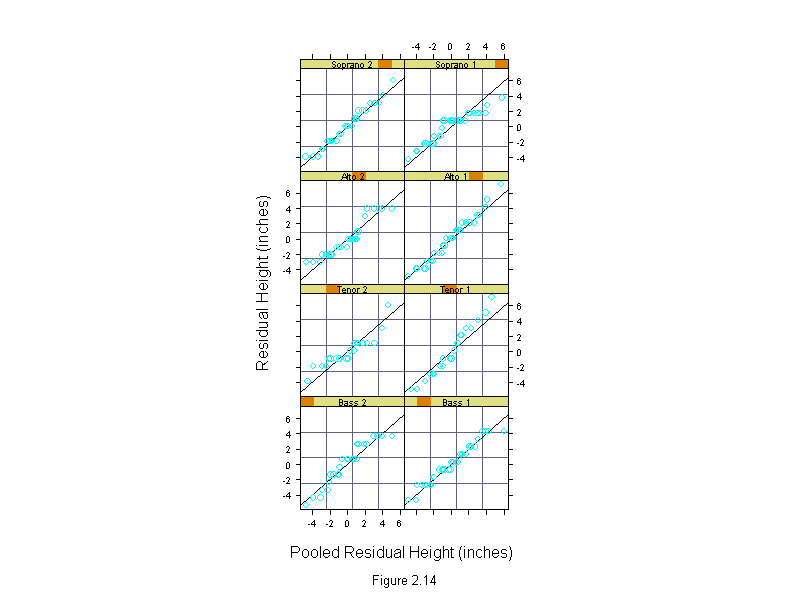
Figure 2.15
qqmath(~ oneway(height ~ voice.part, spread = 1)$residuals,
  data = singer,
  distribution = qunif,
  aspect = 1,    sub = list("Figure 2.15",cex=.8),
  xlab = "f-value",
  ylab = "Residual Height (inches)")
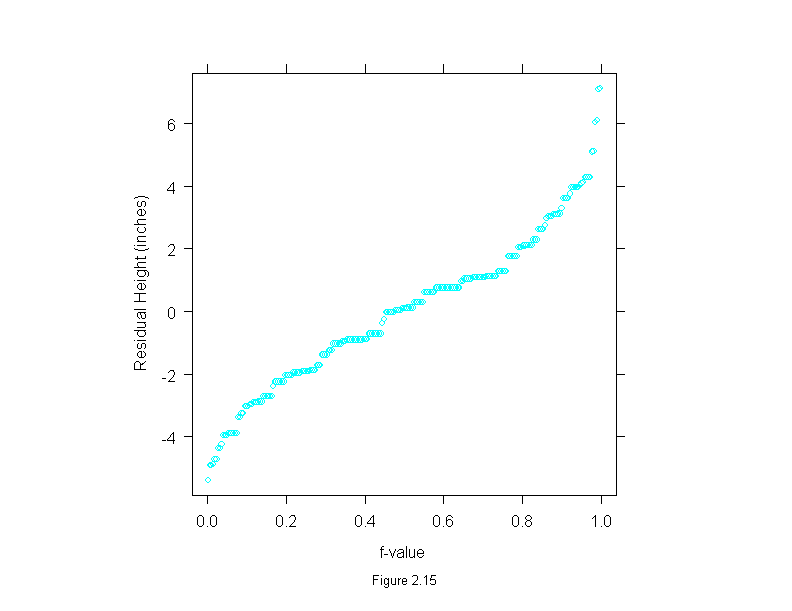
Figure 2.16
qqmath(~ oneway(height~voice.part, spread = 1)$residuals,
  data = singer,
  prepanel = prepanel.qqmathline,
  panel = function(x, y) {
    panel.qqmathline(y, distribution = qnorm)
    panel.qqmath(x, y)
  },
  aspect=1,
  sub = list("Figure 2.16",cex=.8),
  xlab = "Unit Normal Quantile",
  ylab="Residual Height (inches)")
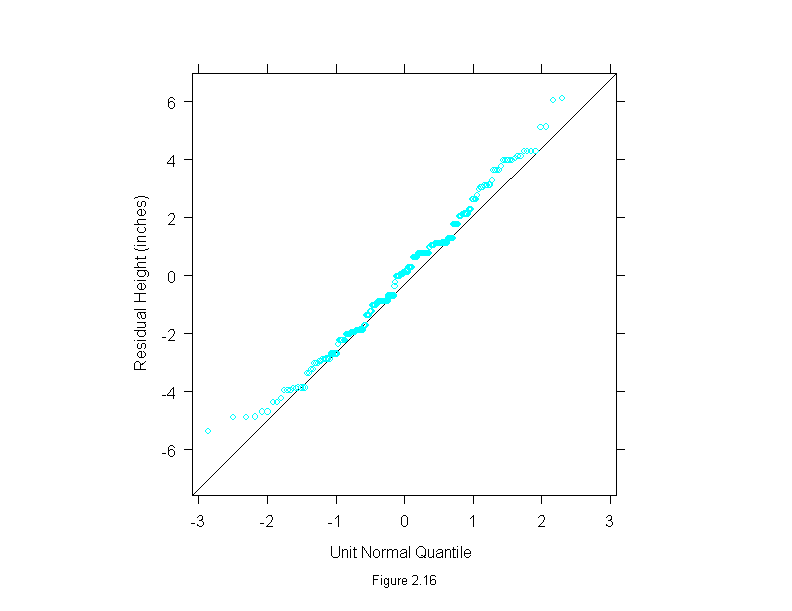
Figure 2.17
rfs(oneway(height~voice.part, data = singer, spread = 1),
  aspect=1,
  sub = list("Figure 2.17",cex=.8),
  ylab = "Height (inches)")
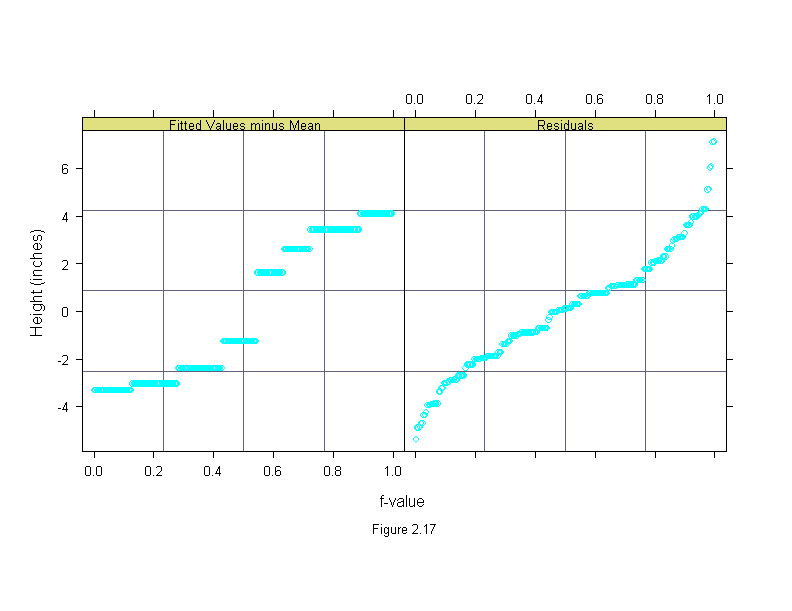
Figure 2.18 missing
Figure 2.19
qqmath(~ time | nv.vv,
  data=fusion.time,
  distribution = qunif,
  panel = function(x, y) {
    panel.grid()
    panel.qqmath(x, y)
  },
  aspect=1,
  layout=c(2,1),
  sub = list("Figure 2.19",cex=.8),
  xlab = "f-value",
  ylab="Time (seconds)")
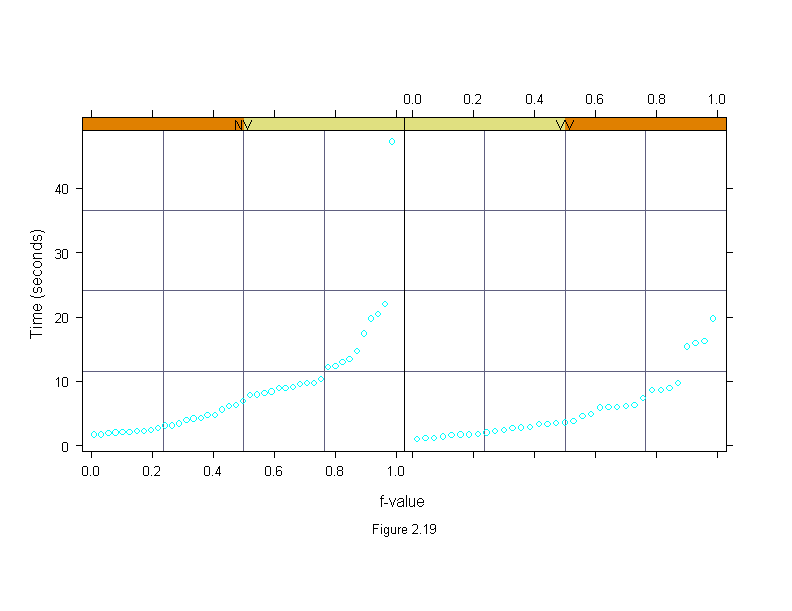
Figure 2.20
data <- 5+qnorm(ppoints(25))
qqmath(~data,
  distribution = qunif,
  panel = function(x, y) {
    reference.line <- trellis.par.get("reference.line")
    m <- median(y)
    segments(c(.1, .9), m, c(.1, .9), quantile(y, c(.1, .9)),
      lwd = reference.line$lwd, lty = reference.line$lty, col = reference.line$col)
    panel.qqmath(c(0, x, 1), c(min(y), y, max(y)), type = "l")
    panel.qqmath(x, y, col = 0, pch = 16)
    panel.qqmath(x, y)
    panel.abline(h = m)
    text(.05, 4.25, "d(0.1)", srt = 90, adj = 0)
    text(.85, 5.25, "d(0.9)", srt = 90, adj = 0)
  },
  aspect = 1,
  sub = list("Figure 2.20",cex=.8),
  xlab = "f-value",
  ylab = "Data")
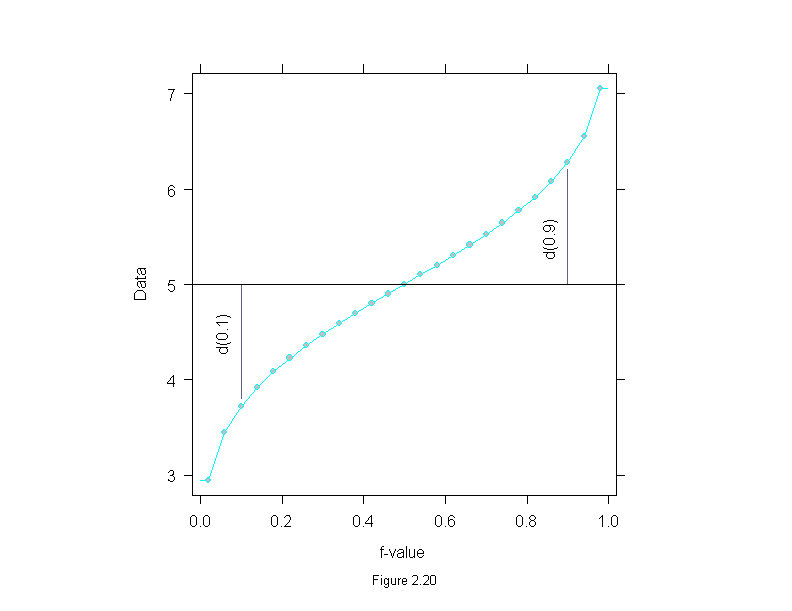
Figure 2.21
data <- 2 ^ (5 + qnorm(ppoints(25)))
qqmath(~ data,
  distribution = qunif,
  panel = function(x, y) {
    reference.line <- trellis.par.get("reference.line")
    m <- median(y)
    segments(c(.1, .9), m, c(.1, .9), quantile(y, c(.1, .9)),
      lwd = reference.line$lwd, lty = reference.line$lty, col = reference.line$col)
    panel.qqmath(c(0, x, 1), c(min(y), y, max(y)), type = "l")
    panel.qqmath(x, y, col = 0, pch = 16)
    panel.qqmath(x, y)
    panel.abline(h = m)
    text(.05, 15, "d(0.1)", srt = 90, adj = 0)
    text(.85, 40, "d(0.9)", srt = 90, adj = 0)
  },
  aspect = 1,
  sub = list("Figure 2.21",cex=.8),
  xlab = "f-value",
  ylab = "Data")
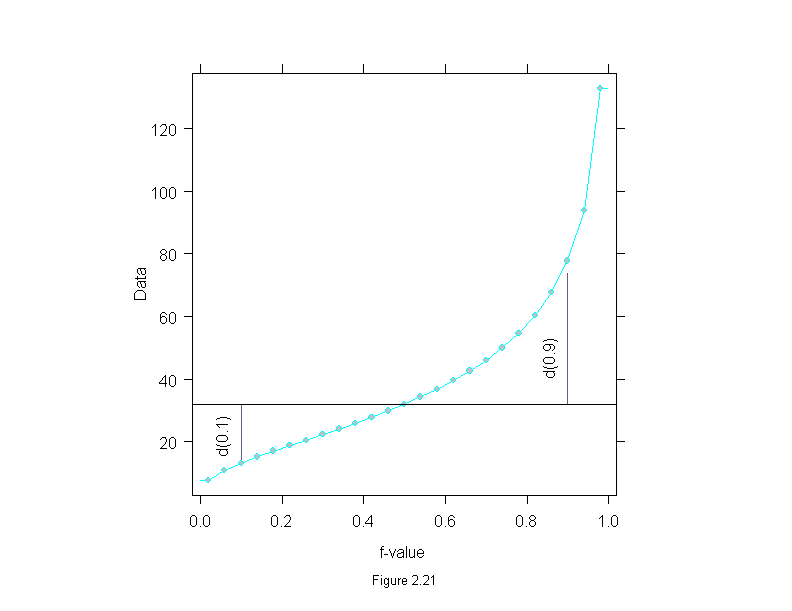
Figure 2.22
qqmath(~ time | nv.vv,
  data=fusion.time,
  prepanel = prepanel.qqmathline,
  panel = function(x, y) {
    panel.grid()
    panel.qqmathline(y, distribution = qnorm)
    panel.qqmath(x, y)
  },
  aspect=1,
  layout=c(2,1),
  sub = list("Figure 2.22",cex=.8),
  xlab = "Unit Normal Quantile",
  ylab="Time (seconds)")
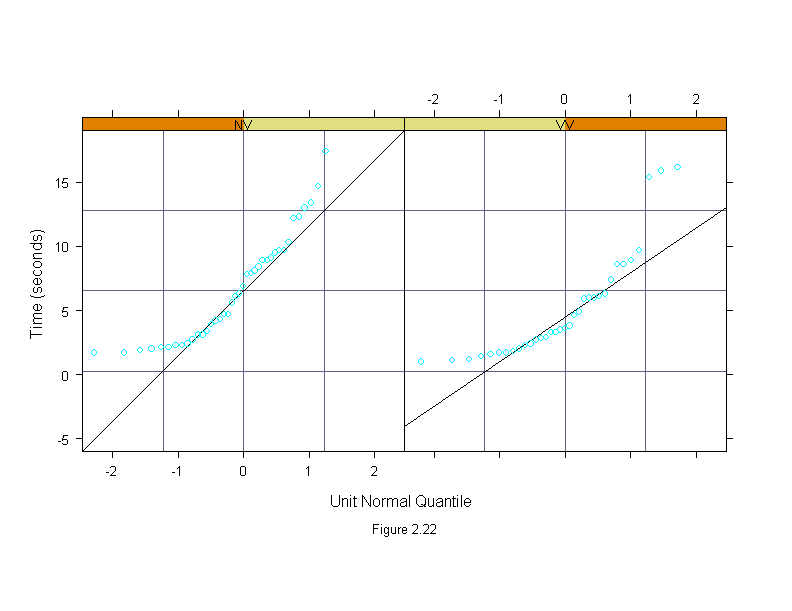
Figure 2.23
function()
bwplot(nv.vv ~ time,
  data=fusion.time,
  aspect = .5,
  sub = list("Figure 2.23",cex=.8),
  xlab="Time (seconds)")
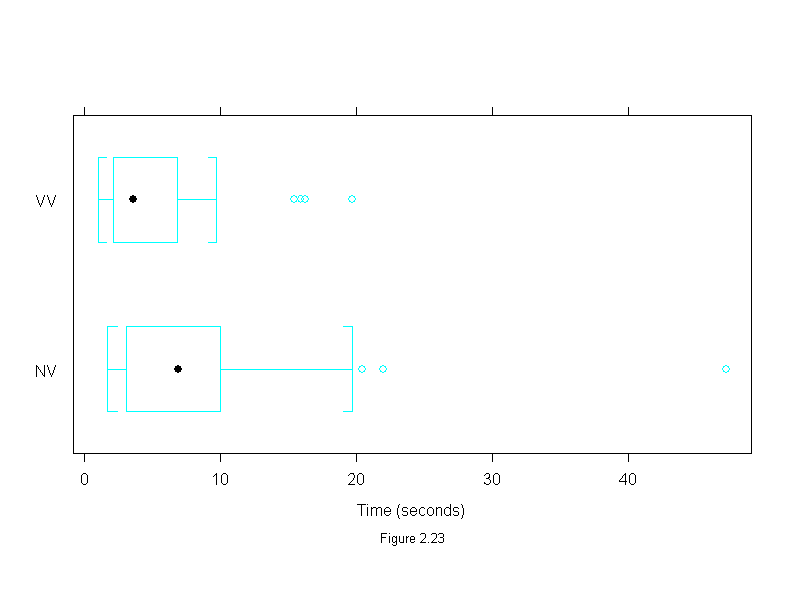
Figure 2.24
qqmath(~ logb(time,2) | nv.vv,
  data=fusion.time,
  prepanel=prepanel.qqmathline,
  panel = function(x, y) {
    panel.grid()
    panel.qqmathline(y, distribution = qnorm)
    panel.qqmath(x, y)
  },
  aspect=1,
  layout=c(2,1),
  sub = list("Figure 2.24",cex=.8),
  xlab = "Unit Normal Quantile",
  ylab="Log Time (log 2 seconds)")
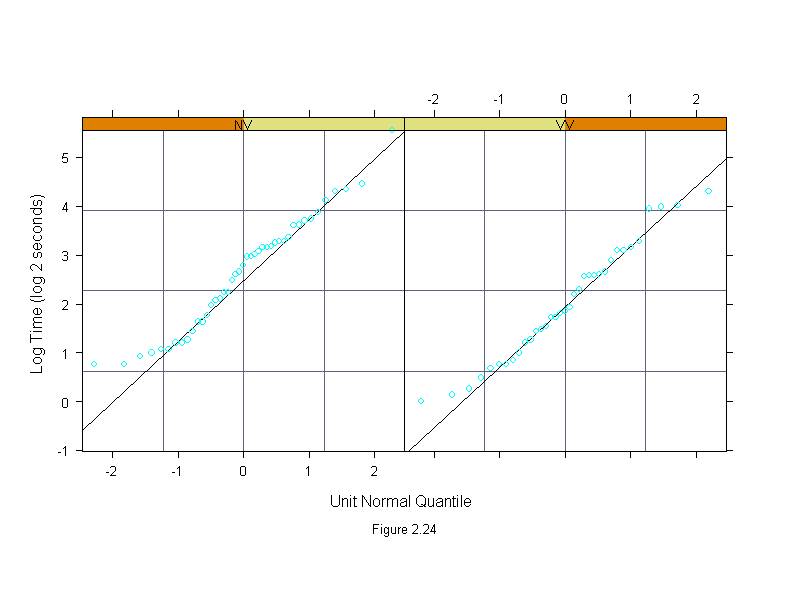
Figure 2.25
fusion.time.m <- oneway(time ~ nv.vv, data=fusion.time, location=median, spread=1)
xyplot(sqrt(abs(residuals(fusion.time.m)))~jitter(fitted.values(fusion.time.m),factor=3),
  aspect=1,
  panel=substitute(function(x,y){
    panel.xyplot(x,y)
    srmads <- sqrt(tapply(abs(residuals(fusion.time.m)),
      fusion.time$nv.vv, median))
    lines(fusion.time.m$location,srmads)
  }),
  sub = list("Figure 2.25",cex=.8),
  xlab="Jittered Median Time (sec)",
  ylab="Square Root Absolute Residual Time (square root sec)")
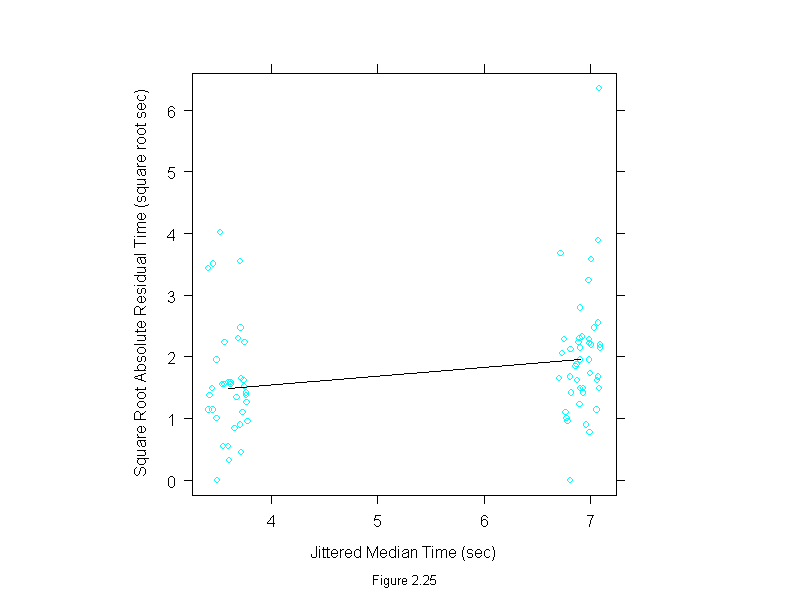
Figure 2.26
fusion.time.m <- oneway(logb(time,2) ~ nv.vv,data=fusion.time, location = median, spread=1)
xyplot(sqrt(abs(residuals(fusion.time.m))) ~ jitter(fitted.values(fusion.time.m),factor=3),
  aspect=1,
  panel=substitute(function(x,y){
    panel.xyplot(x,y)
    srmads <- tapply(abs(residuals(fusion.time.m)),
      fusion.time$nv.vv,median)
    lines(fusion.time.m$location,srmads)
  }),
  sub = list("Figure 2.26",cex=.8),
  xlab="Jittered Median Log Time (log 2 sec)",
  ylab="Square Root Absolute Residual Log Time (square root absolute log 2 sec)")
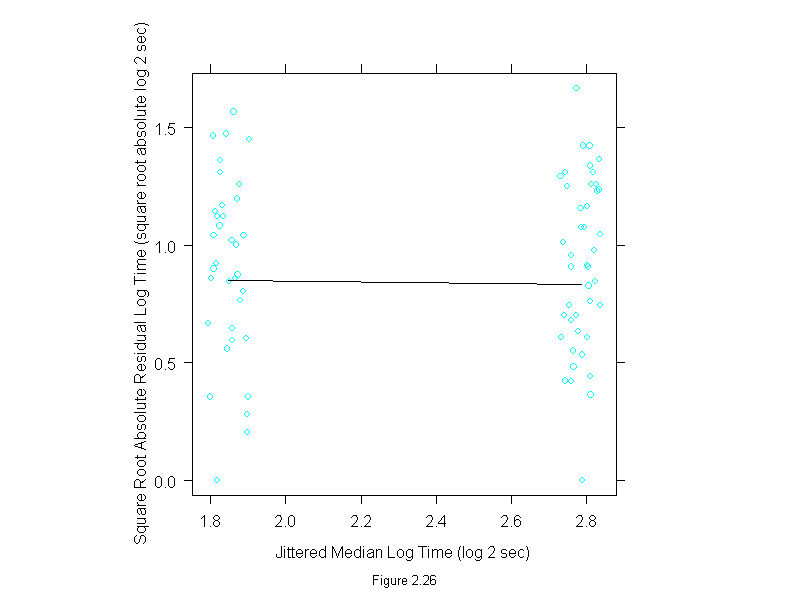
Figure 2.27
qq(nv.vv ~ time,
  data = fusion.time,
  aspect = 1,
  sub = list("Figure 2.27",cex=.8),
  xlab="NV Time (seconds)",
  ylab="VV Time (seconds)")
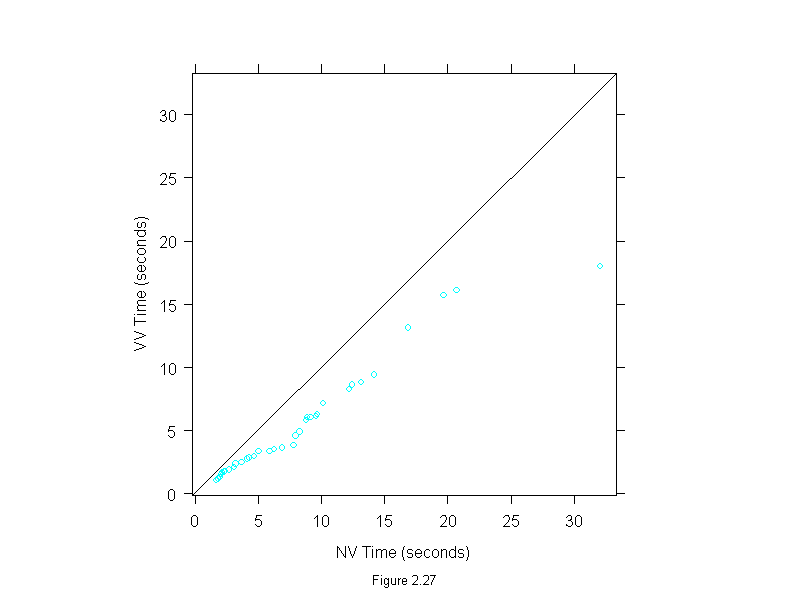
Figure 2.28
qq(nv.vv ~ logb(time, 2),
  data = fusion.time,
  aspect = 1,
  sub = list("Figure 2.28",cex=.8),
  xlab = "Log NV Time (log 2 seconds)",
  ylab = "Log VV Time (log 2 seconds)")
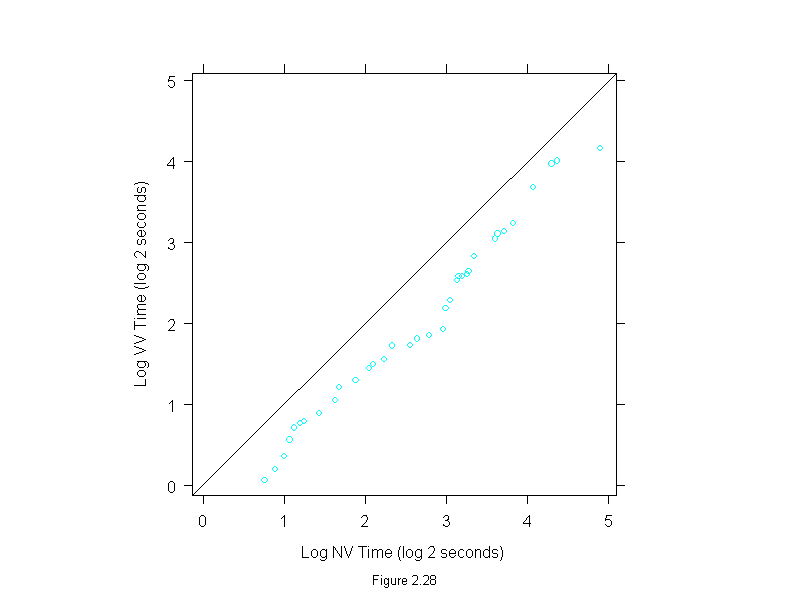
Figure 2.29
tmd(qq(nv.vv ~ logb(time, 2), data = fusion.time),
  aspect = 1,
  sub = list("Figure 2.29",cex=.8),
  xlab = "Mean (log 2 seconds)",
  ylab = "Difference (log 2 seconds)")
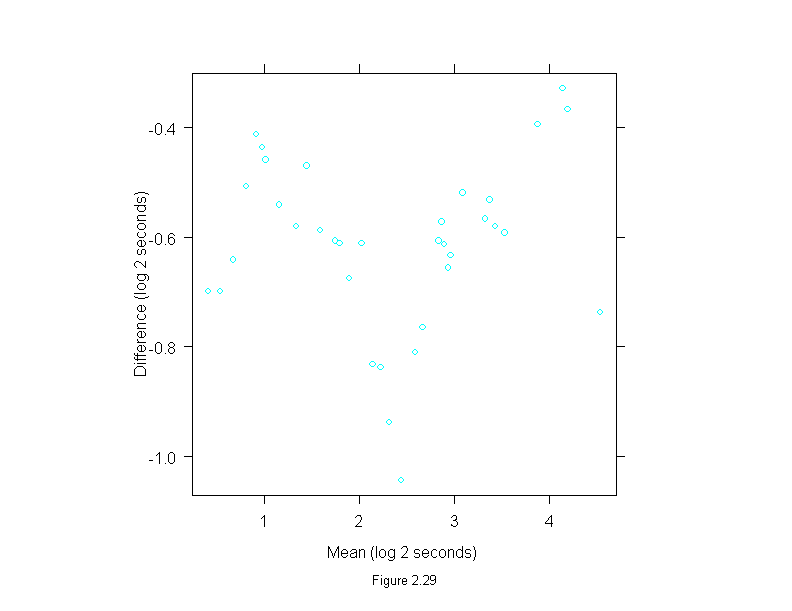
Figure 2.30
res <- oneway(logb(time,2)~nv.vv, data = fusion.time, spread = 1)$residuals
qqmath(~ res | fusion.time$nv.vv,
  distribution = substitute(function(p) quantile(res, p)),
  panel=function(x,y){
    panel.grid()
    panel.abline(0, 1)
    panel.qqmath(x, y)
  },
  aspect=1,
  layout=c(2,1),
  sub = list("Figure 2.30",cex=.8),
  xlab = "Pooled Residual Log Time (log 2 seconds)",
  ylab = "Residual Log Time (log 2 seconds)")
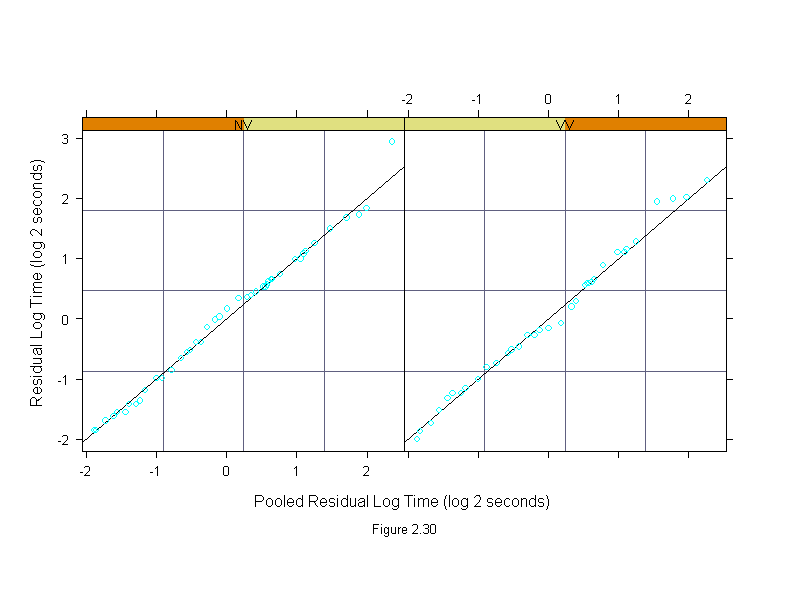
Figure 2.31
qqmath(~ oneway(logb(time,2)~nv.vv, data = fusion.time, spread = 1)$residuals,
  prepanel = prepanel.qqmathline,
  panel = function(x, y) {
    panel.qqmathline(y, distribution = qnorm)
    panel.qqmath(x, y)
  },
  aspect = 1,
  sub = list("Figure 2.31",cex=.8),
  xlab = "Unit Normal Quantile",
  ylab = "Residual Log Time (log 2 seconds)")
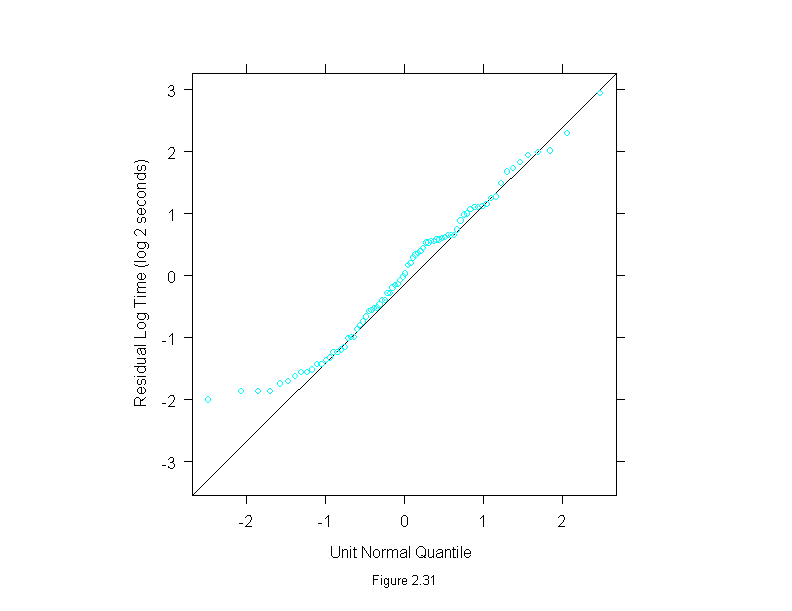
Figure 2.32
rfs(oneway(logb(time, 2)~nv.vv, data = fusion.time, spread = 1),
  aspect=1,
  sub = list("Figure 2.32",cex=.8),
  ylab = "Log Time (log 2 seconds)")
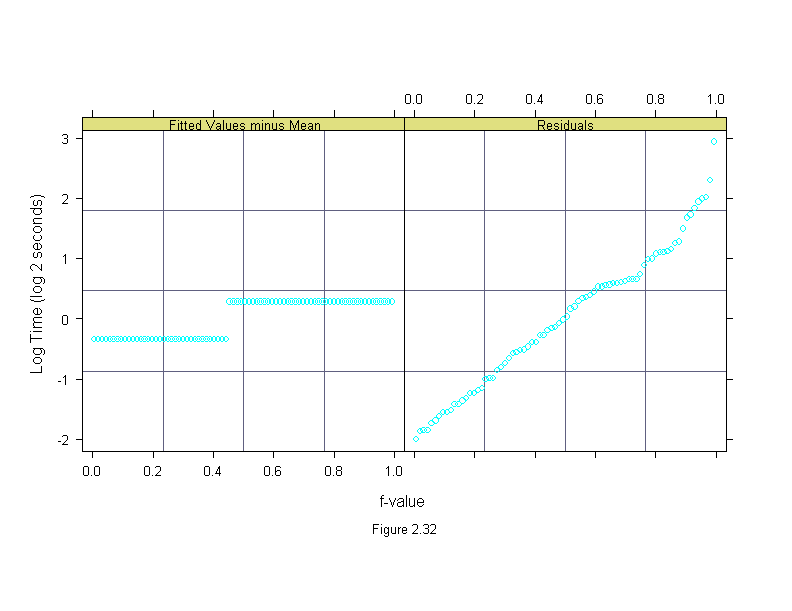
Figure 2.33
attach(fusion.time)
vvtime <- time[nv.vv=="VV"]
transformed <- cbind(outer(vvtime,c(-1,-1/2,-1/4),"^"),log(vvtime),
  (outer(vvtime,c(1/4,1/2,1),"^")))
fusion.time.power <- data.frame(transformed=c(transformed),
  lambda = factor(rep(c(-1,-1/2,-1/4,0,1/4,1/2,1),rep(length(vvtime),7))))
ans <- qqmath(~ transformed | lambda,
  data=fusion.time.power,
  prepanel = prepanel.qqmathline,
  panel = function(x, y) {
    panel.grid(h = 0)
    panel.qqmathline(y, distribution = qnorm)
    panel.qqmath(x, y)
  },
  aspect=1,
  scale = list(y = "free"),
  layout=c(2,4),
  sub = list("Figure 2.33",cex=.8),
  xlab = "Unit Normal Quantile",
  ylab = "VV Time")
detach()
ans
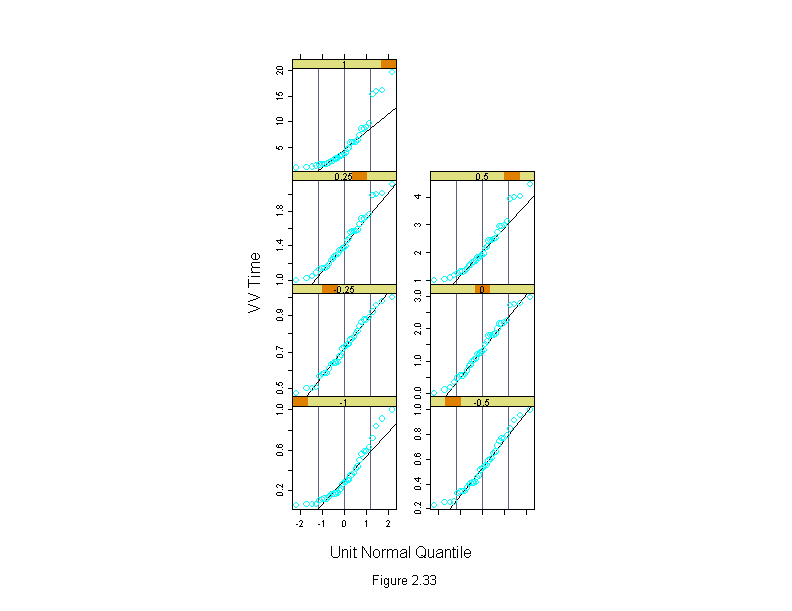
Figure 2.34
qqmath(~ mean.length | dimension,
  distribution = qunif,
  data=food.web,
  panel = function(x, y) {
    panel.grid()
    panel.qqmath(x, y)
  },
  layout=c(1,3),
  aspect=1,
  sub = list("Figure 2.34",cex=.8),
  xlab = "f-value",
  ylab="Chain Length")
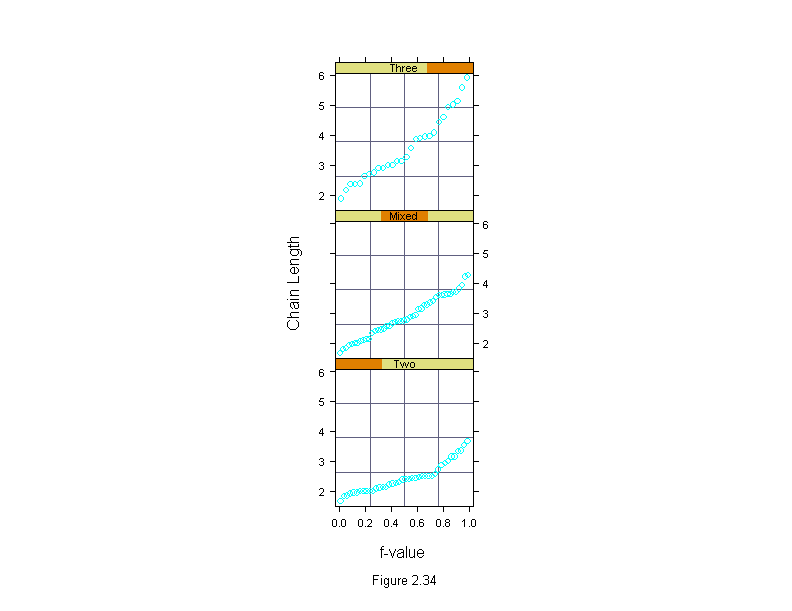
Figure 2.35
foo.m <- oneway(mean.length~dimension, data = food.web, location = median, spread=1)
set.seed(19)
xyplot(sqrt(abs(residuals(foo.m))) ~ jitter(fitted.values(foo.m),factor=3),
  aspect=1,
  panel = substitute(function(x,y){
    panel.xyplot(x,y)
    srmads <- tapply(abs(residuals(foo.m)),
      food.web$dimension, median)
    lines(foo.m$location,srmads)
  }),
  sub = list("Figure 2.35",cex=.8),
  xlab="Jittered Median Chain Length",
  ylab="Square Root Absolute Residual Chain Length")
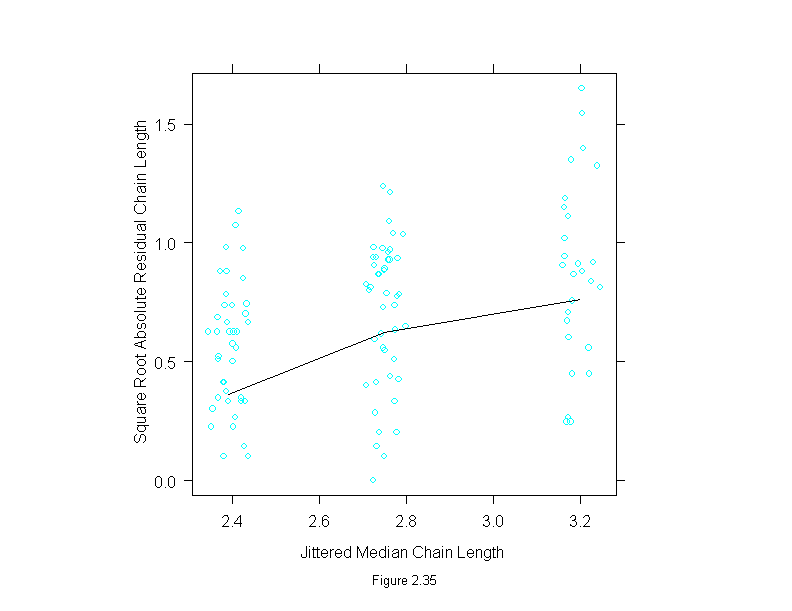
Figure 2.36
qqmath(~ mean.length | dimension,
  data=food.web,
  prepanel = prepanel.qqmathline,
  panel = function(x, y) {
    panel.grid()
    panel.qqmathline(y, distribution = qnorm)
    panel.qqmath(x, y)
  },
  layout=c(1,3),
  aspect=1,
  sub = list("Figure 2.36",cex=.8),
  xlab = "Unit Normal Quantile",
  ylab="Chain Length")
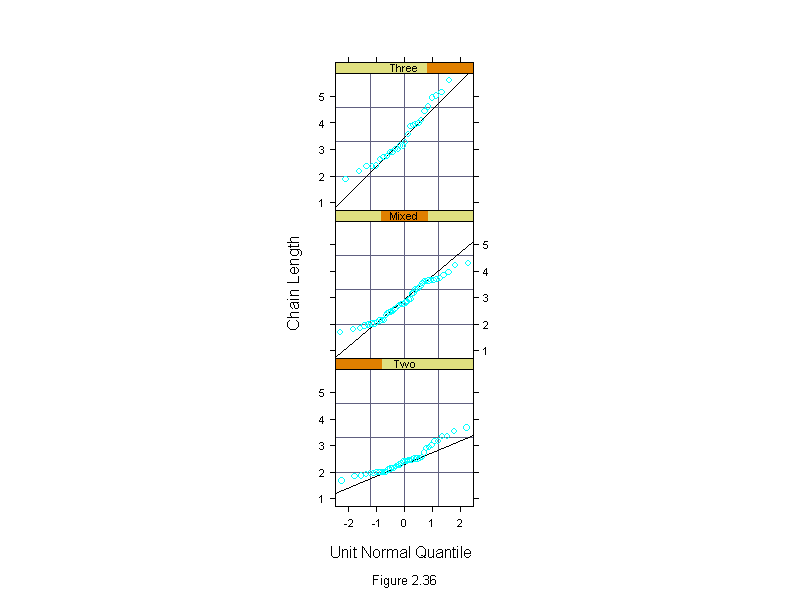
Figure 2.37
foo.m <- oneway(logb(mean.length, 2) ~ dimension, data = food.web, location = median, spread = 1)
set.seed(19)
xyplot(sqrt(abs(residuals(foo.m))) ~ jitter(fitted.values(foo.m), factor = 3),
  panel = substitute(function(x, y) {
    panel.xyplot(x, y)
    add.line <- trellis.par.get("add.line")
    lines(foo.m$location, tapply(y, food.web$dimension, median),
      lty = add.line$lty, lwd = add.line$lwd, col = add.line$col)
  }),
  aspect = 1,
  sub = list("Figure 2.37",cex=.8),
  xlab = "Jittered Median Log 2 Chain Length",
  ylab = "Square Root Absolute Residual Log 2 Chain Length")
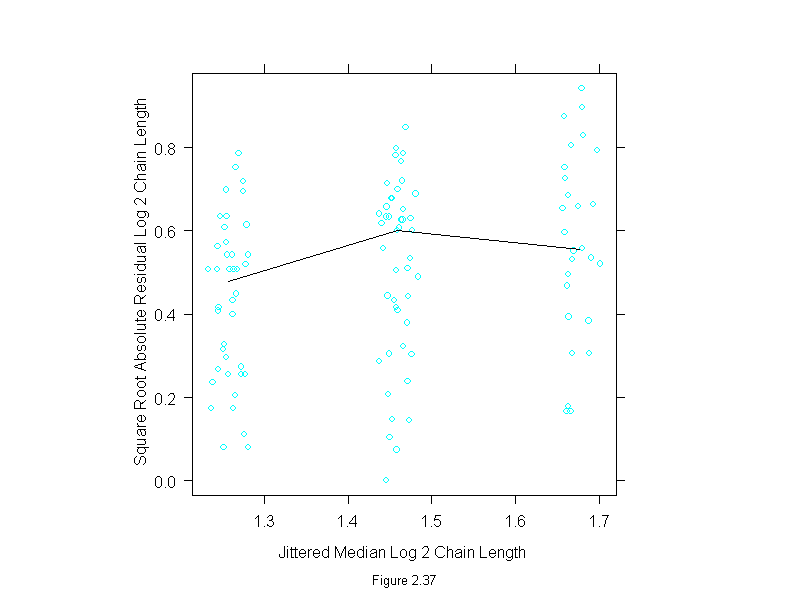
Figure 2.38
qqmath(~ logb(mean.length,2) | dimension,
  data=food.web,
  prepanel = prepanel.qqmathline,
  panel = function(x, y) {
    panel.grid()
    panel.qqmathline(y, distribution = qnorm)
    panel.qqmath(x, y)
  },
  layout=c(1,3),
  aspect=1,
  sub = list("Figure 2.38",cex=.8),
  xlab = "Unit Normal Quantile",
  ylab="Log 2 Chain Length")
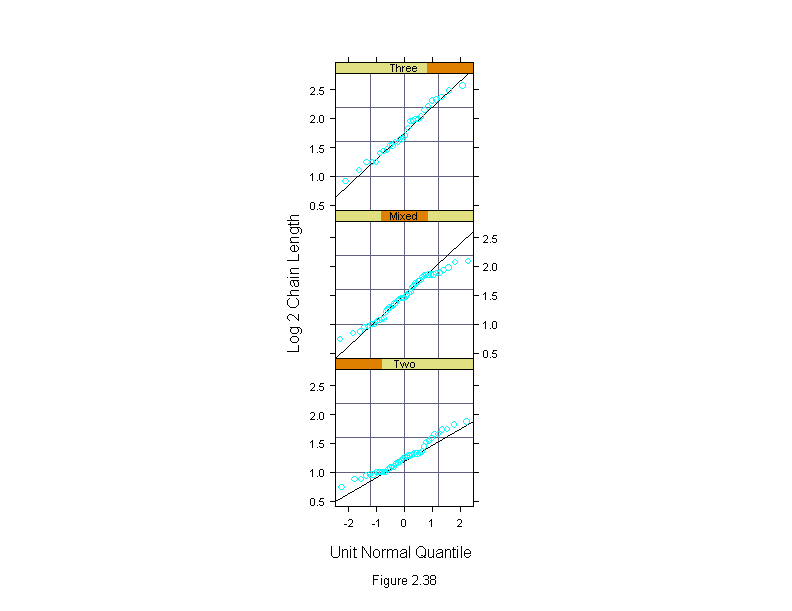
Figure 2.39
foo.m <- oneway(1/mean.length ~ dimension, data = food.web, location = median, spread = 1)
set.seed(19)
xyplot(sqrt(abs(residuals(foo.m))) ~ jitter(fitted.values(foo.m), factor = 3),
  panel = substitute(function(x,y) {
    panel.xyplot(x,y)
    add.line <- trellis.par.get("add.line")
    lines(foo.m$location, tapply(y, food.web$dimension, median),
    lty = add.line$lty, lwd = add.line$lwd, col = add.line$col)
  }),
  aspect = 1,
  sub = list("Figure 2.39",cex=.8),
  xlab = "Jittered Median Link Fraction",
  ylab = "Square Root Absolute Residual Link Fraction")
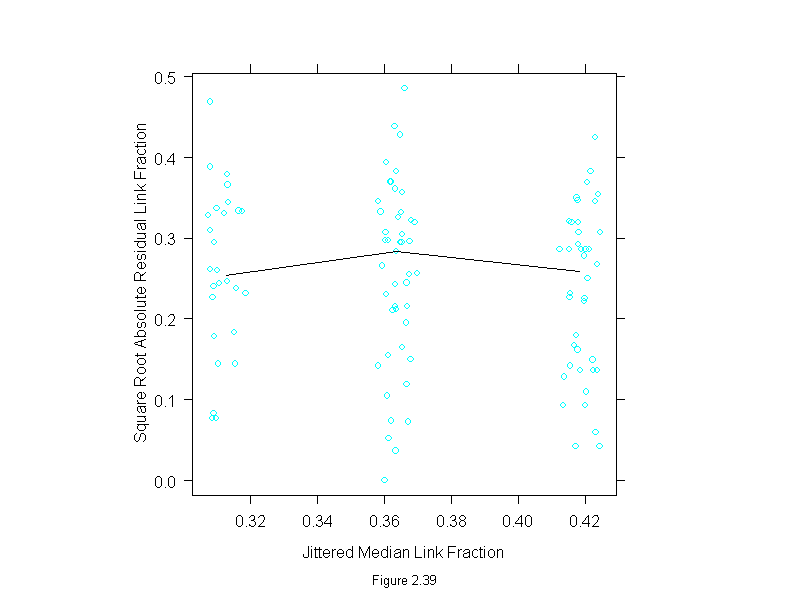
Figure 2.40
qqmath(~ (1/mean.length) | dimension,
       data = food.web,
       panel = function(x, y){
    panel.grid()
    panel.xyplot(x, y)
    panel.qqmathline(y, distribution = qnorm)
       },
       layout = c(1, 3),
       aspect = 1,
  sub = list("Figure 2.40",cex=.8),
       xlab = "Unit Normal Quantile",
       ylab = "Link Fraction")
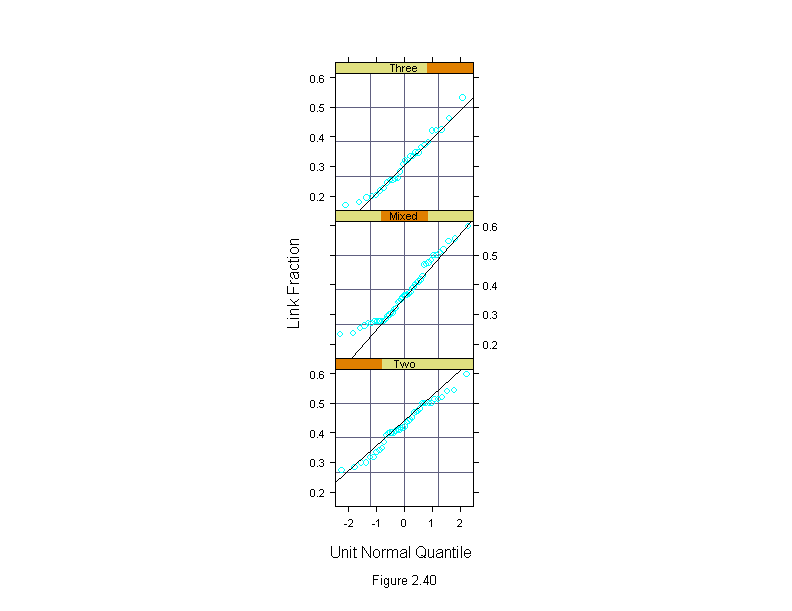
Figure 2.41
res <- oneway((1/mean.length)~dimension, data = food.web, spread = 1)$residuals
qqmath(~ res | food.web$dimension,
  distribution = substitute(function(p) quantile(res, p)),
  panel=function(x,y){
    panel.grid()
    panel.abline(0, 1)
    panel.qqmath(x, y)
  },
  layout=c(1,3),
  aspect=1,
  sub = list("Figure 2.41",cex=.8),
  xlab = "Pooled Residual Link Fraction",
  ylab = "Residual Link Fraction")
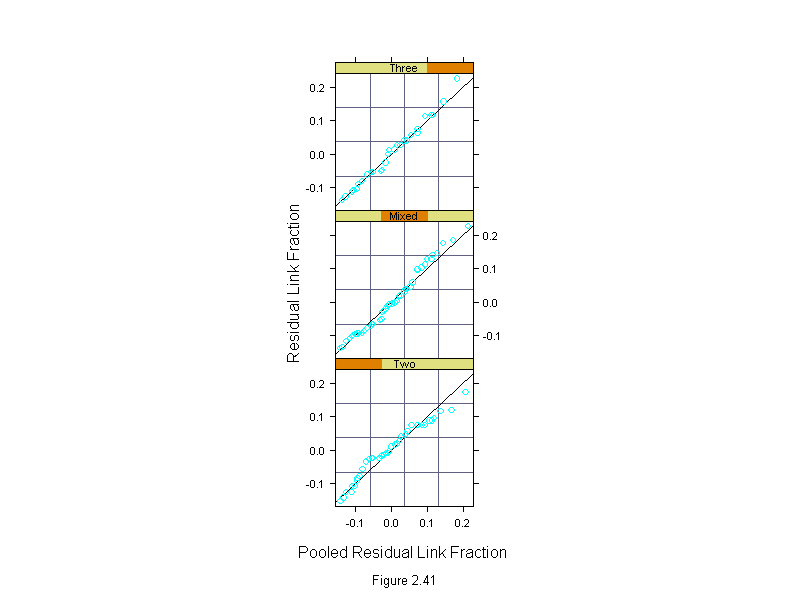
Figure 2.42
rfs(oneway((1/mean.length)~dimension, data = food.web, spread = 1),
  sub = list("Figure 2.42",cex=.8),
  aspect=1,
  ylab = "Link Fraction")
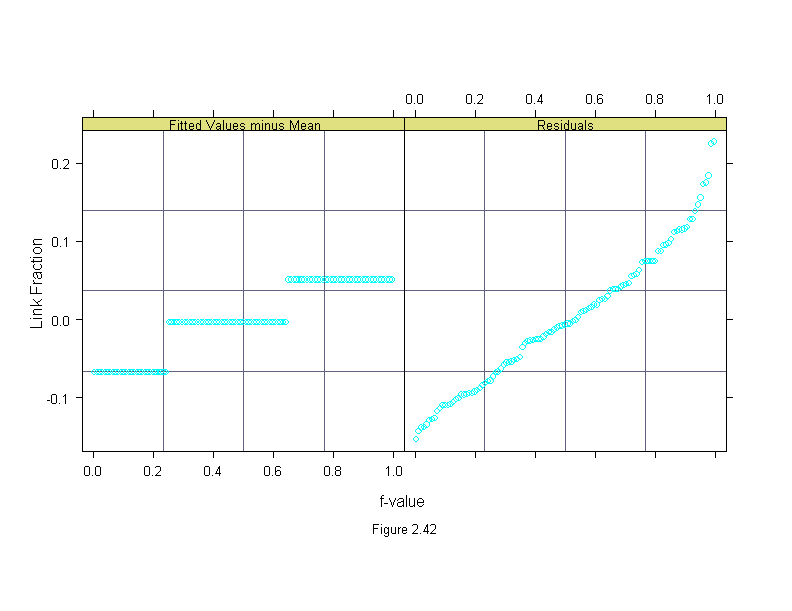
Figure 2.43
bwplot(factor(number.runs) ~ logb(empty.space,2),
  data=bin.packing,
  aspect=1,
  sub = list("Figure 2.43",cex=.8),
  xlab="Log 2 Empty Space")
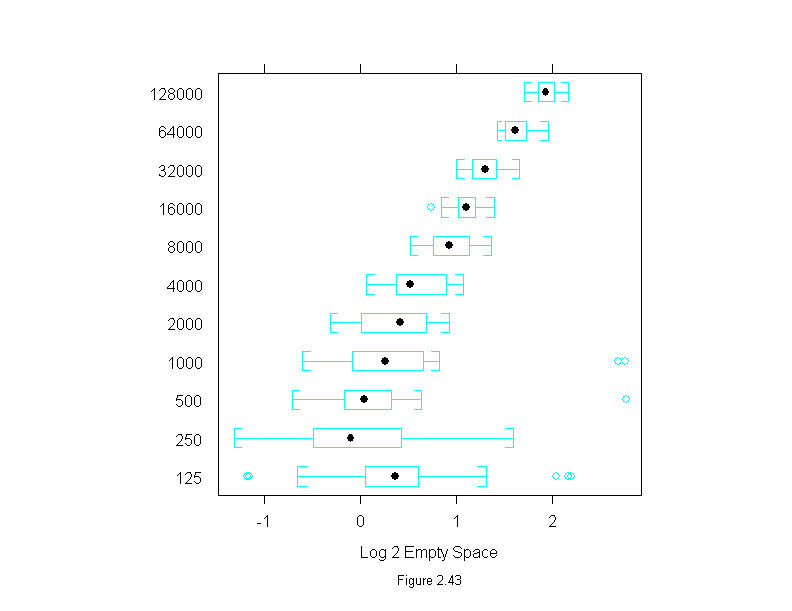
Figure 2.44
qqmath(~ logb(empty.space,2) | factor(number.runs),
  data = bin.packing,
  prepanel = prepanel.qqmathline,
  panel = function(x, y) {
    panel.grid()
    panel.qqmathline(y, distribution = qnorm)
    panel.qqmath(x, y)
  },
  layout = c(3, 4),
  sub = list("Figure 2.44",cex=.8),
  xlab = "Unit Normal Quantile",
  ylab = "Log 2 Empty Space")
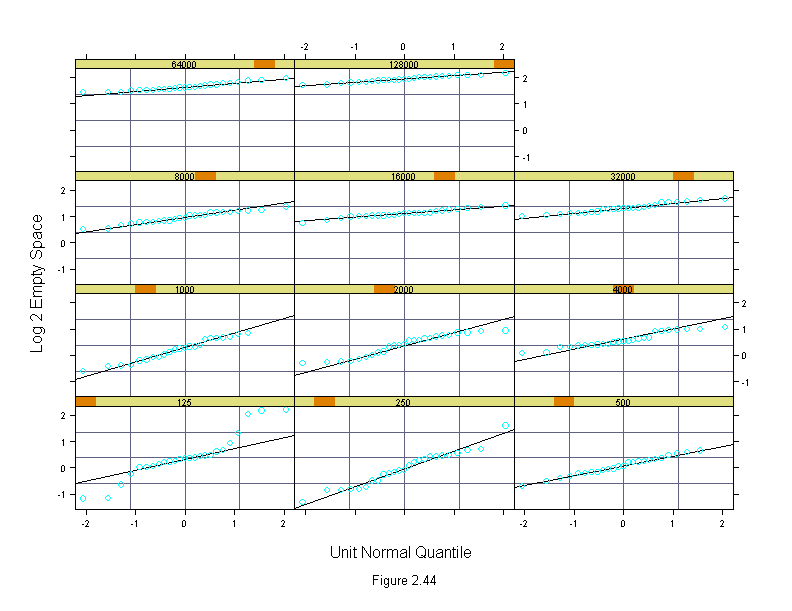
Figure 2.45
res <- oneway(logb(empty.space,2) ~ number.runs, data = bin.packing,
  location = median,
# This next line is the way it should be.
#    spread = function(x) median(abs(x-median(x)))
# This next line is the way it is now.
  spread = function(x) (quantile(x,.75)-quantile(x,.25))/1.33)$scaled.residuals
qqmath(~ res | factor(bin.packing$number.runs),
  prepanel = prepanel.qqmathline,
  panel = function(x, y) {
    panel.grid()
    panel.qqmathline(y, distribution = qnorm)
    panel.qqmath(x, y)
  },
  layout = c(3,4),
  sub = list("Figure 2.45",cex=.8),
  xlab = "Unit Normal Quantile",
  ylab = "Spread-Standardized Residual Log 2 Empty Space")
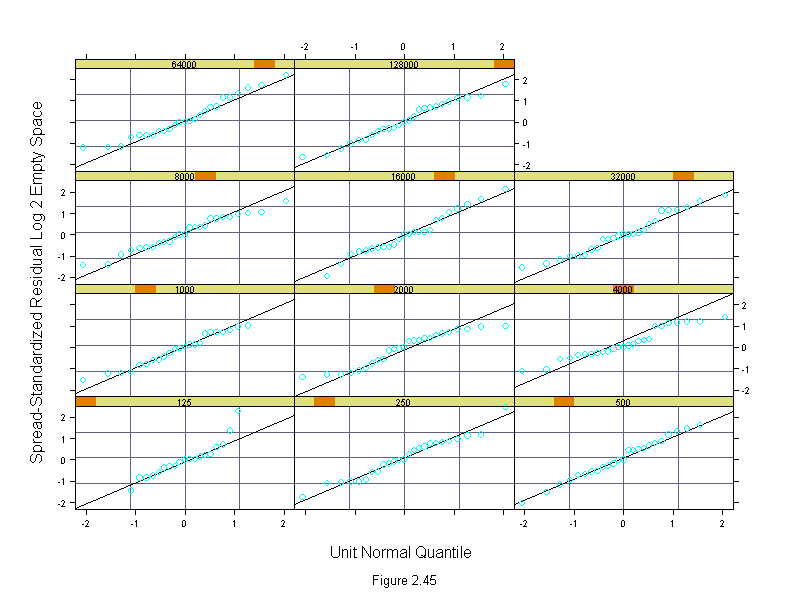
Figure 2.46
attach(bin.packing)
data <- logb(empty.space,2)
bin.packing.m <- oneway(data~number.runs,location = median,
  spread=function(x) diff(quantile(x,c(.25,.75)))/1.35)
res <- bin.packing.m$scaled.res[number.runs>1000]
gr <- factor(number.runs[number.runs>1000])
ans <- qqmath(~ res | gr,
  distribution = substitute(function(p) quantile(res, p)),
  panel = function(x, y){
    panel.grid()
    panel.abline(0, 1)
    panel.qqmath(x, y)
  },
  aspect = 1,
  layout = c(2, 4),
  sub = list("Figure 2.46",cex=.8),
  xlab = "Pooled Spread-Standardized Residual Log 2 Empty Space",
  ylab = "Spread-Standardized Residual Log 2 Empty Space")
detach()
ans
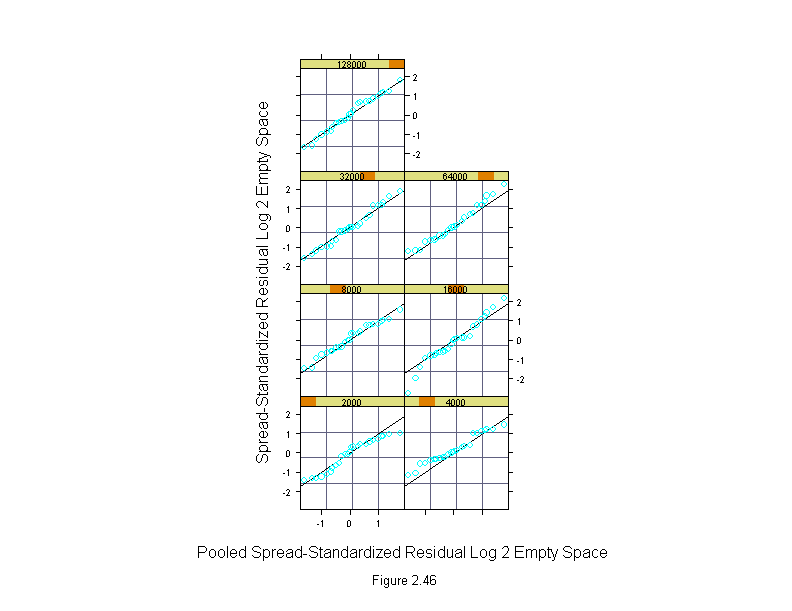
Figure 2.47
bin.packing.m <- oneway(logb(empty.space,2) ~ number.runs, data = bin.packing,
  location = median,
  spread = function(x) diff(quantile(x,c(.25,.75)))/1.35)
qqmath(~ bin.packing.m$scaled.res[bin.packing$number.runs > 1000],
  prepanel = prepanel.qqmathline,
  panel = function(x, y) {
    panel.qqmathline(y, distribution = qnorm)
    panel.qqmath(x, y)
  },
  aspect = 1,
  sub = list("Figure 2.47",cex=.8),
  xlab = "Unit Normal Quantile",
  ylab = "Spread-Standardized Residual Log 2 Empty Space")
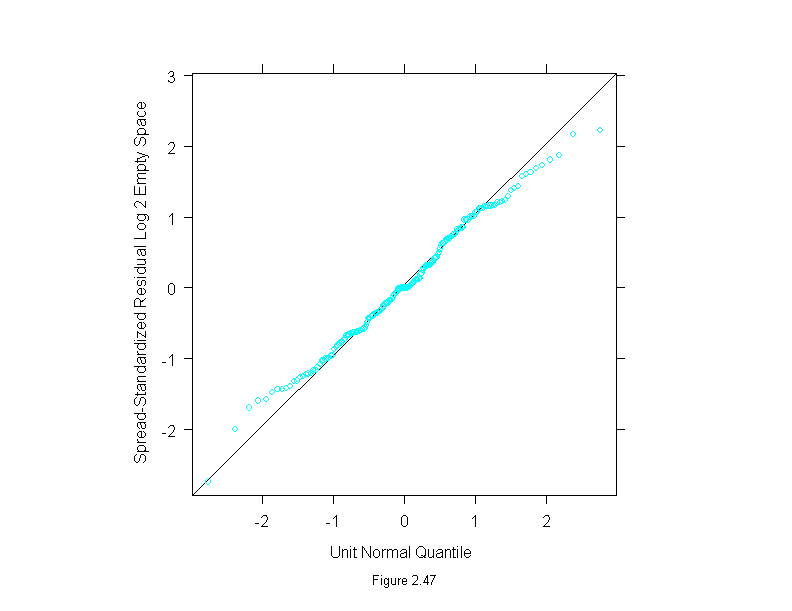
Figure 2.48
attach(bin.packing)
data <- logb(empty.space,2)
mq <- tapply(data, number.runs, median)
nw <- logb(sort(unique(number.runs)),2)
ans <- xyplot(mq ~ nw,
  panel = function(x, y){
    panel.xyplot(x, y)
    panel.abline(y[11] - x[11]/3, 1/3)
  },
  aspect = 1,
  sub = list("Figure 2.48",cex=.8),
  xlab = "Log 2 Number of Weights",
  ylab = "Median Log 2 Empty Space")
detach()
ans
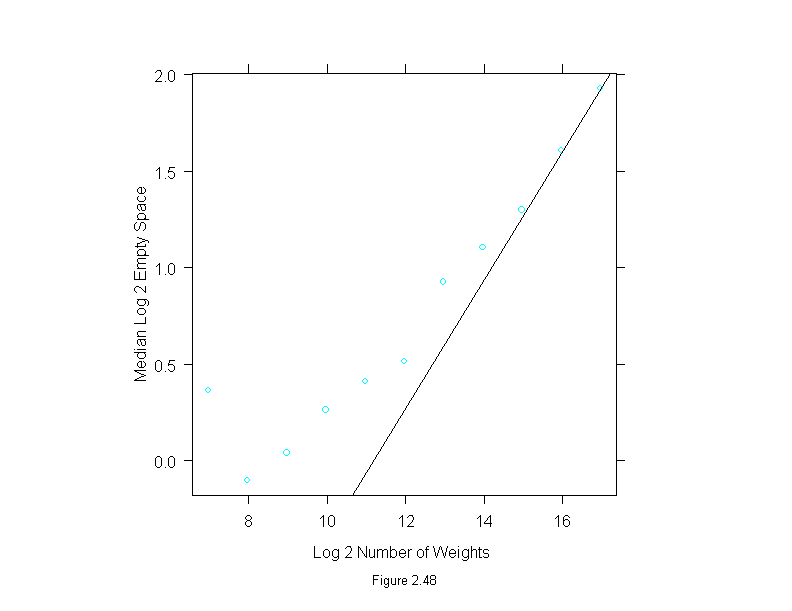
Figure 2.49
attach(bin.packing)
bin.packing.m <- oneway(logb(empty.space, 2) ~ number.runs, location = median, spread = 1)
srmads <- tapply(abs(residuals(bin.packing.m)), number.runs, median)
ans <- xyplot(logb(srmads, 2) ~ logb(sort(unique(number.runs)), 2),
  aspect = 1,
  sub = list("Figure 2.49",cex=.8),
  xlab = "Log 2 Number of Weights",
  ylab = "Log 2 Mad of Log 2 Empty Space")
detach()
ans
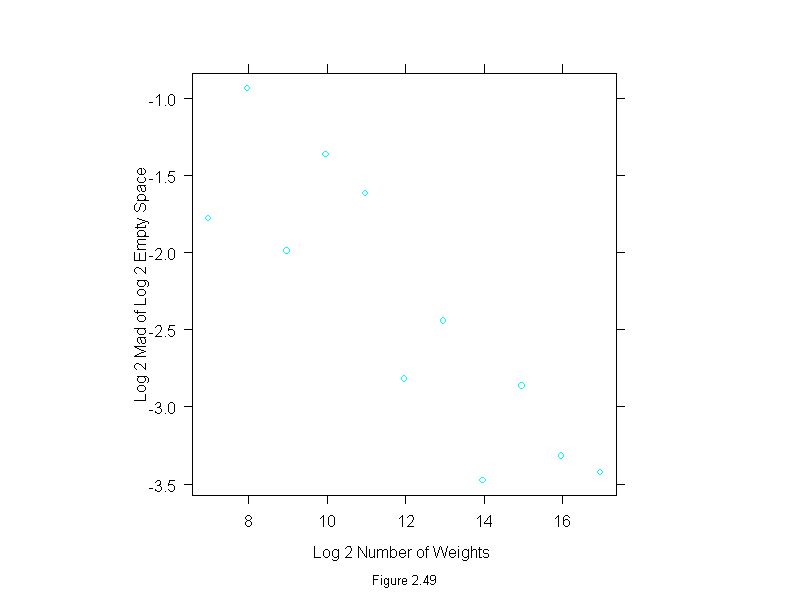
Figure 2.50
attach(bin.packing)
bin.packing.m <- oneway(logb(empty.space,2) ~ number.runs, location = median, spread = 1)
srmads <- tapply(abs(residuals(bin.packing.m)), number.runs, median)
ans <- xyplot(logb(srmads/min(srmads), 2) ~ bin.packing.m$location,
  aspect = 1,
  sub = list("Figure 2.50",cex=.8),
  xlab = "Median Log 2 Empty Space",
  ylab = "Log 2 Relative Spread")
detach()
ans
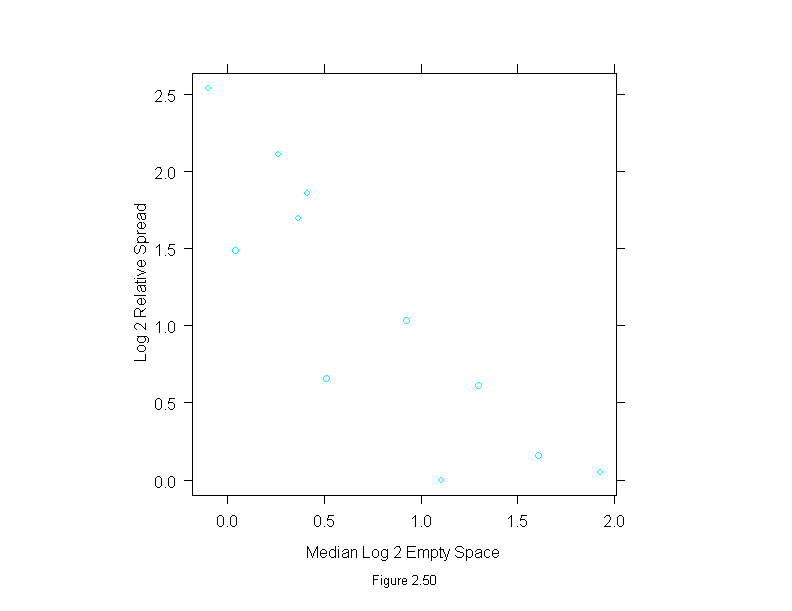
Figure 2.51
attach(bin.packing)
bin.packing.m <- oneway(empty.space~number.runs,location = median, spread=1)
srmads <- tapply(abs(residuals(bin.packing.m)),number.runs,median)
log.srmads <- logb(srmads/min(srmads),2)
ans <- xyplot(log.srmads ~ bin.packing.m$location,
  aspect=1,
  sub = list("Figure 2.51",cex=.8),
  xlab="Median Empty Space",
  ylab="Log 2 Relative Spread")
detach()
ans
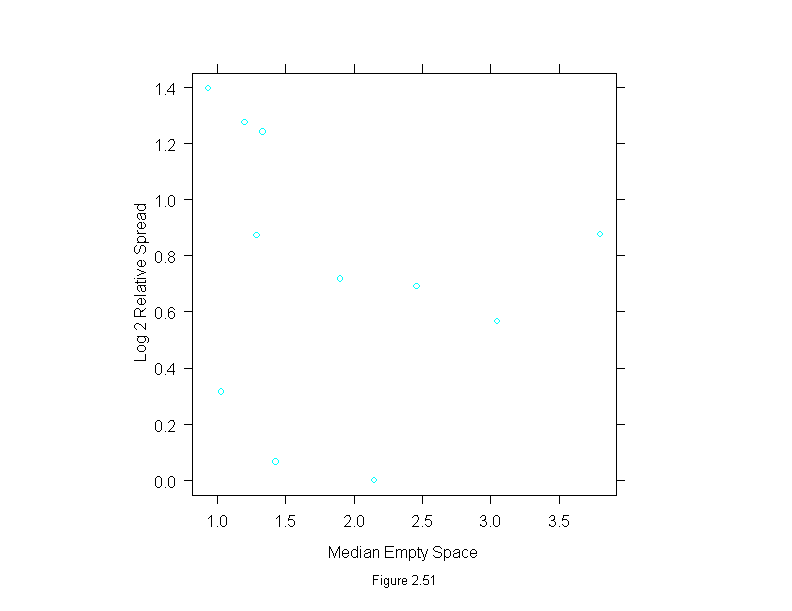
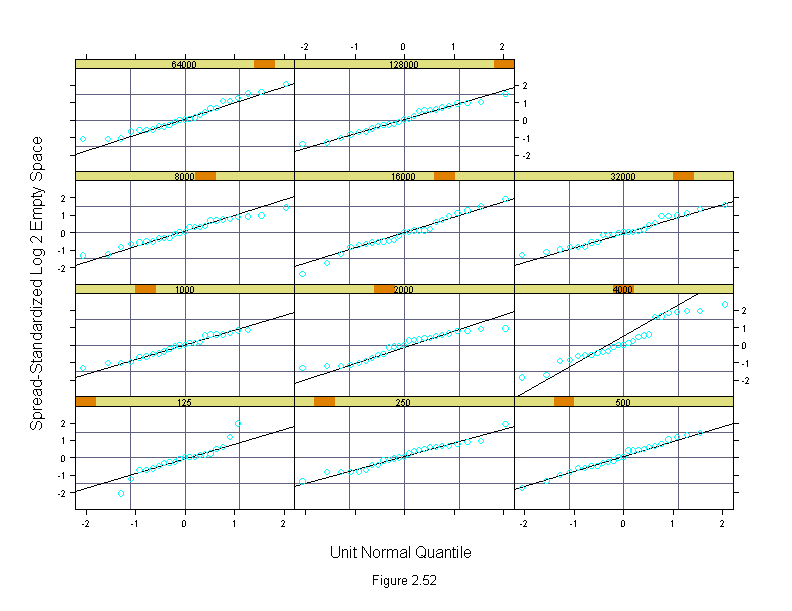
Figure 2.52
res <- oneway(logb(empty.space,2) ~ number.runs, data = bin.packing,
  location = median,
  spread = function(x) median(abs(x-median(x))))$scaled.residuals/1.68
qqmath(~ res | factor(bin.packing$number.runs),
  prepanel = prepanel.qqmathline,
  panel = function(x, y) {
    panel.grid()
    panel.qqmathline(y, distribution = qnorm)
    panel.qqmath(x, y, err=-1)   # no warnings for out of bounds
  },
  ylim = c(-2.75, 2.75),
  layout = c(3, 4),
  sub = list("Figure 2.52",cex=.8),
  xlab = "Unit Normal Quantile",
  ylab = "Spread-Standardized Log 2 Empty Space")
