Figure 3.1
xyplot(cp.ratio ~ area,
  data = ganglion,
  aspect=1,
  sub = list("Figure 3.1",cex=.8),
  xlab = "Area (square mm)",
  ylab = "CP Ratio")
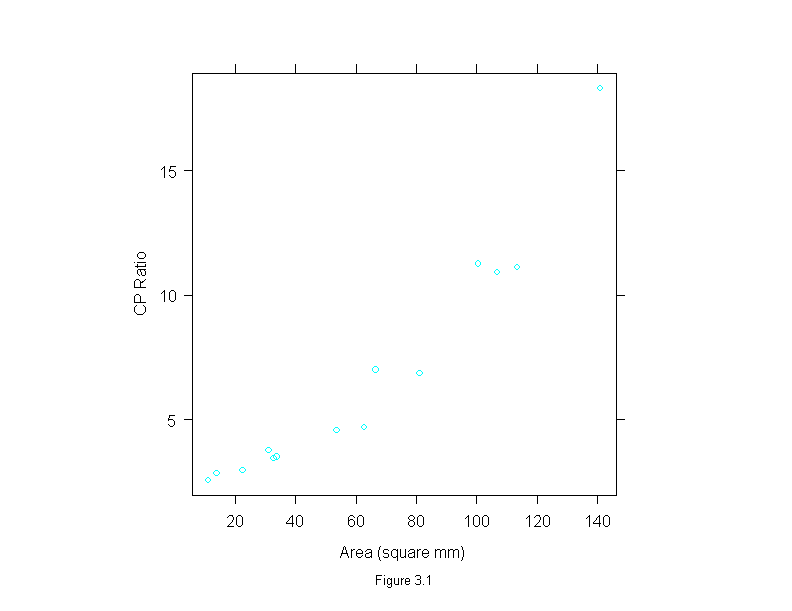
Figure 3.2
xyplot(cp.ratio ~ area,
  data = ganglion,
  prepanel=function(x,y)
    prepanel.loess(x,y,family="g"),
  panel = function(x,y){
    panel.xyplot(x,y)
    panel.loess(x,y, family = "g")
  },
  sub = list("Figure 3.2",cex=.8),
  xlab = "Area (square mm)",
  ylab = "CP Ratio",
  aspect="xy")
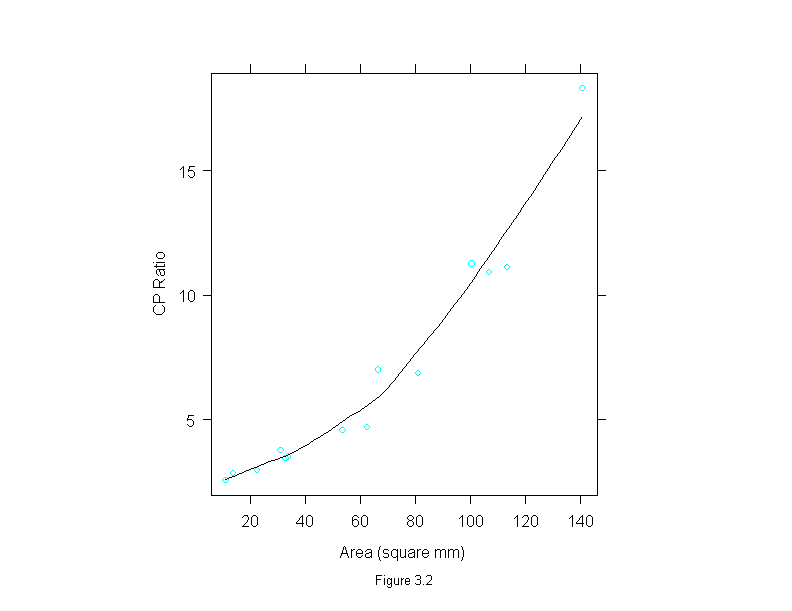
Figure 3.3
x <- seq(-1, 1, length = 100)
y <- c(x[1:50]^2, x[51:100])
ans1 <- xyplot(y ~ x,
  aspect = "xy",
  scale = list(draw = F),
  type = "l",
  xlab = "",
  ylab = "")
print(ans1, position = c(0, 0, 0.85, 1), more = T)
ans1 <- xyplot(y ~ x,
  aspect = "xy",
  scale = list(draw = F),
  xlim=c(-1.2,1.2),
  type = "l",
  xlab = "",
  ylab = "")
print(update(ans1, aspect = 5), position = c(0.73, 0.32, 1, 0.68),
  more = T)
ans1 <- xyplot(y ~ x,
  aspect = "xy",
  scale = list(draw = F),
  ylim=c(-.2,1.2),
  type = "l",
  sub = list("Figure 3.3",cex=.8),
  xlab = "",
  ylab = "")
print(update(ans1, aspect = 0.05), position = c(0, 0.15, .95, 0.45))
invisible()
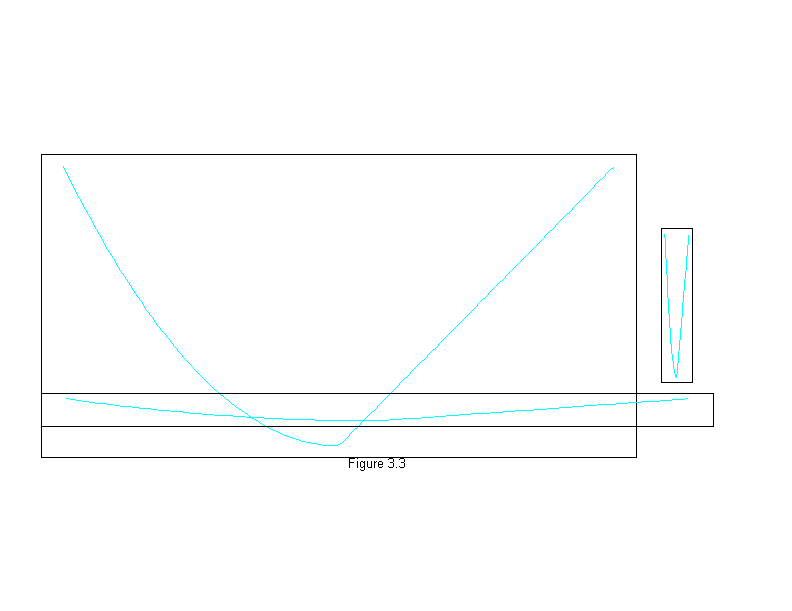
Figure 3.4
fit <- lm(cp.ratio~area, data = ganglion)
xyplot(cp.ratio~area,
  data = ganglion,
  prepanel = prepanel.lmline,
  panel = substitute(function(x, y) {
    panel.xyplot(x, y)
    panel.abline(fit)
  }),
  aspect=1,
  sub = list("Figure 3.4",cex=.8),
  xlab = "Area (square mm)", ylab="CP Ratio")
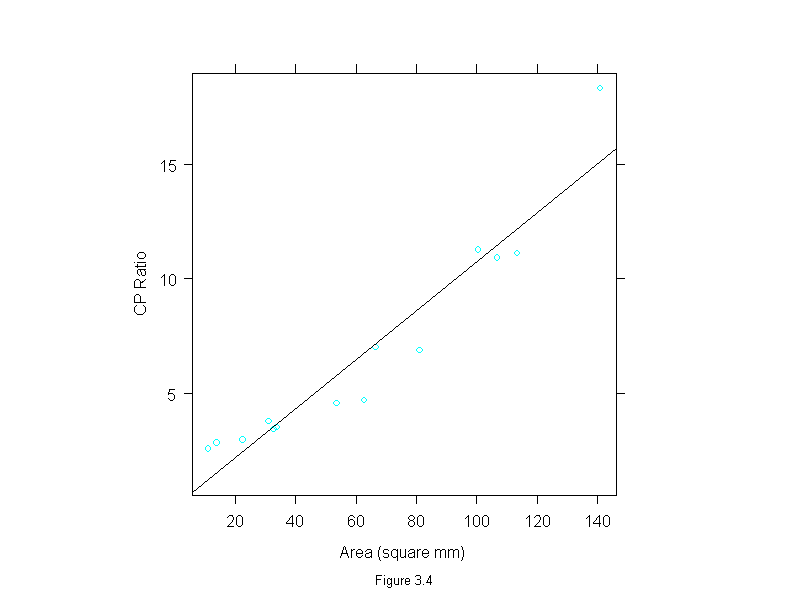
Figure 3.5
attach(ganglion)
add.line <- trellis.par.get("add.line")
gan.lm <- lm(cp.ratio~area+I(area^2))
gan.x <- seq(min(area),max(area),length=50)
gan.fit <- gan.lm$coef[1]+gan.lm$coef[2]*gan.x+gan.lm$coef[3]*gan.x^2
ans <- xyplot(cp.ratio~area,
  prepanel = substitute(function(x, y)
    list(dx = diff(gan.x), dy = diff(gan.fit))),
  panel = substitute(function(x, y) {
    panel.xyplot(x, y)
    lines(gan.x, gan.fit, lwd = add.line$lwd, lty = add.line$lty, col = add.line$col)
  }),
  sub = list("Figure 3.5",cex=.8),
  xlab = "Area (square mm)",
  ylab = "CP Ratio")
detach()
ans
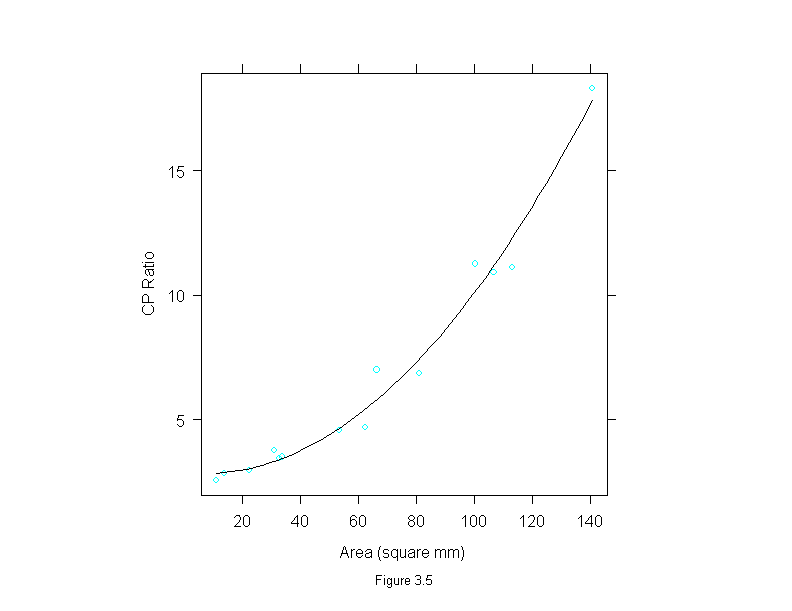
Figure 3.6
x <- seq(5, 10, length=150)
z <- seq(0, 1, length=50)
y <- 5 + c(-(1-z)^.5, sin(z*2*pi), .5*z^2)
fit <- loess.smooth(x, y, degree = 2, family = "g", span = .5, evaluation = 150)
set.seed(20)
y <- fit$y + rnorm(150, 0, .2)
x <- fit$x
xyplot(y ~ x,
  prepanel = function(x, y)
    prepanel.loess(x, y, degree = 2, family = "g", span = .3, evaluation = 300),
  panel = function(x, y){
    panel.xyplot(x, y)
    panel.loess(x, y, degree = 2, family = "g", span = .3, evaluation = 300)
  },
  sub = list("Figure 3.6",cex=.8),
  xlab = "x",
  ylab = "y")
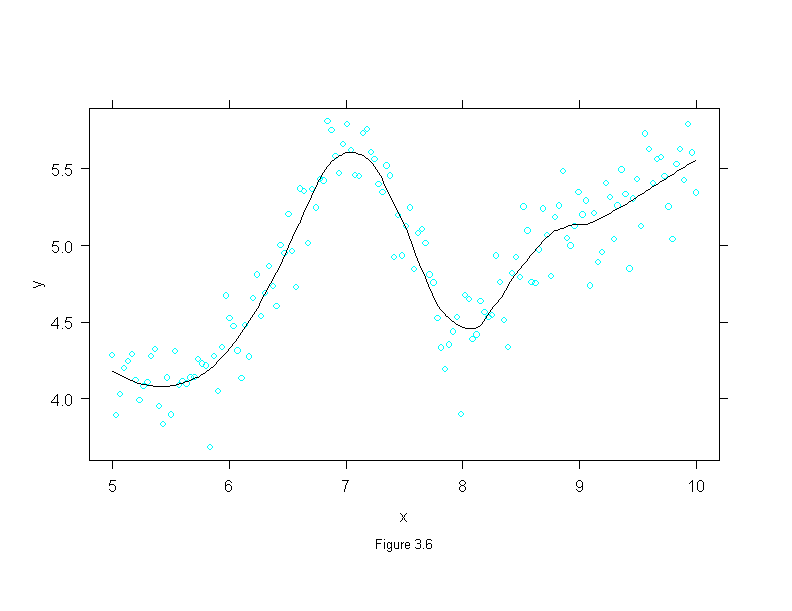
# dont have 3.7, 3.8
Figure 3.9
X <- seq(5, 10, length=150)
z <- seq(0, 1, length=50)
base.y <- 5 + c(-(1-z)^.5, sin(z*2*pi), .5*z^2)
true.y <- loess.smooth(X, base.y, degree = 2, family = "g", span = .5, evaluation = 150)$y
set.seed(20)
Y <- true.y+rnorm(150, 0, .2)
fit1 <- loess.smooth(X, Y, degree = 2, family = "g", span = .1, evaluation = 150)
fit2 <- loess.smooth(X, Y, degree = 2, family = "g", span = .3, evaluation = 150)
fit3 <- loess.smooth(X, Y, degree = 2, family = "g", span = .6, evaluation = 150)
alpha <- factor(rep(c(.1,.3,.6),rep(length(X),3)))
fits <- c(fit1$y, fit2$y, fit3$y)
X <- rep(X,3)
Y <- rep(Y,3)
xyplot(Y ~ X | alpha,
  prepanel = substitute(function(x, y, subscripts) {
    list(dx = diff(x), dy=diff(fits[subscripts]))}),
  panel = substitute(function(x, y, subscripts){
    add.line <- trellis.par.get("add.line")
    panel.xyplot(x, y)
    lines(x, fits[subscripts], lwd = add.line$lwd,        lty = add.line$lty, col = add.line$col)
  }),
  strip = function(...) strip.default(..., strip.names = T),
  layout = c(1, 3),
  sub = list("Figure 3.9",cex=.8),
  xlab = "x",
  ylab = "y")
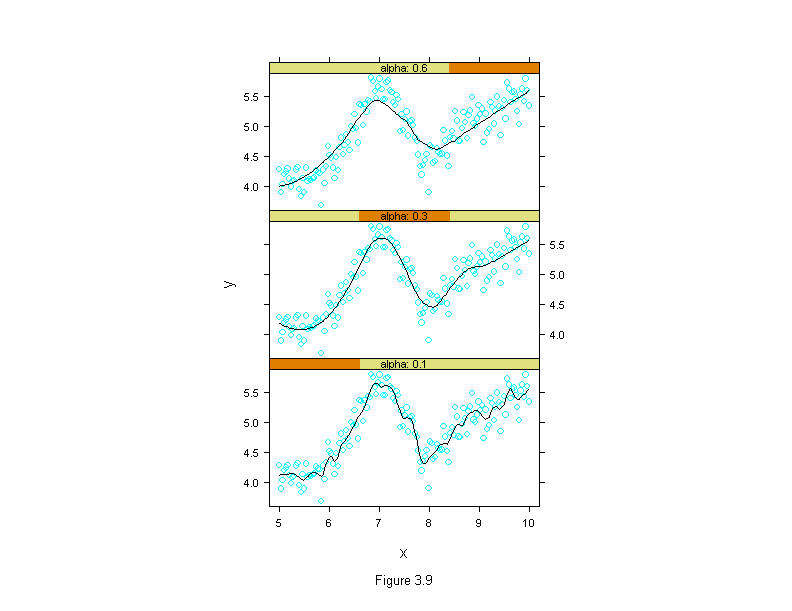
Figure 3.10
X <- seq(5, 10, length=150)
z <- seq(0, 1, length=50)
Y <- 5 + c(-(1-z)^.5, sin(z*2*pi), .5*z^2)
base.y <- 5 + c(-(1-z)^.5, sin(z*2*pi), .5*z^2)
true.y <- loess.smooth(X, base.y, degree = 2, family = "g", span = .5, evaluation = 150)$y
set.seed(20)
Y <- true.y+rnorm(150, 0, .2)
fit1 <- loess.smooth(X, Y, degree = 1, family = "g", span = .1, evaluation = 150)
fit2 <- loess.smooth(X, Y, degree = 1, family = "g", span = .3, evaluation = 150)
fit3 <- loess.smooth(X, Y, degree = 2, family = "g", span = .3, evaluation = 150)
fits <- c(fit1$y, fit2$y, fit3$y)
which <- factor(rep(c(
  "alpha .1, lambda 1",
  "alpha .3, lambda 1",
  "alpha .3, lambda 2"), rep(length(X),3)))
X <- rep(X,3)
Y <- rep(Y,3)
xyplot(Y ~ X | which,
  prepanel = substitute(function(x, y, subscripts) {
    list(dx = diff(x), dy=diff(fits[subscripts]))}),
  panel = substitute(function(x, y, subscripts){
    add.line <- trellis.par.get("add.line")
    panel.xyplot(x, y)
    lines(x, fits[subscripts], lwd = add.line$lwd,
      lty = add.line$lty, col = add.line$col)
  }),
  layout = c(1, 3),
  sub = list("Figure 3.10",cex=.8),
  xlab = "x",
  ylab = "y")
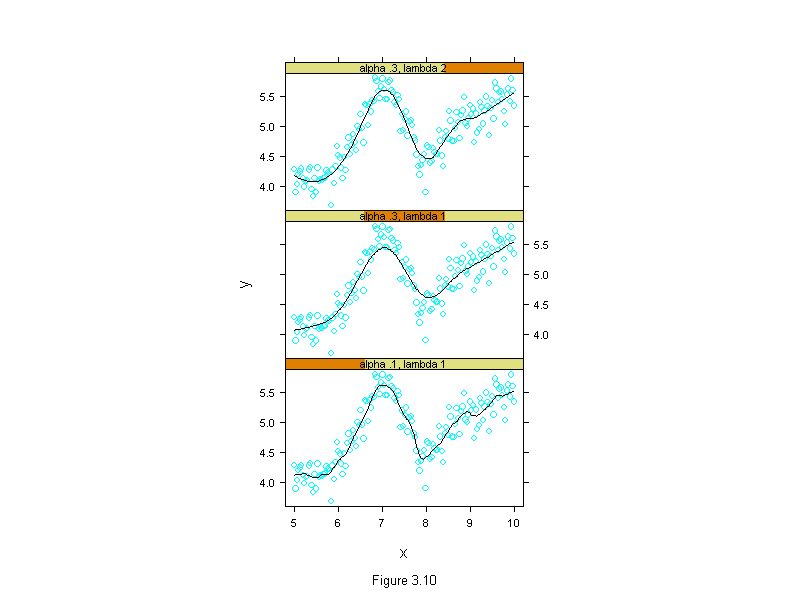
Figure 3.11
x <- seq(5, 10, length=150)
z <- seq(0, 1, length=50)
base.y <- 5 + c(-(1-z)^.5, sin(z*2*pi), .5*z^2)
true.y <- loess.smooth(x,base.y,degree = 2, family = "g", span = .5, evaluation = 150)$y
set.seed(20)
y <- true.y+rnorm(150, 0, .2)
fit <- loess.smooth(x, y, degree = 2, family = "g", span = .5, evaluation = 150)
xyplot(y ~ fit$x,
  prepanel = function(x, y)
    prepanel.loess(x, y, degree = 2, family = "g", span = .3, evaluation = 300),
  panel = function(x, y){
    panel.xyplot(x, y)
    panel.loess(x, y, degree = 2, family = "g", span = .3, evaluation = 300)
    panel.abline(v = c(5.3, 5.7))
  },
  sub = list("Figure 3.11",cex=.8),
  xlab = "x",
  ylab = "y")
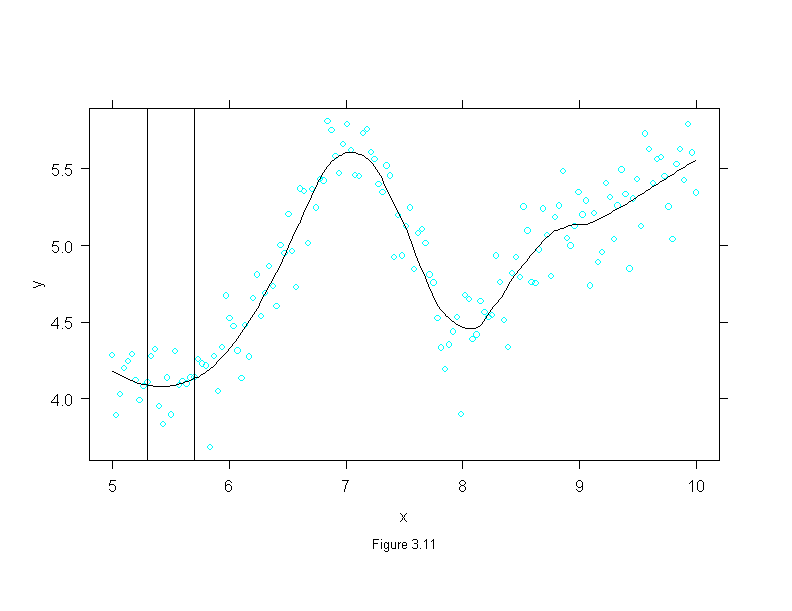
Figure 3.12
xyplot(lm(cp.ratio~area)$residuals ~ area,
  data = ganglion,
  prepanel = function(x, y)
    prepanel.loess(x, y, span=1, family = "g"),
  panel = function(x,y){
    panel.xyplot(x,y)
    panel.loess(x, y, span=1, family = "g")
    panel.abline(h=0)
  },
  aspect=1,
  sub = list("Figure 3.12",cex=.8),
  xlab = "Area (square mm)",
  ylab="Residual CP Ratio")
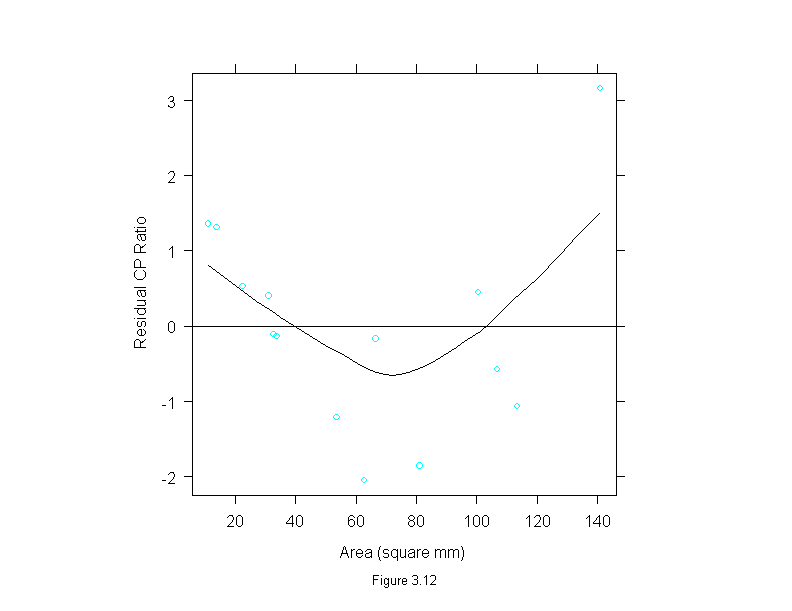
Figure 3.13
xyplot(lm(cp.ratio~area+I(area^2))$residuals ~ area,
  data = ganglion,
  prepanel = function(x, y)
    prepanel.loess(x, y, span=1, family = "g"),
  panel = function(x,y){
    panel.xyplot(x,y)
    panel.loess(x, y, span=1, family = "g")
    panel.abline(h=0)
  },
  aspect=1,
  sub = list("Figure 3.13",cex=.8),
  xlab = "Area (square mm)",
  ylab="Residual CP Ratio")
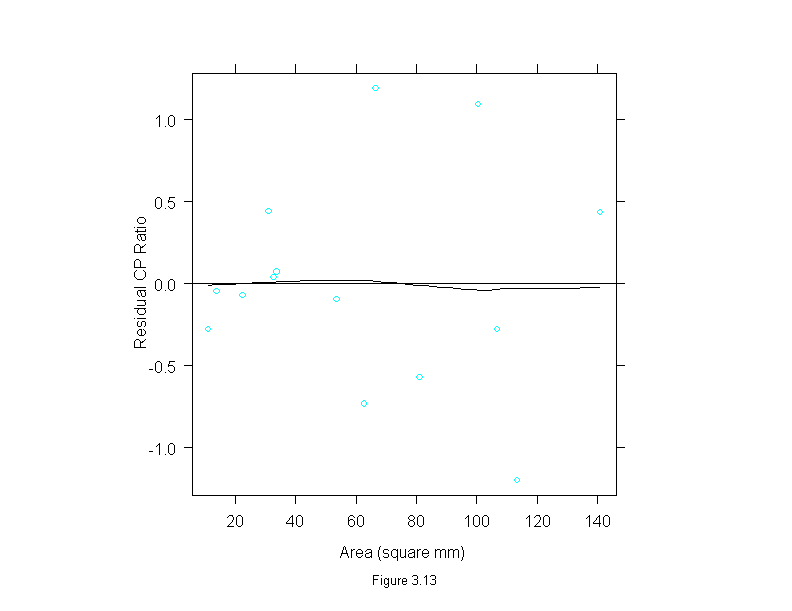
Figure 3.14
gan.lm <- lm(cp.ratio~area+I(area^2), data = ganglion)
xyplot(sqrt(abs(residuals(gan.lm))) ~ gan.lm$fit,
  panel = function(x,y){
    panel.xyplot(x,y)
    panel.loess(x, y, span=2, evaluation=100, family = "g")
  },
  aspect=1,
  sub = list("Figure 3.14",cex=.8),
  xlab = "Fitted CP Ratio",
  ylab = "Square Root Absolute Residual CP Ratio")
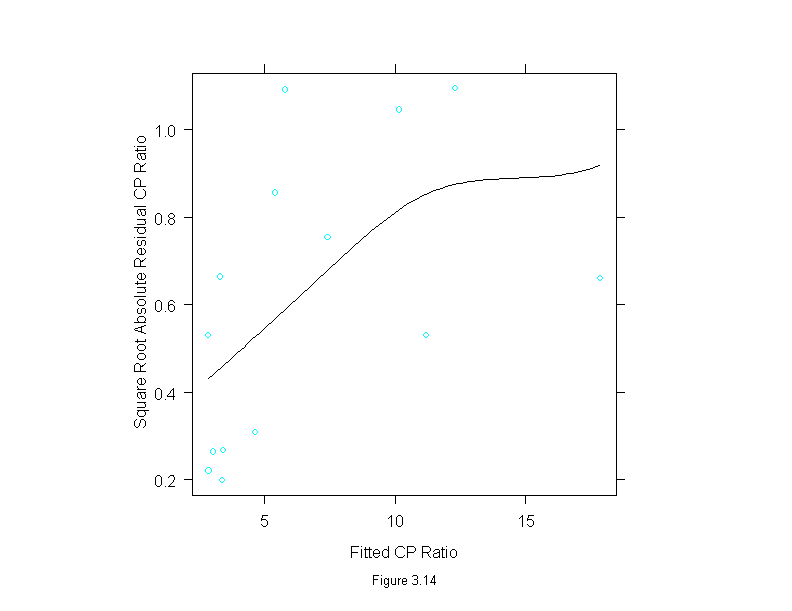
Figure 3.15
xyplot(logb(cp.ratio,2) ~ area,
  data = ganglion,
  prepanel=function(x,y)
    prepanel.loess(x,y,family="g"),
  panel = function(x,y){
    panel.xyplot(x,y)
    panel.loess(x,y, family = "g")
  },
  aspect="xy",
  sub = list("Figure 3.15",cex=.8),
  xlab = "Area (square mm)",
  ylab = "Log Base 2 CP Ratio")
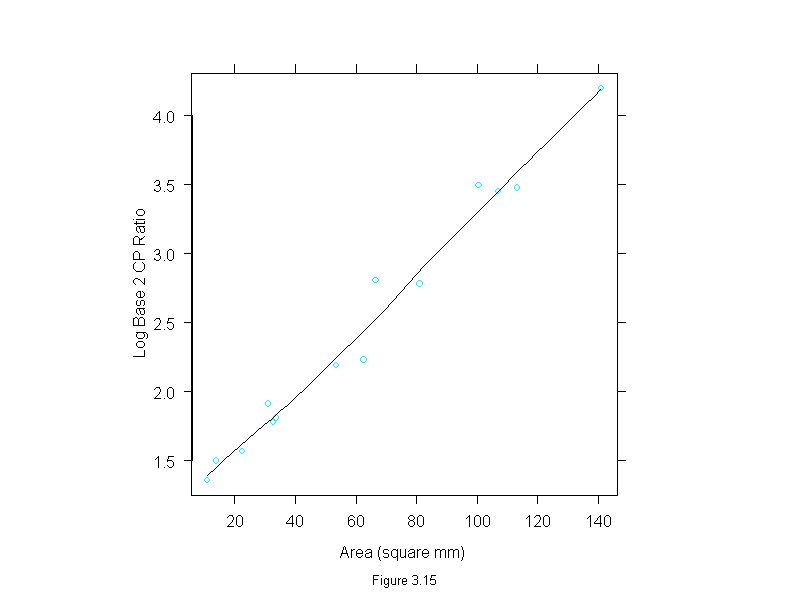
Figure 3.16
xyplot(logb(cp.ratio,2) ~ area,
  data = ganglion,
  prepanel = prepanel.lmline,
  panel = substitute(function(x, y) {
    panel.xyplot(x, y)
    panel.abline(lm(logb(cp.ratio,2)~area, data = ganglion))
  }),
  aspect=1,
  sub = list("Figure 3.16",cex=.8),
  xlab = "Area (square mm)",
  ylab = "Log Base 2 CP Ratio")
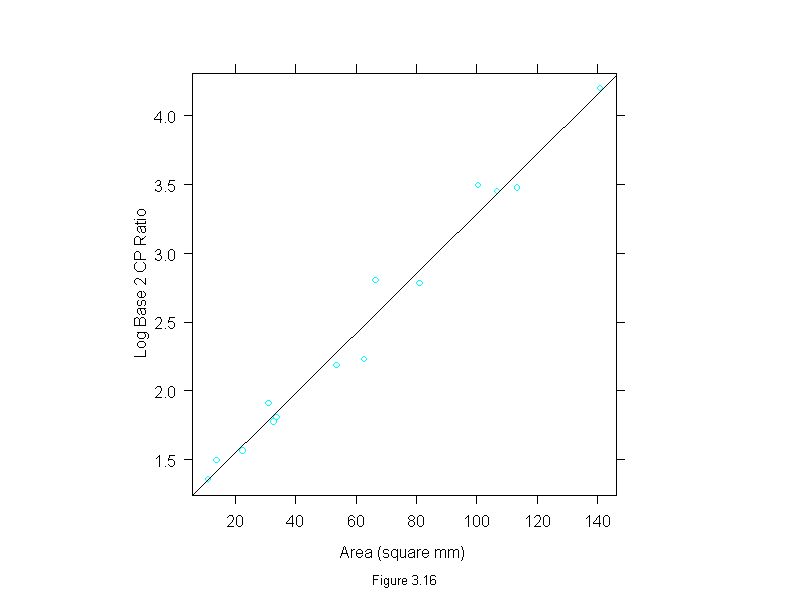
Figure 3.17
gan.lm <- lm(logb(cp.ratio,2) ~ area, data = ganglion)
xyplot(gan.lm$res ~ ganglion$area,
  prepanel = function(x, y)
    prepanel.loess(x, y,span=1, evaluation=100, family = "g"),
  panel = function(x,y){
    panel.xyplot(x,y)
    panel.loess(x, y, span=1, evaluation=100, family = "g")
    panel.abline(h=0)
  },
  aspect=1,
  sub = list("Figure 3.17",cex=.8),
  xlab = "Area (square mm)",
  ylab="Residual Log Base 2 CP Ratio")
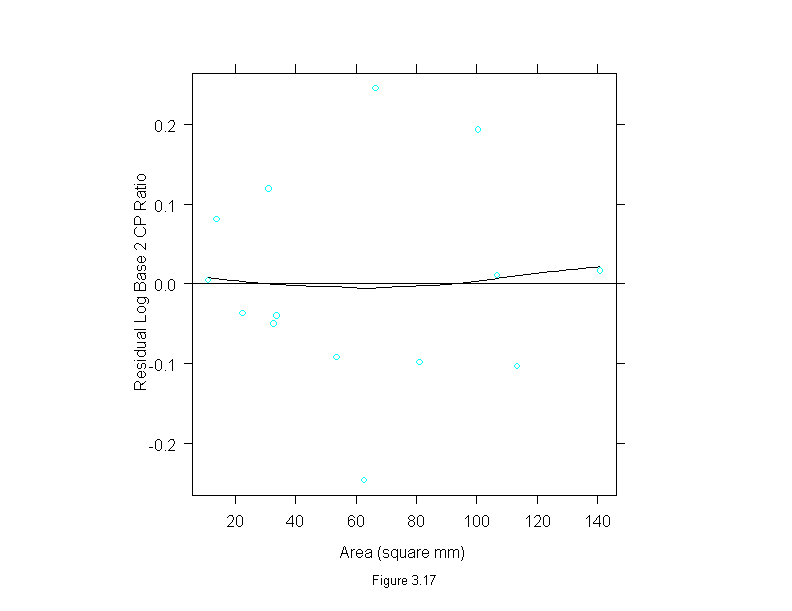
Figure 3.18
gan.lm <- lm(logb(cp.ratio,2) ~ area, data = ganglion)
xyplot(sqrt(abs(gan.lm$res)) ~ gan.lm$fit,
  prepanel = function(x, y)
    prepanel.loess(x, y,span=2, evaluation=100, family = "g"),
  panel = function(x,y){
    panel.xyplot(x,y)
    panel.loess(x, y, span=2, evaluation=100, family = "g")
  },
  aspect=1,
  sub = list("Figure 3.18",cex=.8),
  xlab = "Fitted Log Base 2 CP Ratio",
  ylab = "Square Root Absolute Residual Log Base 2 CP Ratio")
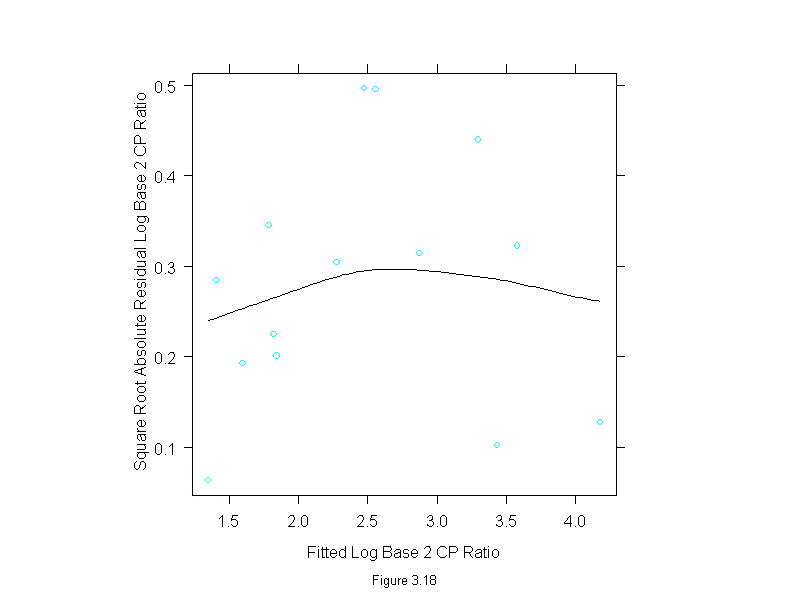
Figure 3.19
rfs(lm(logb(cp.ratio,2) ~ area, data = ganglion),
  sub = list("Figure 3.19",cex=.8),
  aspect=2,
  ylab="Log Base 2 CP Ratio")
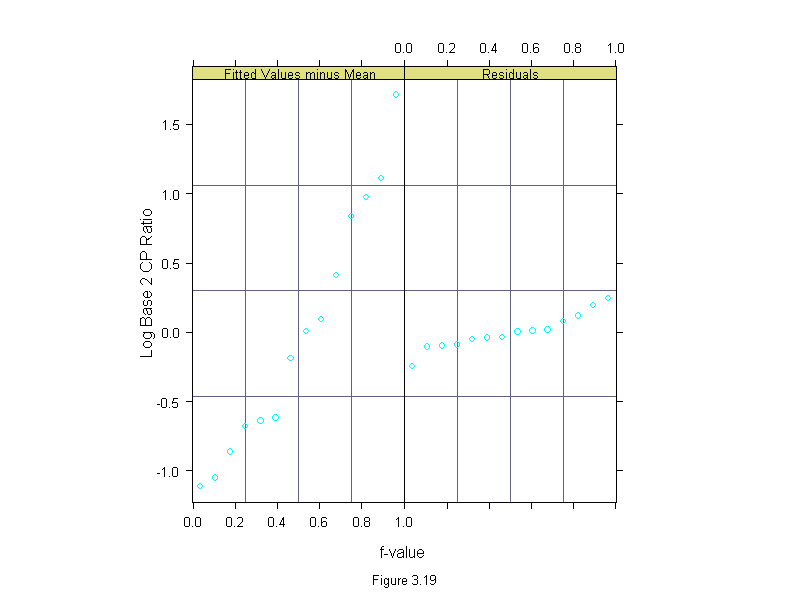
Figure 3.20
qqmath(~lm(logb(cp.ratio,2) ~ area, data = ganglion)$residuals,
  prepanel = prepanel.qqmathline,
  panel = function(x,y){
    panel.qqmathline(y, distribution = qnorm)
    panel.qqmath(x,y)
  },
  aspect = 1,
  sub = list("Figure 3.20",cex=.8),
  xlab = "Unit Normal Quantile",
  ylab = "Residual Log Base 2 CP Ratio")
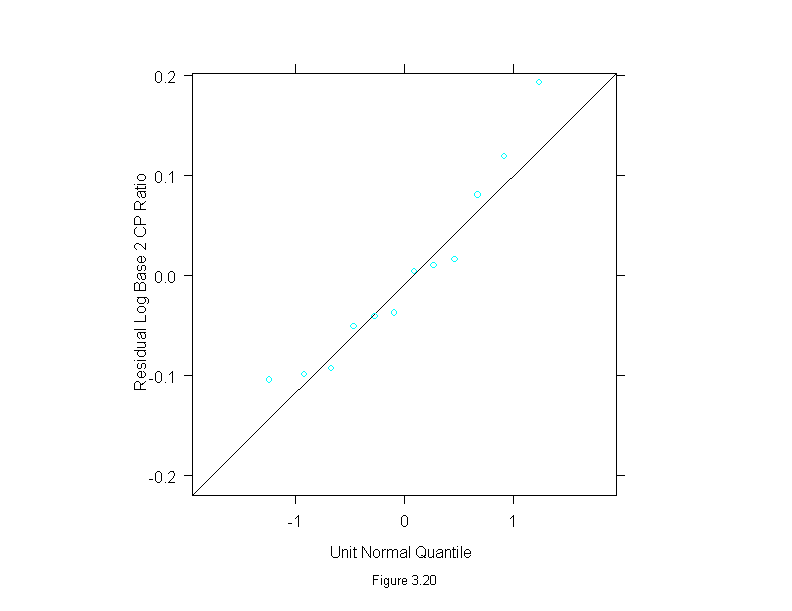
Figure 3.21
xyplot((thorium - carbon) ~ carbon,
  data = dating,
  aspect=1,
  sub = list("Figure 3.21",cex=.8),
  xlab = "Carbon Age (kyr BP)",
  ylab = "Thorium Age - Carbon Age (kyr BP)")
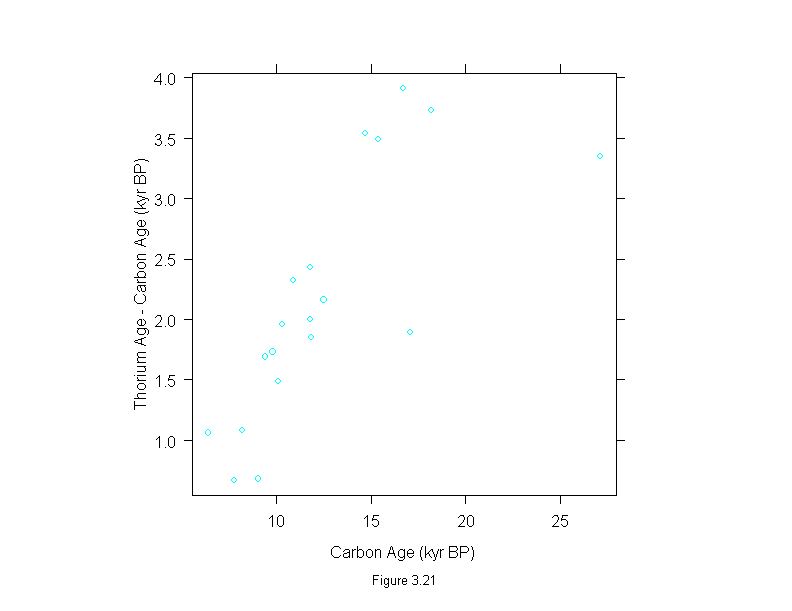
Figure 3.22
difference <- dating$thorium - dating$carbon
xyplot(difference ~ dating$carbon,
#  prepanel = prepanel.lmline,
  panel = substitute(function(x, y) {
    panel.xyplot(x, y)
    panel.abline(lm(difference~dating$carbon))
  }),
  aspect = 1,
  sub = list("Figure 3.22",cex=.8),
  xlab = "Carbon Age (kyr BP)",
  ylab = "Thorium Age - Carbon Age (kyr BP)")
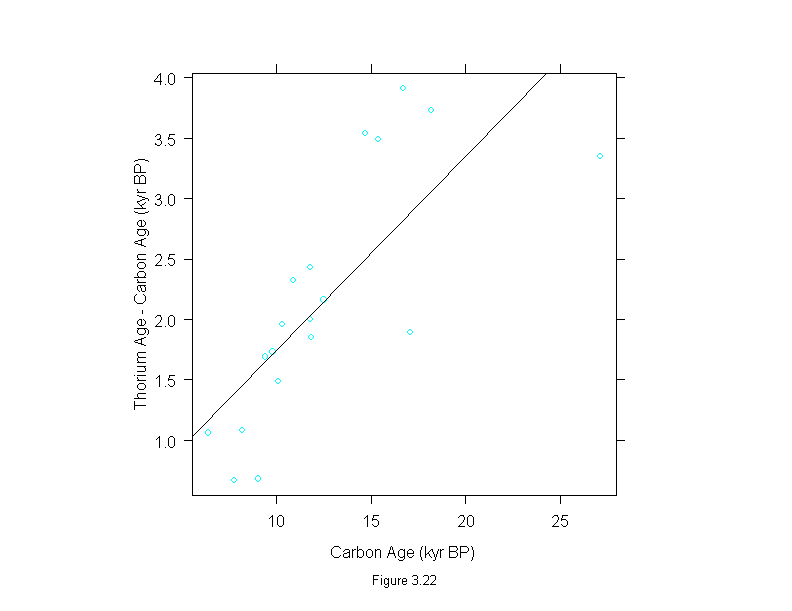
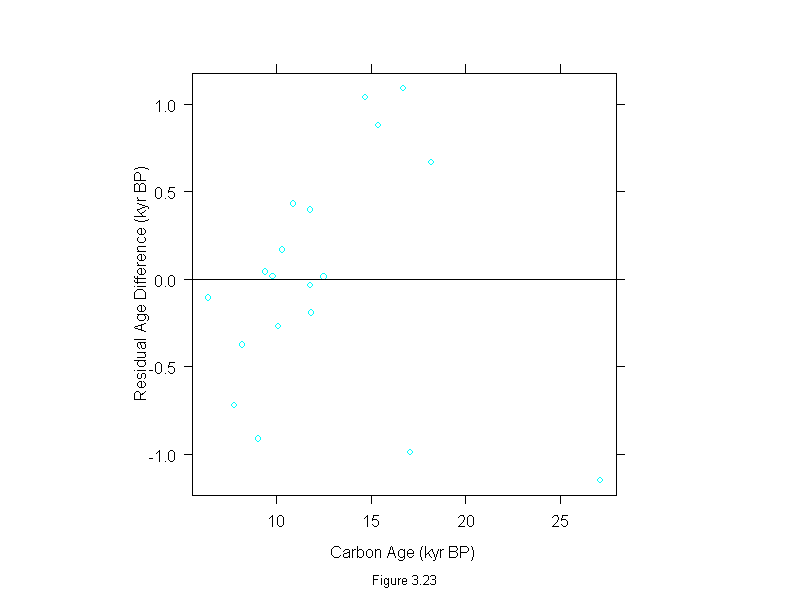
Figure 3.23
xyplot(lm((thorium - carbon)~carbon, data = dating)$residuals ~ dating$carbon,
  panel = function(x, y) {
    panel.xyplot(x, y)
    panel.abline(h=0)
  },
  aspect=1,
  sub = list("Figure 3.23",cex=.8),
  xlab = "Carbon Age (kyr BP)",
  ylab = "Residual Age Difference (kyr BP)")
# dont have 3.24
Figure 3.25
attach(dating)
difference <- thorium - carbon
wt <- rep(1,length(difference))
for(i in 1:10){
  dat.lm <- lm(difference~carbon,weights=wt)
  wt <- wt.bisquare(dat.lm$res/median(abs(dat.lm$res)),c=6)
ylim <- range(fitted.values(dat.lm),difference)
ans <- xyplot(difference~carbon,
#  ylim = ylim,
  panel = substitute(function(x, y) {
    panel.xyplot(x, y)
    panel.abline(dat.lm)
  }),
  aspect=1,
  sub = list("Figure 3.25",cex=.8),
  xlab = "Carbon Age (kyr BP)",
  ylab = "Thorium Age - Carbon Age (kyr BP)")
detach()
ans
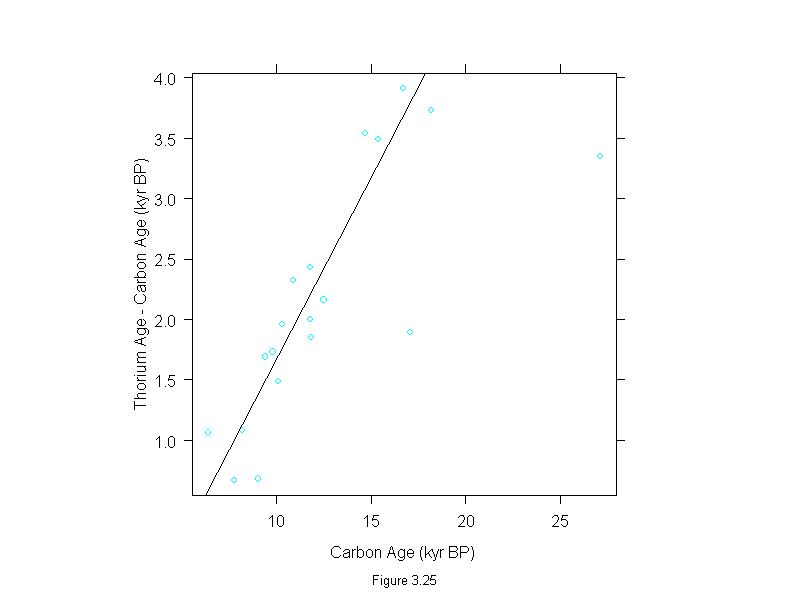
Figure 3.26
attach(dating)
difference <- thorium - carbon
wt <- rep(1,length(difference))
for(i in 1:10){
  dat.lm <- lm(difference~carbon,weights=wt)
  wt <- wt.bisquare(dat.lm$res/median(abs(dat.lm$res)),c=6)
ans <- xyplot(residuals(dat.lm)~carbon,
  panel = function(x, y) {
    panel.xyplot(x, y)
    panel.abline(h=0)
  },
  aspect=1,
  sub = list("Figure 3.26",cex=.8),
  xlab = "Carbon Age (kyr BP)",
  ylab = "Residual Age Difference (kyr BP)")
detach()
ans
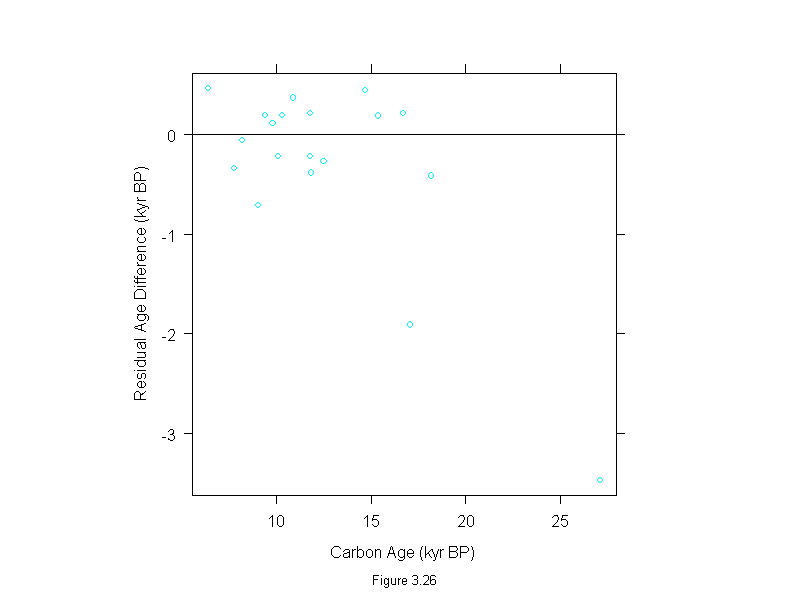
Figure 3.27
attach(dating)
difference <- thorium - carbon
wt <- rep(1,length(difference))
for(i in 1:10){
  dat.lm <- lm(difference~carbon,weights=wt)
  wt <- wt.bisquare(dat.lm$res/median(abs(dat.lm$res)),c=6)
ans <- qqmath(~residuals(dat.lm),
  prepanel = prepanel.qqmathline,
  panel = function(x, y) {
    panel.qqmathline(y, distribution = qnorm)
    panel.qqmath(x, y)
  },
  sub = list("Figure 3.27",cex=.8),
  xlab = "Unit Normal Quantile",
  ylab = "Residual Age Difference (kyr BP)",    aspect=1)
detach()
ans
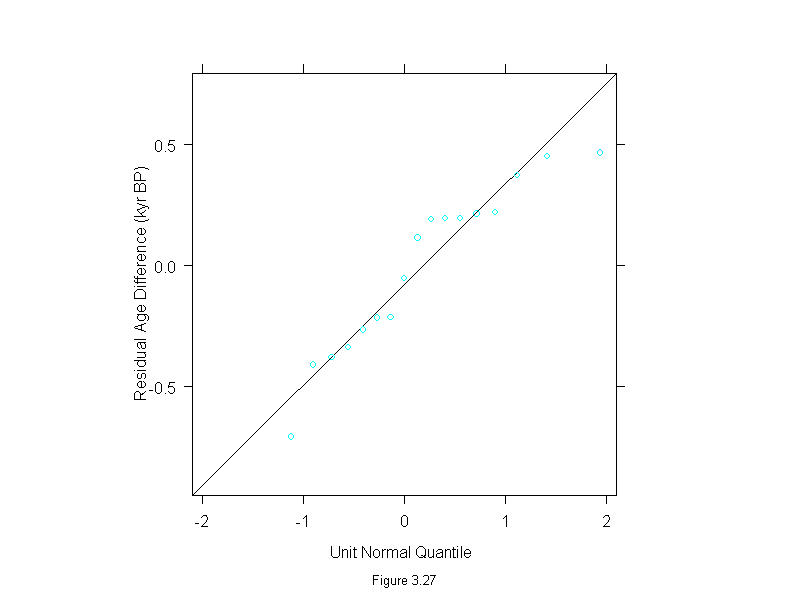
Figure 3.28
xyplot(babinet~concentration,
  data = polarization,
  aspect=1,
  sub = list("Figure 3.28",cex=.8),
  xlab = "Concentration (micrograms per cubic meter)",
  ylab = "Babinet Point (degrees)")
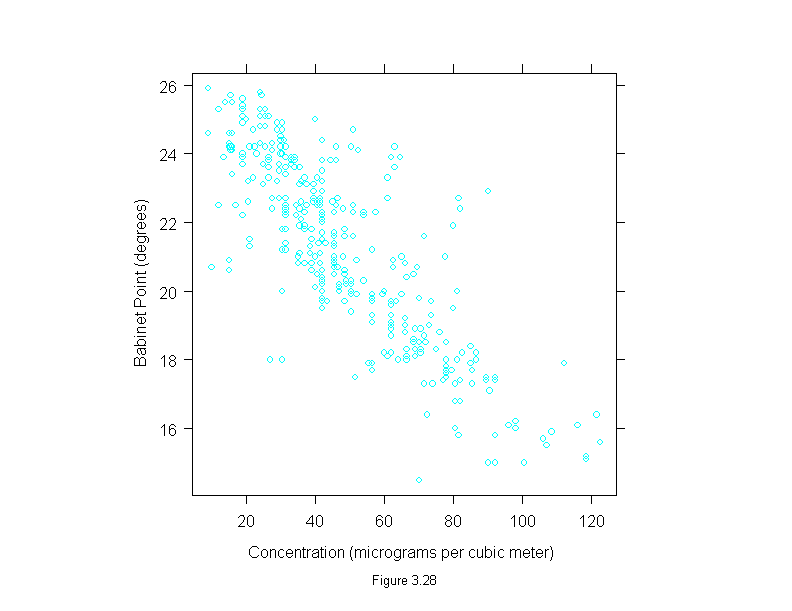
Figure 3.29
attach(polarization)
transformed <- c(concentration^(-1/3),log(concentration),
  concentration^(1/3),concentration)
lambda <- factor(rep(c("-1/3","0","1/3","1"), rep(length(concentration),4)))
lambda <- ordered(lambda, c("-1/3","0","1/3","1"))
ans <- qqmath(~transformed|lambda,
  prepanel = prepanel.qqmathline,
  panel = function(x, y) {
    panel.grid(h = 0)
    panel.qqmathline(y, distribution = qnorm)
    panel.qqmath(x, y)
  },
  aspect=1,
  scale = list(y = "free"),
  layout=c(2,2),
  sub = list("Figure 3.29",cex=.8),
  xlab = "Unit Normal Quantile",
  ylab = "Concentration")
detach()
ans
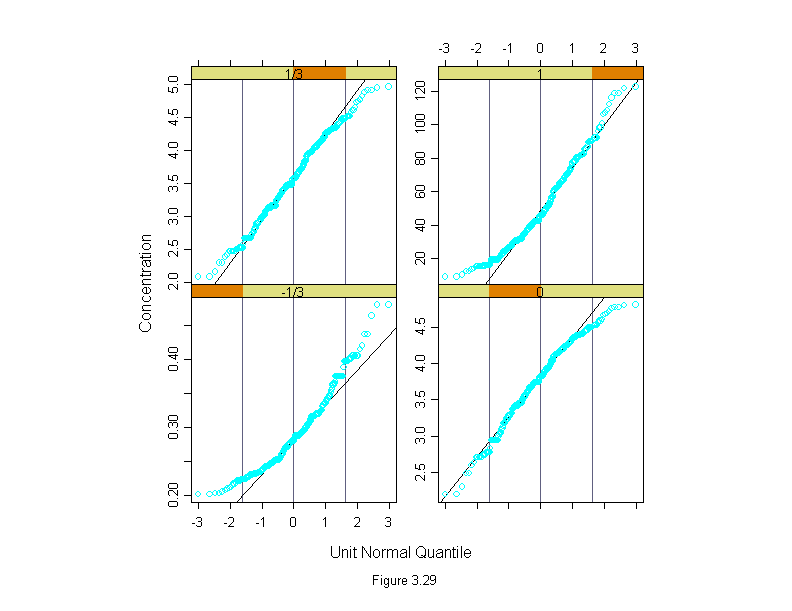
Figure 3.30
xyplot(babinet~concentration^(1/3),
  data=polarization,
  aspect=1,
  sub = list("Figure 3.30",cex=.8),
  xlab = "Cube Root Concentration (cube root micrograms per meter)",
  ylab = "Babinet Point (degrees)")
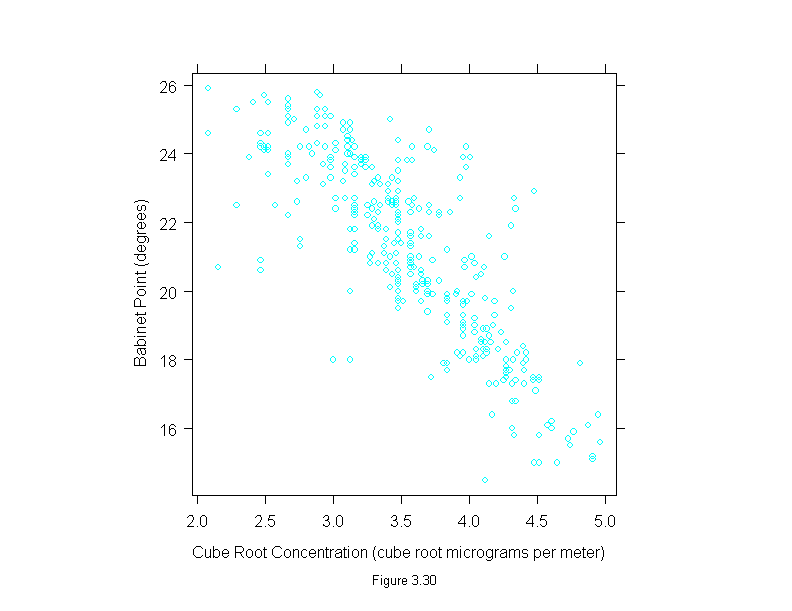
Figure 3.31
set.seed(19)
xyplot(jitter(babinet)~jitter(concentration^(1/3)),
  data=polarization,
  aspect=1,
  sub = list("Figure 3.31",cex=.8),
  xlab = "Jittered Cube Root Concentration (cube root micrograms per meter)",
  ylab = "Jittered Babinet Point (degrees)")
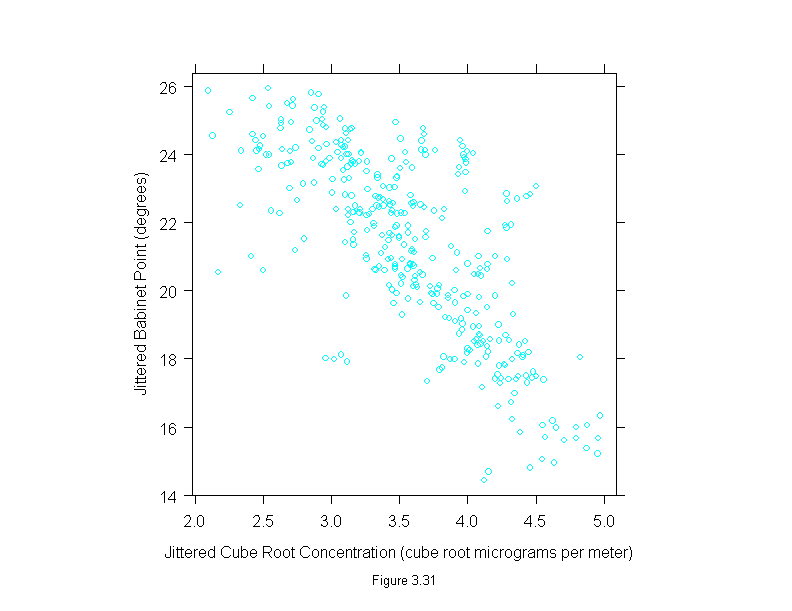
Figure 3.32
attach(polarization)
add.line <- trellis.par.get("add.line")
set.seed(19)
curve <- loess.smooth(concentration^(1/3), babinet, span = 3/4)
y <- jitter(babinet)
x <- jitter(concentration^(1/3))
ans <- xyplot(y ~ x,
       prepanel = substitute(function(x, y)
    list(dx = diff(curve$x), dy = diff(curve$y))),
       panel = substitute(function(x, y){
    panel.xyplot(x, y)
    lines(curve, lwd = add.line$lwd, lty = add.line$lty, col = add.line$col)
       }),
  sub = list("Figure 3.32",cex=.8),
       xlab = "Jittered Cube Root Concentration (cube root micrograms per meter)",
       ylab = "Jittered Babinet Point (degrees)")
detach()
ans
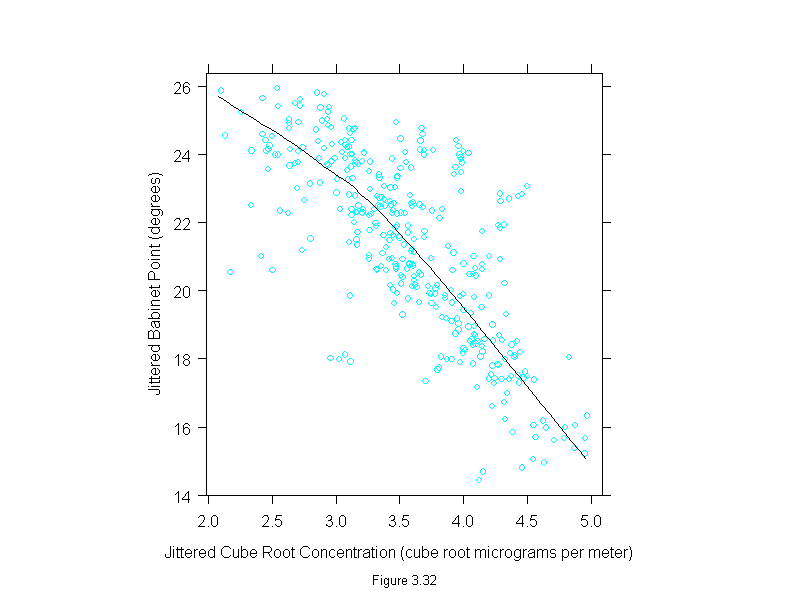
Figure 3.33
attach(polarization)
conc <- concentration^(1/3)
set.seed(19)
ans <- xyplot(residuals(loess(babinet~conc,span=3/4,family="s",degree=1)) ~ jitter(conc),
  panel = substitute(function(x, y) {
    panel.xyplot(x, y)
    panel.loess(conc,y,span = 1/3)
    panel.abline(h=0)
  }),
  aspect=1,
  sub = list("Figure 3.33",cex=.8),
  xlab = "Jittered Cube Root Concentration (cube root micrograms per meter)",
  ylab = "Residual Babinet Point (degrees)")
detach()
ans
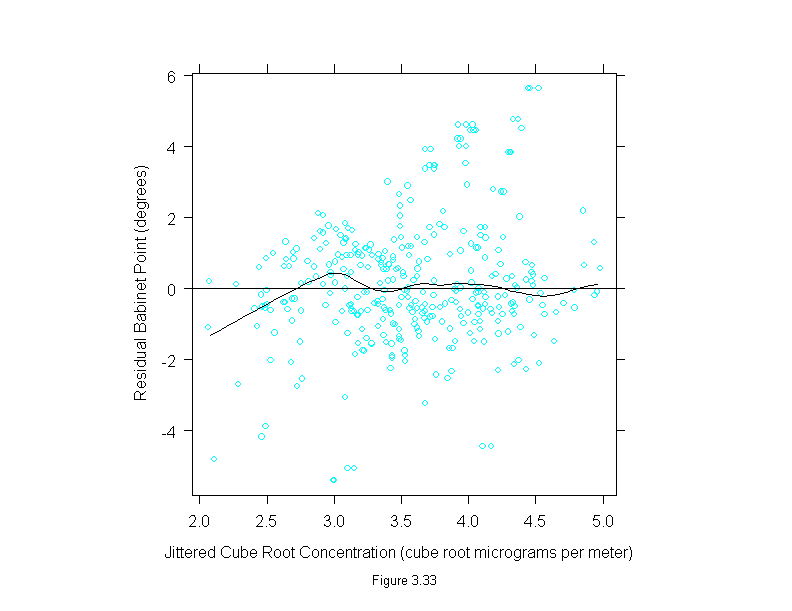
Figure 3.34
attach(polarization)
add.line <- trellis.par.get("add.line")
set.seed(19)
curve <- loess.smooth(concentration^(1/3), babinet, span = 1/6, evaluation=200)
y <- jitter(babinet)
x <- jitter(concentration^(1/3))
ans <- xyplot(y ~ x,
       prepanel = substitute(function(x, y)
    list(dx = diff(curve$x), dy = diff(curve$y))),
       panel = substitute(function(x, y){
    panel.xyplot(x, y)
    lines(curve, lwd = add.line$lwd, lty = add.line$lty, col = add.line$col)
       }),
  sub = list("Figure 3.34",cex=.8),
       xlab = "Jittered Cube Root Concentration (cube root micrograms per meter)",
       ylab = "Jittered Babinet Point (degrees)")
detach()
ans
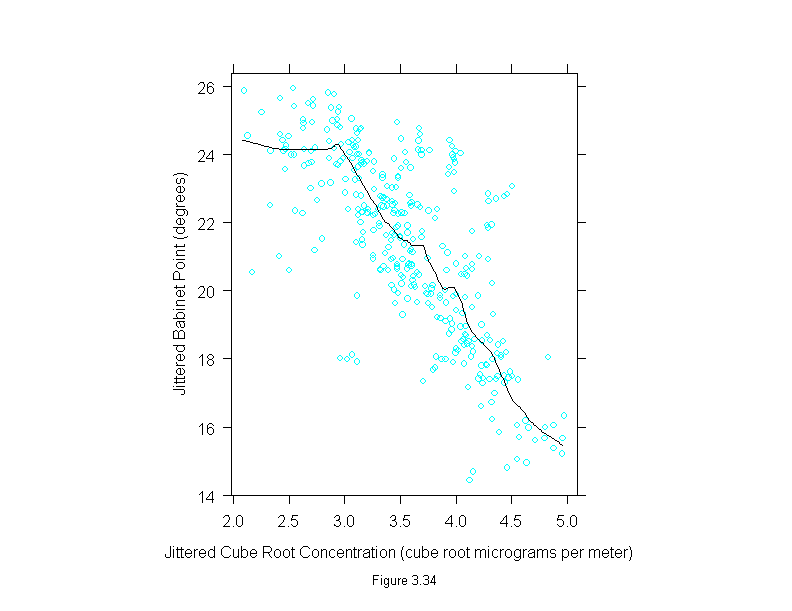
Figure 3.35
conc <- polarization$concentration^(1/3)
set.seed(19)
xyplot(residuals(loess(polarization$babinet ~ conc, span=1/6,family="s",degree=1)) ~ jitter(conc),
  panel = substitute(function(x, y) {
    panel.xyplot(x, y)
    panel.loess(conc, y, span = 1/3)
    panel.abline(h=0)
  }),
  aspect=1,
  sub = list("Figure 3.35",cex=.8),
  xlab = "Jittered Cube Root Concentration (cube root micrograms per meter)",
  ylab = "Residual Babinet Point (degrees)")
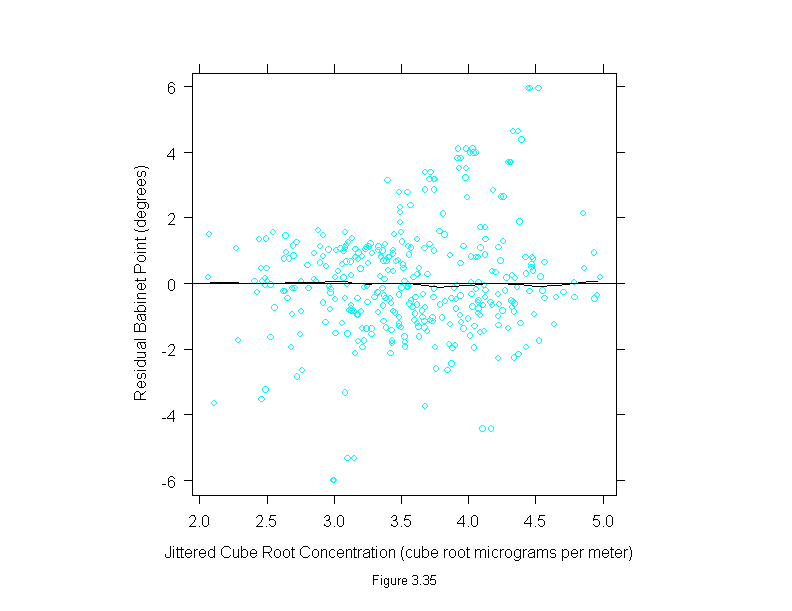
Figure 3.36
attach(polarization)
set.seed(19)
curve <- loess.smooth(concentration^(1/3), babinet, span = 1/3)
y <- jitter(babinet)
x <- jitter(concentration^(1/3))
ans <- xyplot(y ~ x,
       prepanel = substitute(function(x, y)
    list(dx = diff(curve$x), dy = diff(curve$y))),
       panel = substitute(function(x, y){
    add.line <- trellis.par.get("add.line")
    panel.xyplot(x, y)
    lines(curve, lwd = add.line$lwd, lty = add.line$lty, col = add.line$col)
       }),
  sub = list("Figure 3.36",cex=.8),
       xlab = "Jittered Cube Root Concentration (cube root micrograms per meter)",
       ylab = "Babinet Point (degrees)")
detach()
ans
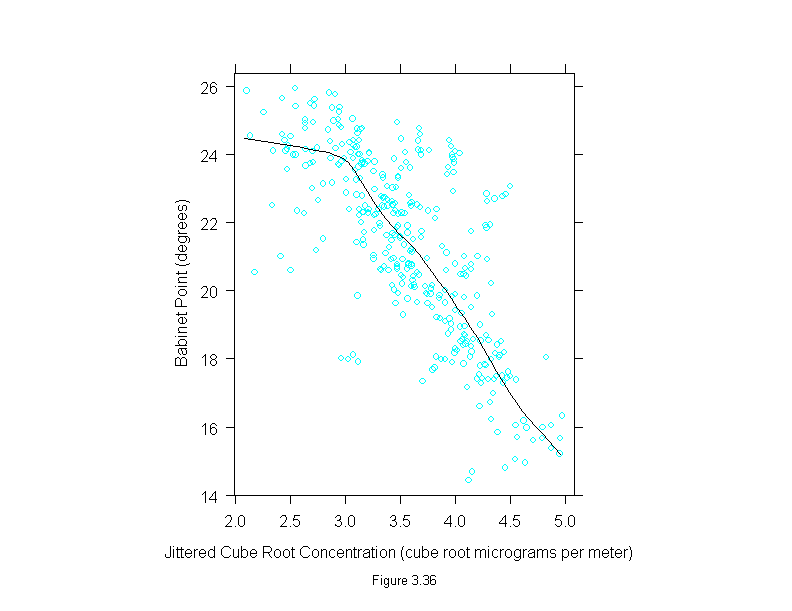
Figure 3.37
conc <- polarization$concentration^(1/3)
set.seed(19)
xyplot(residuals(loess(polarization$babinet ~ conc, span=1/3,family="s",degree=1))~jitter(conc),
  panel = substitute(function(x, y) {
    panel.xyplot(x, y)
    panel.loess(conc, y, span = 1/3)
    panel.abline(h=0)
  }),
  aspect=1,
  sub = list("Figure 3.37",cex=.8),
  xlab = "Jittered Cube Root Concentration (cube root micrograms per meter)",
  ylab = "Residual Babinet Point (degrees)")
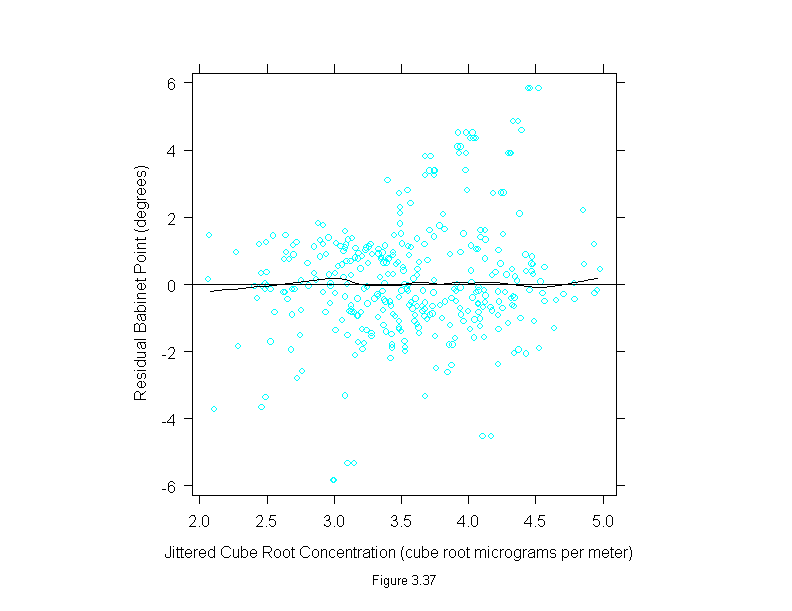
Figure 3.38
qqmath(~residuals(loess(babinet~concentration^(1/3), data = polarization, span=1/3, family="s", degree=1)),
  prepanel = prepanel.qqmathline,
  panel = function(x, y) {
    panel.qqmathline(y, distribution = qnorm)
    panel.qqmath(x, y)
  },
  aspect = 1,
  sub = list("Figure 3.38",cex=.8),
  xlab = "Unit Normal Quantile",
  ylab = "Residual Babinet Point (degrees)")
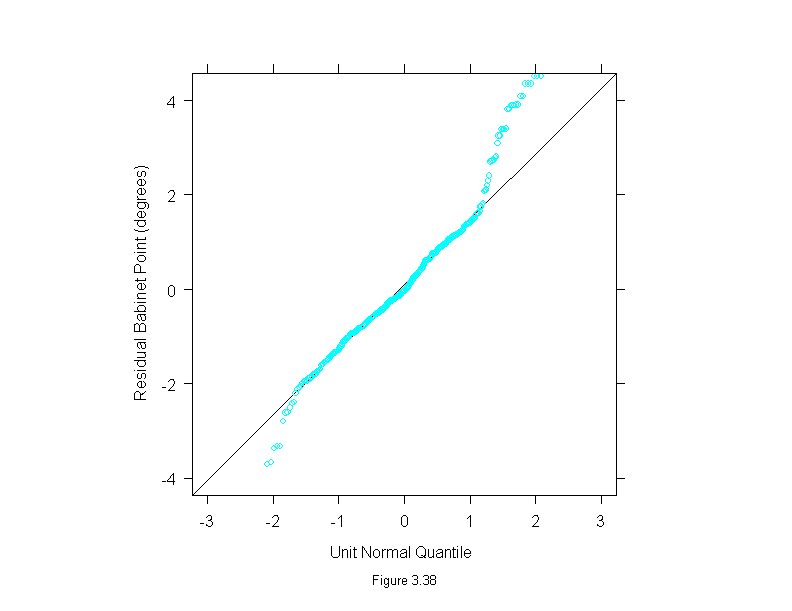
Figure 3.39
rfs(loess(babinet~concentration^(1/3), data = polarization, span=1/3, family="s", degree=1),
  sub = list("Figure 3.39",cex=.8),
  aspect=1.5,
  ylab="Babinet Point (degrees)")
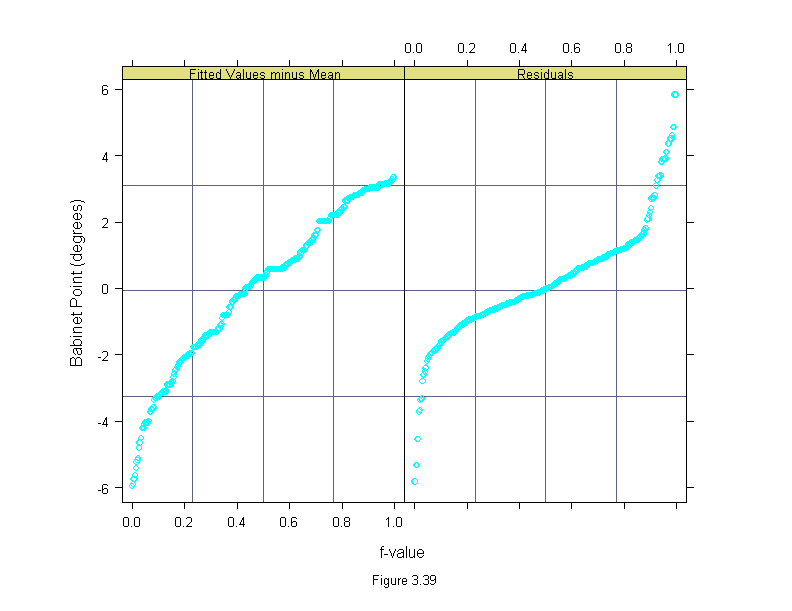
Figure 3.40
xyplot(babinet ~ concentration^(1/3),
  data = polarization,
  prepanel = function(x, y)
    prepanel.loess(x, y, span = 1/3),
  panel = function(x, y) {
    panel.xyplot(x, y)
    panel.abline(v = c(3.936497, 4.188859))
  },
  sub = list("Figure 3.40",cex=.8),
  xlab = "Cube Root Concentration (cube root micrograms per meter)",
  ylab = "Babinet Point (degrees)")
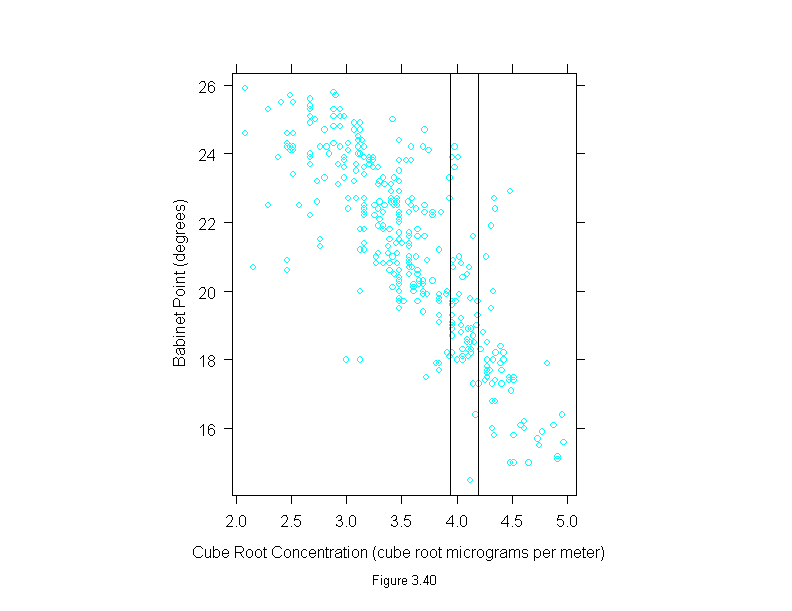
Figure 3.41
xyplot(babinet ~ concentration^(1/3),
  data = polarization,
  prepanel = function(x, y)
    prepanel.loess(x, y, span = 1/3),
  panel = function(x, y) {
    panel.xyplot(x, y)
    panel.loess(x, y, span = 1/3)
    panel.abline(v = c(3.936497, 4.188859))
  },
  sub = list("Figure 3.41",cex=.8),
  xlab = "Cube Root Concentration (cube root micrograms per meter)",
  ylab = "Babinet Point (degrees)")
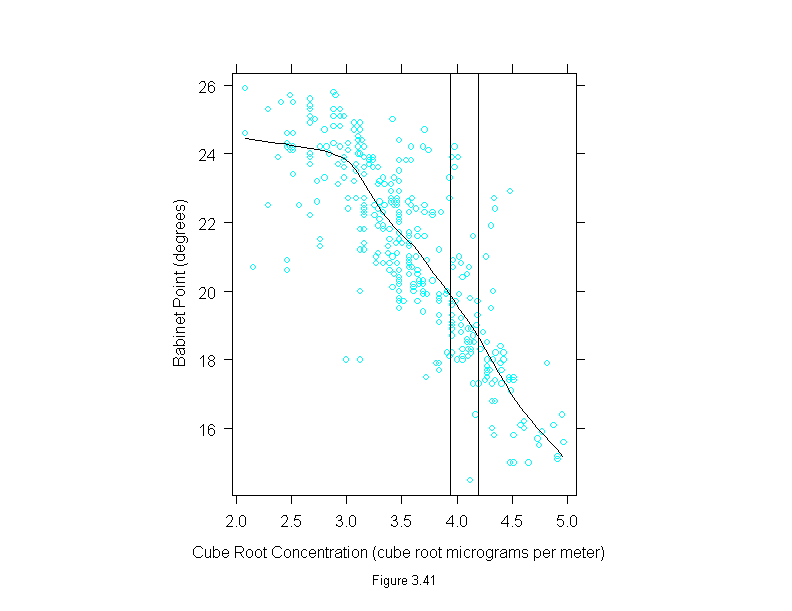
Figure 3.42
xyplot(residuals(loess(babinet ~ concentration^(1/3), span = 1/3,
    family = "s", degree = 1)) ~ concentration^(1/3),
  data = polarization,
  panel = function(x, y) {
    panel.xyplot(x, y)
    panel.abline(h = 0, v = c(3.936497, 4.188859))
  },
  sub = list("Figure 3.42",cex=.8),
  xlab = "Cube Root Concentration (cube root micrograms per meter)",
  ylab = "Residual Babinet Point (degrees)")
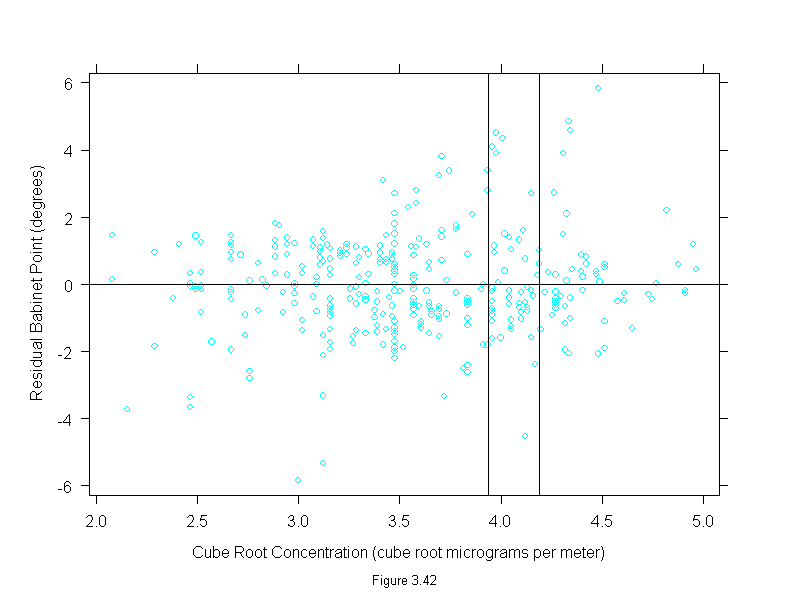
Figure 3.43
plot(equal.count(polarization$concentration^(1/3), 15, .5),
  aspect = 1,
  sub = list("Figure 3.43",cex=.8),
  xlab = "Cube Root Concentration (cube root micrograms per meter)")
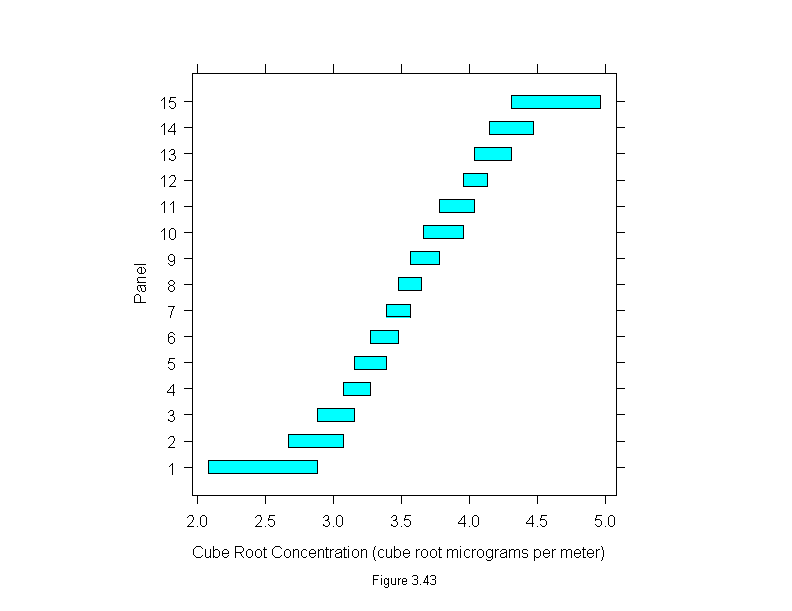
Figure 3.44
attach(polarization)
cube.root <- concentration^(1/3)
pol.m <- loess(babinet~cube.root,span=1/3,family="s",degree=1)
ans <- bwplot(equal.count(cube.root,15,1/2) ~ residuals(pol.m),
  panel = function(x, y) {
    panel.bwplot(x, y)
    panel.abline(v=0)
  },
  aspect=1,
  sub = list("Figure 3.44",cex=.8),
  xlab="Residual Babinet Point (degrees)")
detach()
ans
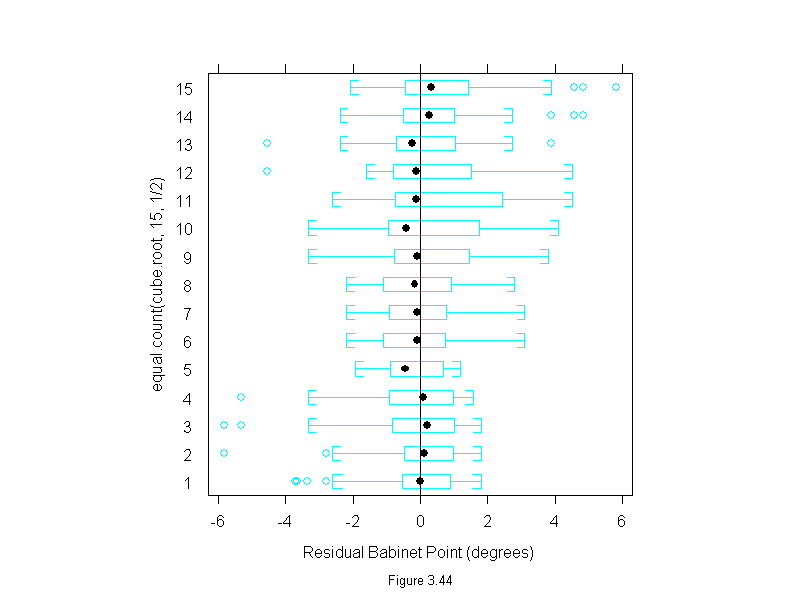
Figure 3.45
xyplot(facet~temperature,
  data = fly,
  aspect=1,
  sub = list("Figure 3.45",cex=.8),
  xlab="Temperature (Degrees Celsius)",
  ylab="Facet Number")
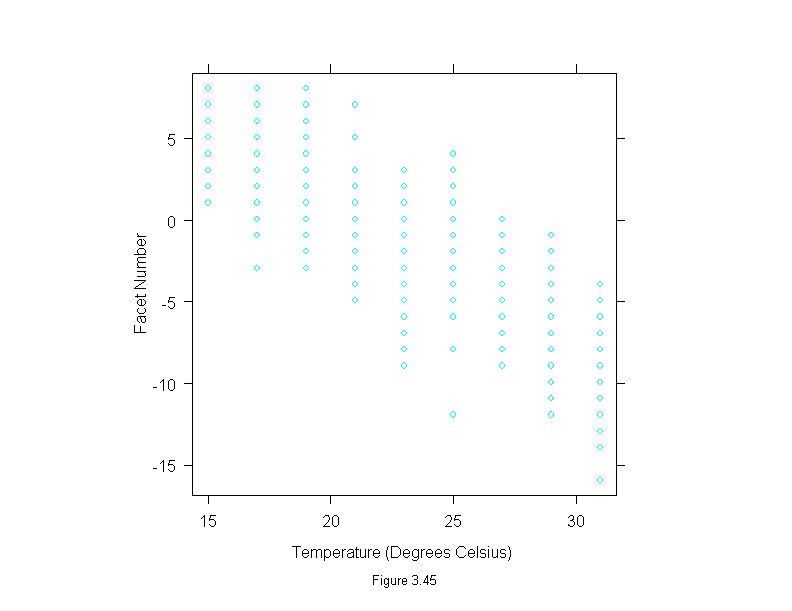
Figure 3.46
set.seed(19)
xyplot(jitter(facet,1)~jitter(temperature,2),
  data = fly,
  aspect=1.2,
  sub = list("Figure 3.46",cex=.8),
  xlab="Jittered Temperature (Degrees Celsius)",
  ylab="Jittered Facet Number")
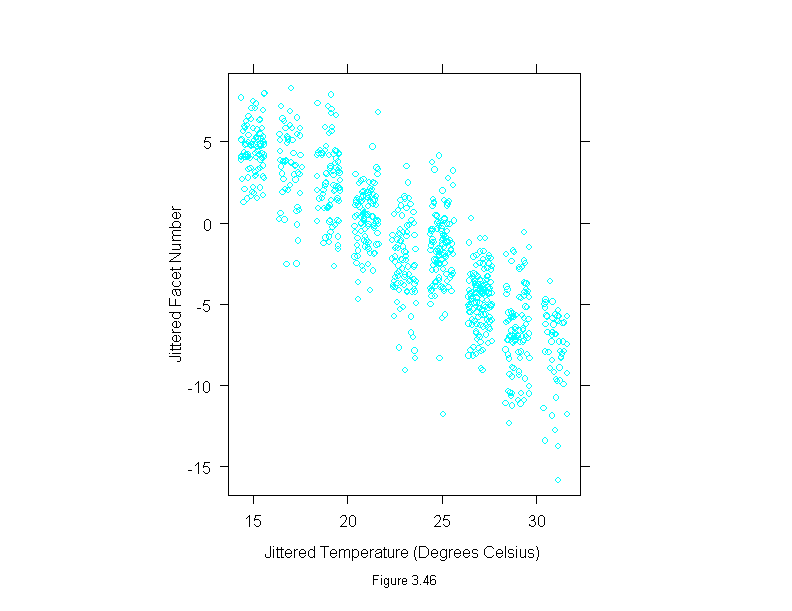
Figure 3.47
bwplot(factor(temperature) ~ facet,
  data=fly,
  aspect=1.2,
  sub = list("Figure 3.47",cex=.8),
  xlab = "Facet Number",
  ylab = "Temperature (Degrees Celsius)")
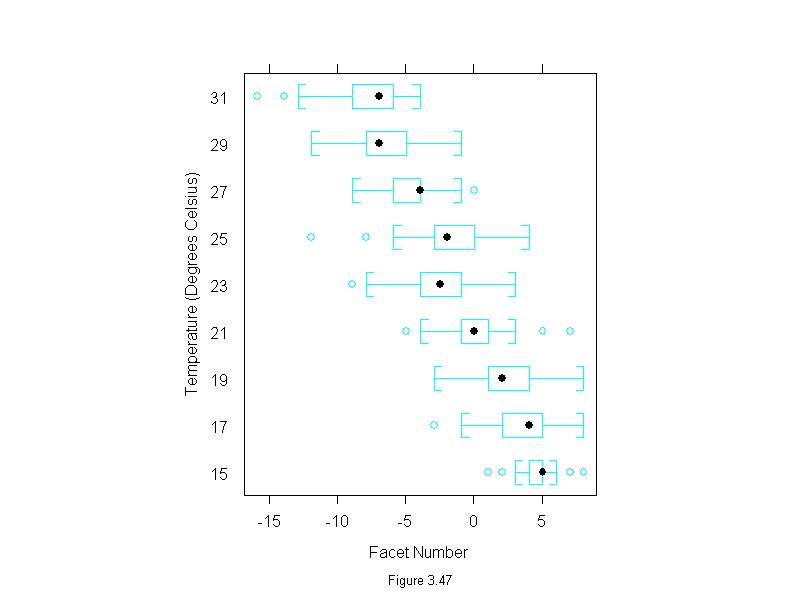
Figure 3.48
fly.m <- oneway(facet~temperature,data=fly,spread=1)
Temperature <- factor(fly$temperature)
qqmath(~residuals(fly.m)|Temperature,
  prepanel = prepanel.qqmathline,
  panel = function(x, y) {
    panel.grid()
    panel.qqmathline(y, distribution = qnorm)
    panel.qqmath(x, y)
  },
  aspect = 1,
  sub = list("Figure 3.48",cex=.8),
  xlab="Unit Normal Quantile",
  ylab="Residual Facet Number")
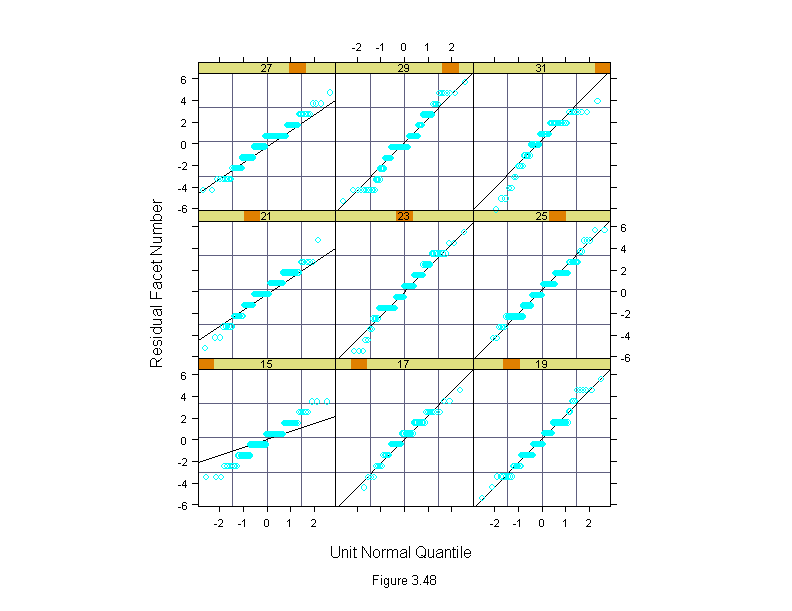
Figure 3.49
attach(fly)
fly.lm <- lm(facet~temperature)
ylim <- range(fitted.values(fly.lm))
fly.means <- tapply(facet,temperature,mean)
fly.temps <- unique(temperature)
ans <- xyplot(fly.means~fly.temps,
  ylim = ylim,
  panel = substitute(function(x, y) {
    panel.xyplot(x, y)
    panel.abline(fly.lm)
  }),
  aspect=1,
  sub = list("Figure 3.49",cex=.8),
  xlab="Temperature (Degrees Celsius)",
  ylab="Facet Number")
detach()
ans
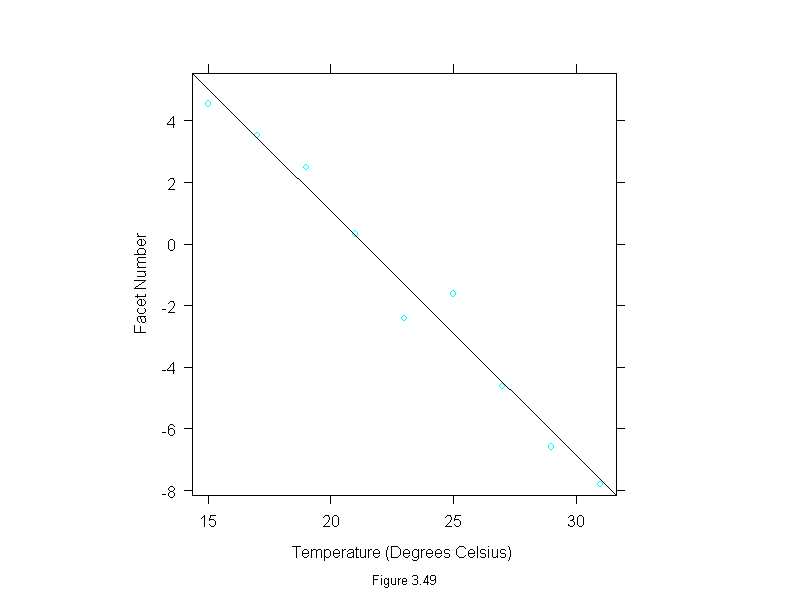
Figure 3.50
attach(fly)
fly.lm <- lm(facet~temperature)
fly.means <- tapply(facet,temperature,mean)
fly.temps <- unique(temperature)
fly.res <- fly.means-predict(fly.lm,data.frame(temperature=fly.temps))
ans <- xyplot(fly.res~fly.temps,
  panel = function(x, y) {
    panel.xyplot(x, y)
    panel.abline(h=0)
  },
  aspect=1,
  sub = list("Figure 3.50",cex=.8),
  xlab="Temperature",
  ylab="Residual Facet Number")
detach()
ans
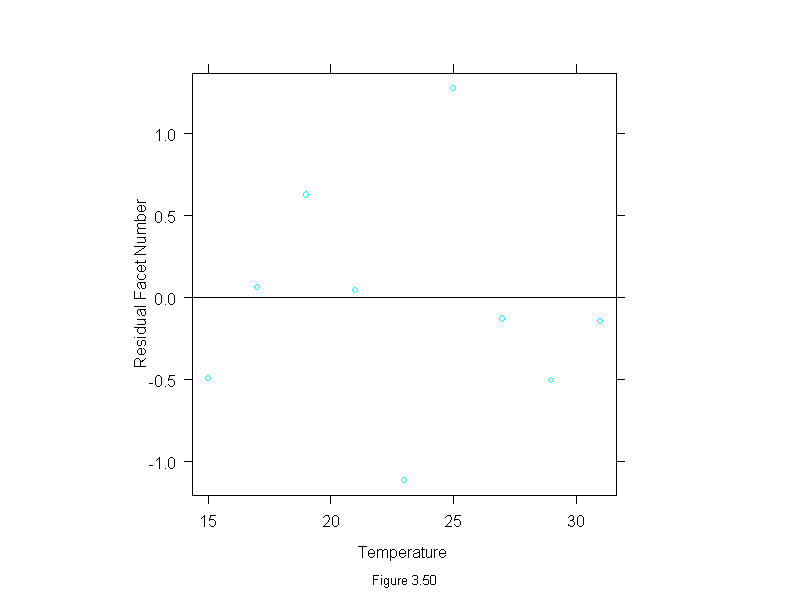
Figure 3.51
on.exit(par(oldpar))
oldpar <- par("pty", "xaxt", "yaxt")
par(pty = "s", xaxt = "n", yaxt = "n")
attach(Playfair)
x <- c(seq(22, 1, length = 11), seq(22, 1, length = 11))
y <- c(rep(1, 11), rep(2, 11))
symbols(x, y, circles = diameter, inches = 1/6, ylim = c(0.5, 2.2))
y <- c(rep(0.9, 11), rep(1.8, 11))
mtext("Figure 3.5",1,1,cex=.8)
# text(x, y, dimnames(Playfair)[1], srt = 45, adj = 1)
text(x, y, id, srt = 45, adj = 1)
detach()
invisible()
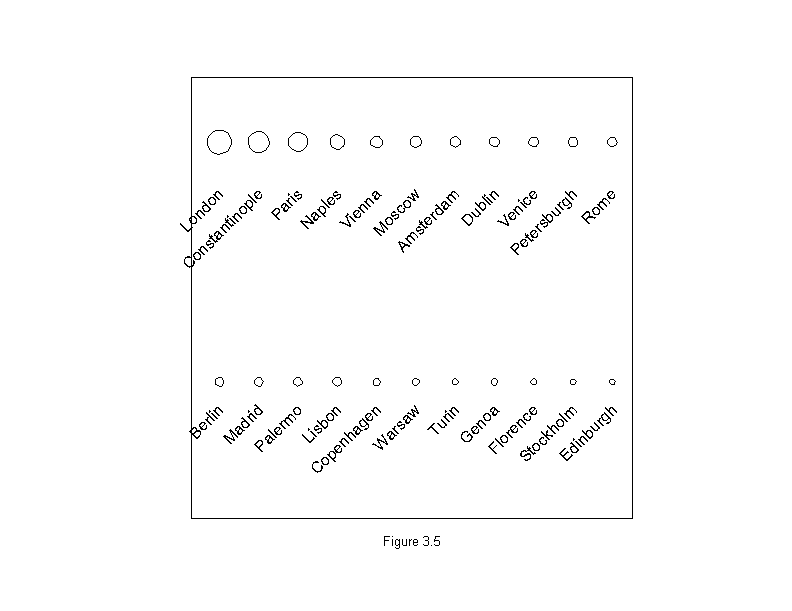
Figure 3.52
# The first two lines is not necessary if Playfair is a matrix;
# in which case dotplot(Playfair[,"population"], ...) will work.
population <- Playfair$population
names(population) <- row.names(Playfair)
dotplot(population,
  aspect = 2/3,
  xlim = range(0, population),
  sub = list("Figure 3.52",cex=.8),
  xlab = "Population (Thousands)")
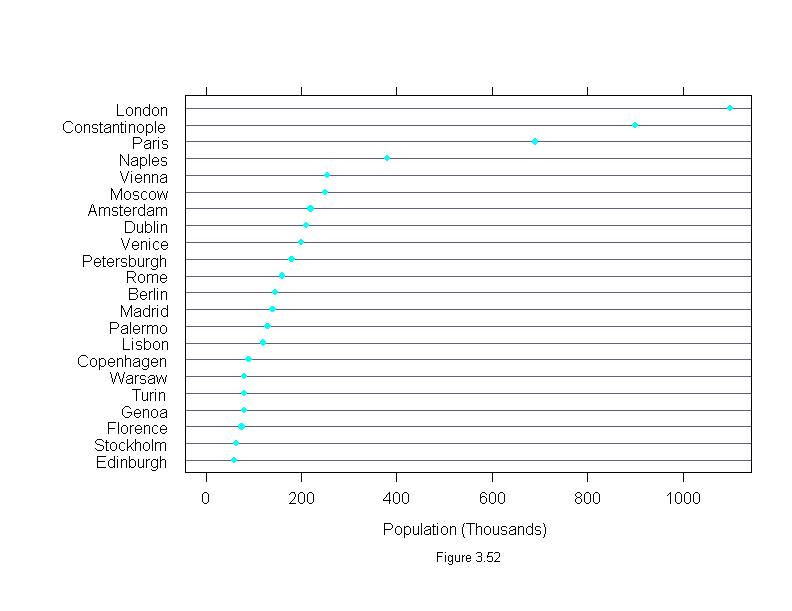
Figure 3.53
xyplot(diameter ~ sqrt(population),
  data = Playfair,
  aspect=1,
  ylab = "Diameter (mm)",
  sub = list("Figure 3.53",cex=.8),
  xlab = "Square Root Population (square root thousands)")
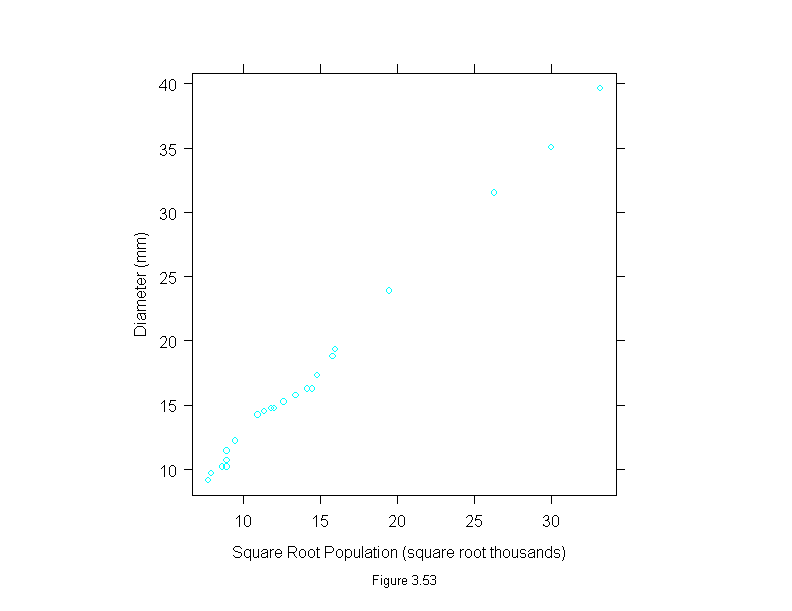
Figure 3.54
pla.lm <- lm(diameter ~ sqrt(population) - 1, data = Playfair)
xyplot(diameter ~ sqrt(population),
  data = Playfair,
  ylim = range(Playfair$diameter, fitted.values(pla.lm)),
  panel = substitute(function(x, y) {
    panel.xyplot(x, y)
    panel.abline(pla.lm)
  }),
  aspect=1,
  ylab = "Diameter (mm)",
  sub = list("Figure 3.54",cex=.8),
  xlab = "Square Root Population (square root thousands)")
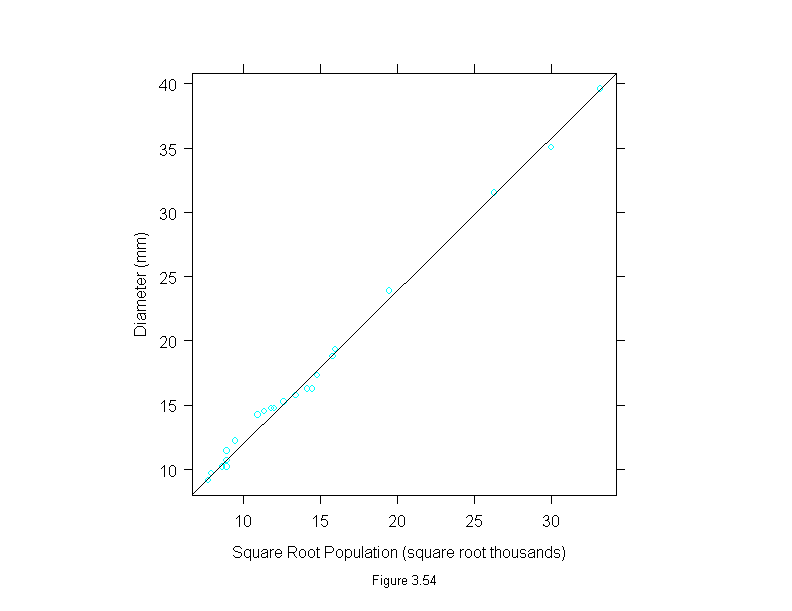
Figure 3.55
xyplot(residuals(lm(diameter ~ sqrt(population) - 1, data = Playfair)) ~ sqrt(Playfair$population),
  panel = function(x, y) {
    panel.xyplot(x, y)
    panel.abline(h=0)
  },
  aspect = "xy",
  sub = list("Figure 3.55",cex=.8),
  xlab = "Square Root Population (square root thousands)",
  ylab = "Residual Diameter (mm)")
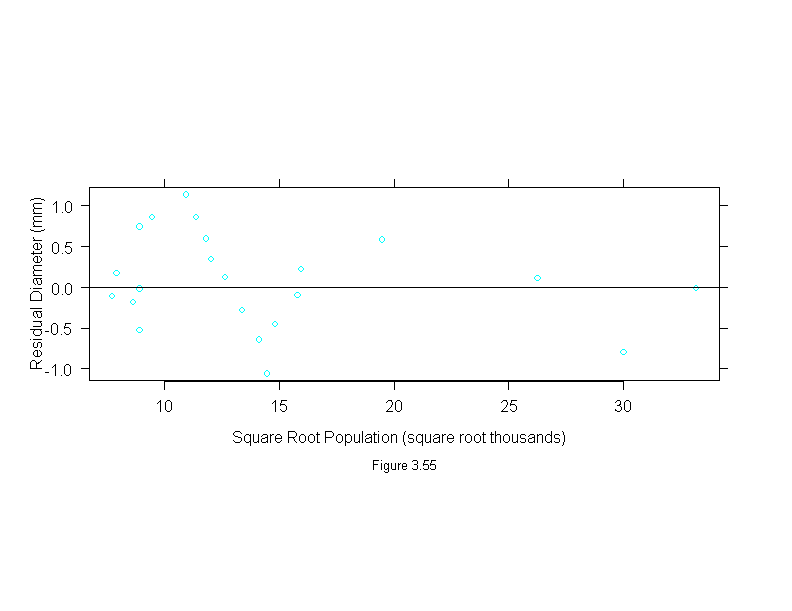
Figure 3.56
set.seed(19)
xyplot(jitter(wind)~jitter(temperature),
  data = environmental,
  aspect=1,
  sub = list("Figure 3.56",cex=.8),
  xlab="Jittered Temperature (Degrees Fahrenheit)",
  ylab="Jittered Wind Speed (mph)")
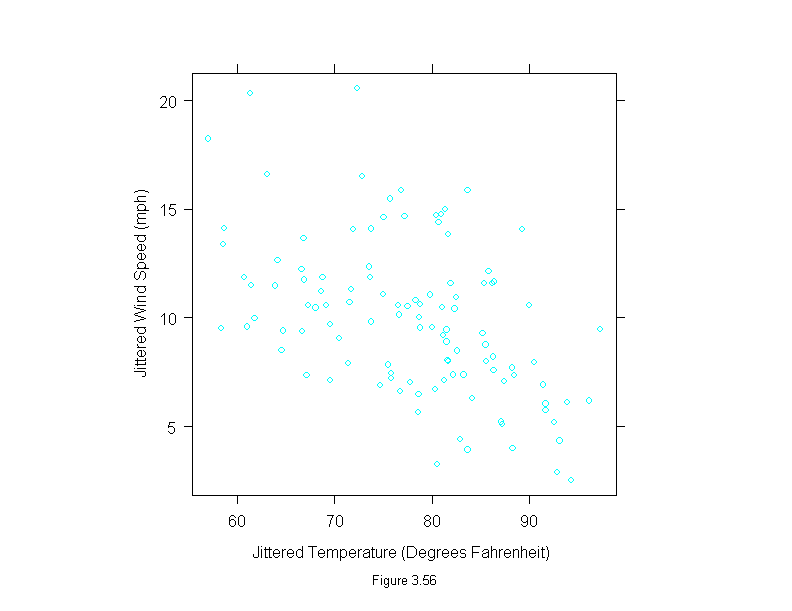
Figure 3.57
qqmath(~environmental$temperature,
  prepanel = prepanel.qqmathline,
  panel = function(x, y) {
    panel.qqmathline(y, distribution = qnorm)
    panel.qqmath(x, y)
  },
  aspect = 1,
  sub = list("Figure 3.57",cex=.8),
  xlab = "Unit Normal Quantile",
  ylab = "Temperature (Degrees Fahrenheit)")
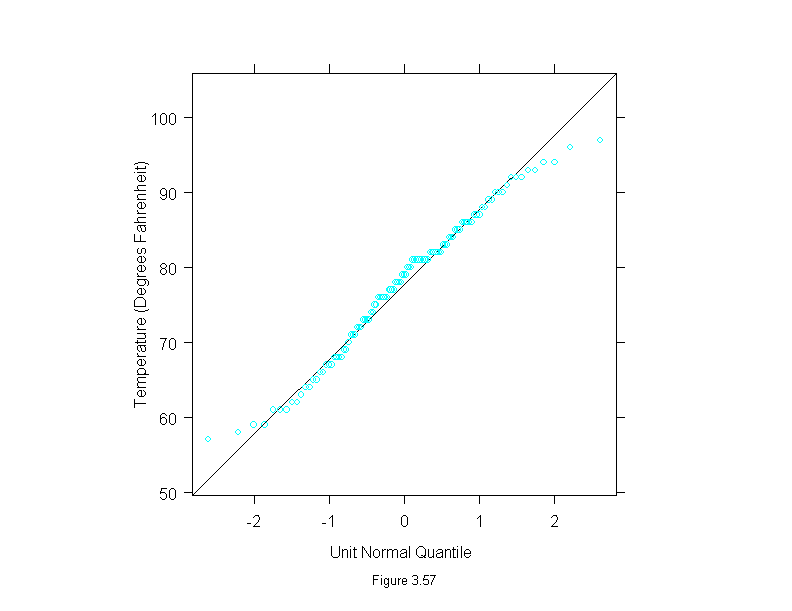
Figure 3.58
qqmath(~environmental$wind,
  prepanel = prepanel.qqmathline,
  panel = function(x, y) {
    panel.qqmathline(y, distribution = qnorm)
    panel.qqmath(x, y)
  },
  aspect = 1,
  sub = list("Figure 3.58",cex=.8),
  xlab = "Unit Normal Quantile",
  ylab = "Wind Speed (mph)")
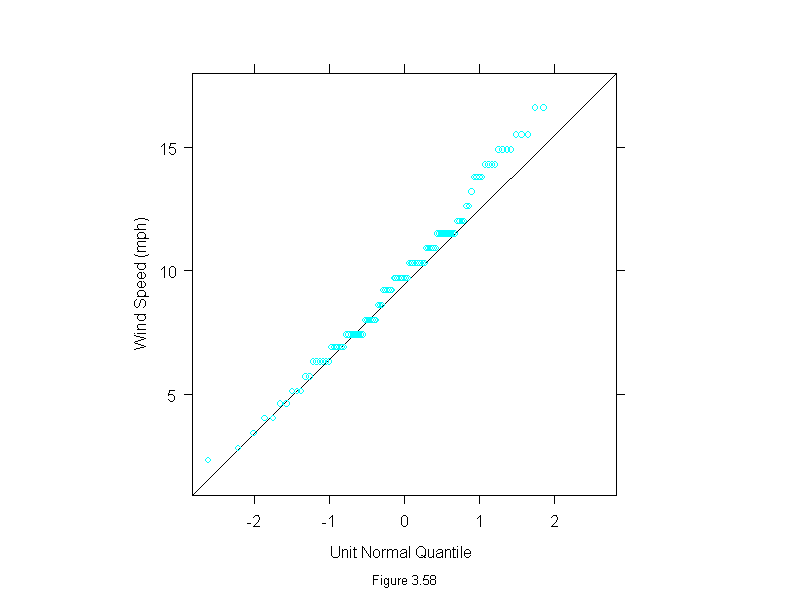
Figure 3.59
xyplot(wind~temperature,
  data = environmental,
  panel=function(x,y){
    add.line <- trellis.par.get("add.line")
    panel.xyplot(x,y)
    lines(loess.smooth(x, y, span=3/4, family="g"),
      lwd = add.line$lwd, lty = add.line$lty,
      col = add.line$col)
    other.fit <- loess.smooth(y, x, span=3/4, family="g")
    lines(other.fit$y,other.fit$x,
      lwd = add.line$lwd, lty = add.line$lty,
      col = add.line$col)
  },
  aspect = 1,
  sub = list("Figure 3.59",cex=.8),
  xlab = "Temperature (Degrees Fahrenheit)",
  ylab = "Wind Speed (mph)")
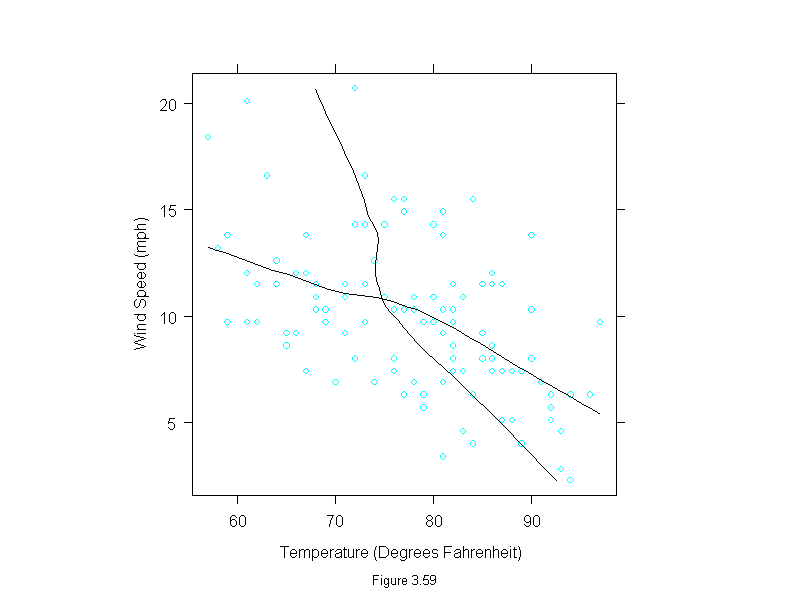
Figure 3.60
xyplot(stamford~yonkers,
  data = ozone,
  panel = function(x, y) {
    panel.xyplot(x, y)
    panel.abline(0, 1)
  },
  aspect=1,
  scale = list(limits = range(ozone)),
  sub = list("Figure 3.60",cex=.8),
  xlab="Yonkers Concentration (ppb)",
  ylab="Stamford Concentration (ppb)")
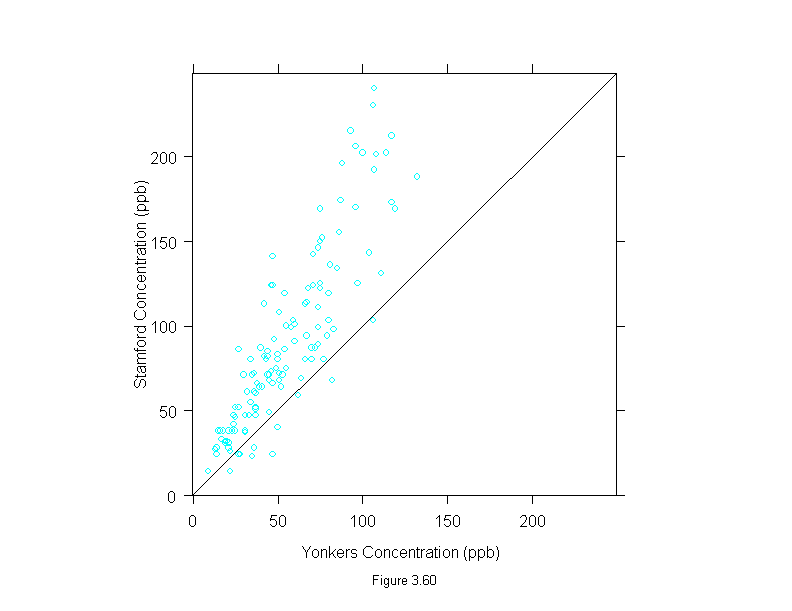
Figure 3.61
tmd(xyplot(stamford~yonkers,
  data = ozone),
  prepanel = function(x, y)
    prepanel.loess(x, y,span=1,degree=1,family="g"),
  panel = function(x, y) {
    panel.xyplot(x, y)
    panel.loess(x, y, span=1,degree=1,family="g")
    panel.abline(h = 0)
  },
  aspect = "xy",
  ylab="Difference (ppb)",
  sub = list("Figure 3.61",cex=.8),
  xlab="Mean (ppb)")
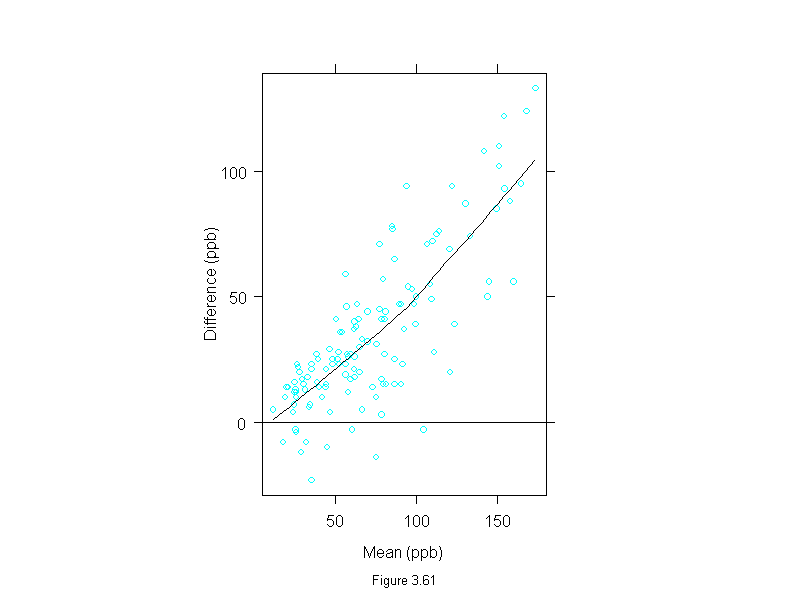
Figure 3.62
xyplot(logb(stamford, 2) ~ logb(yonkers, 2),
  data = ozone,
  panel = function(x, y) {
    panel.xyplot(x, y)
    panel.abline(0, 1)
  },
  scale = list(limits = range(logb(ozone, 2))),
  aspect = 1,
  sub = list("Figure 3.62",cex=.8),
  xlab="Log Yonkers Concentration (log base 2 ppb)",
  ylab="Log Stamford Concentration (log base 2 ppb)")
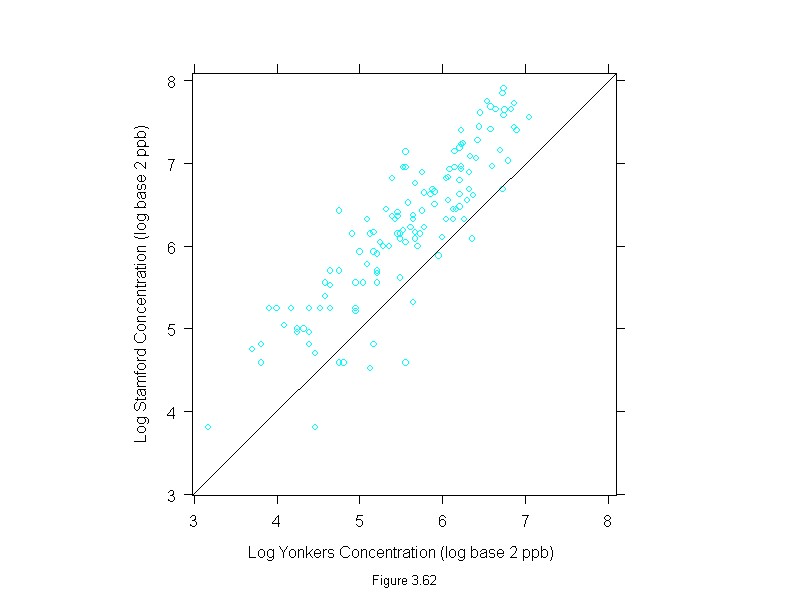
Figure 3.63
tmd(xyplot(logb(stamford,2)~logb(yonkers,2), data = ozone),
  prepanel = function(x, y)
    prepanel.loess(x, y,span=1,degree=1,family="g"),
  panel = function(x, y) {
    panel.xyplot(x, y)
    panel.loess(x, y, span=1,degree=1,family="g")
    panel.abline(h = 0)
  },
  aspect=1.5,
  scale = list(y = list(labels = c("-1", "0", "1"),
    at = c(-1, 0, 1))),
  ylab="Log Difference (log base 2 ppb)",
  sub = list("Figure 3.63",cex=.8),
  xlab="Log Mean (log base 2 ppb)")
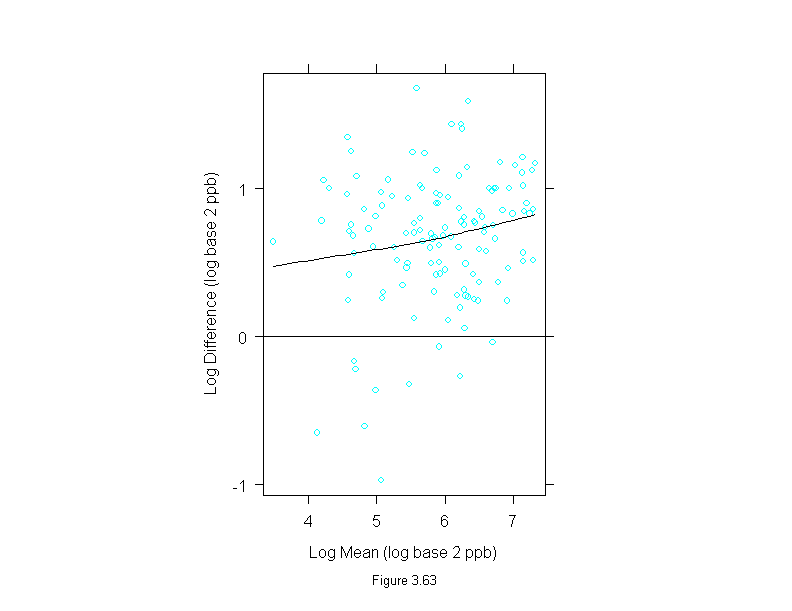
Figure 3.64
xyplot(incidence ~ year,
  data = melanoma,
  panel = function(x, y)
    panel.xyplot(x, y, type="o", pch = 16, cex = .75),
  aspect = "xy",
  ylim = c(0, 5),
  sub = list("Figure 3.64",cex=.8),
  xlab = "Year",
  ylab = "Incidence")
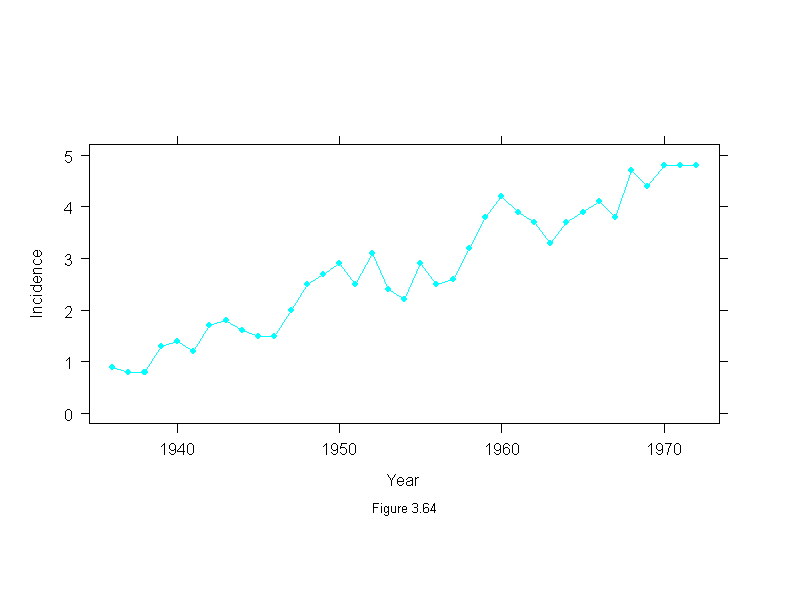
Figure 3.65
attach(melanoma)
mel.low <- stl(ts(incidence, start = 1936, frequency=1, end = 1972),
  fc.window = 30,
  fc.degree = 1)
ans <- xyplot(mel.low$fc.30~year,
  aspect="xy",
  type="l",
  ylab = "Incidence",
  sub = list("Figure 3.65",cex=.8),
  xlab = "Year")
detach()
ans
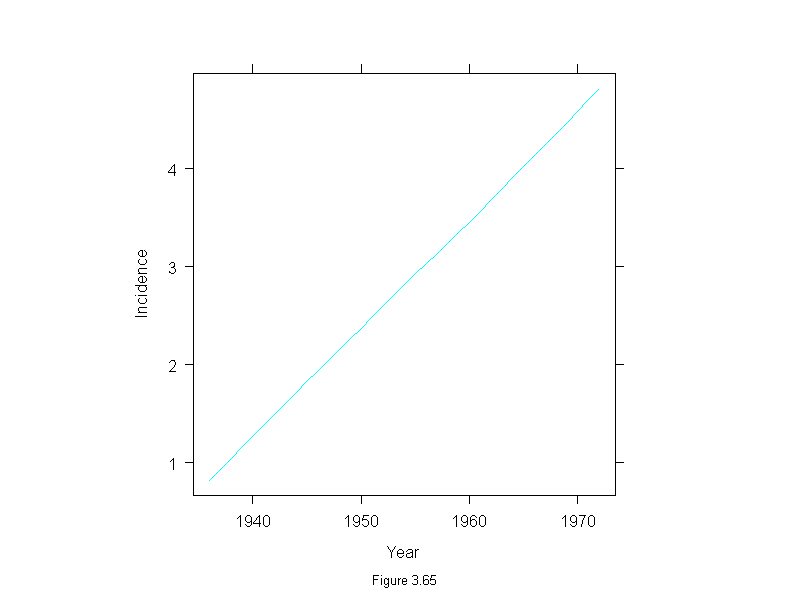
Figure 3.66
attach(melanoma)
mel.m <- stl(ts(incidence, start = 1936, frequency=1, end = 1972),
  fc.window = 30,
  fc.degree = 1)
ans <- xyplot(mel.m$remainder~year,
  panel = function(x, y) {
    panel.xyplot(x, y, type = "o", pch = 16, cex=.6)
    panel.abline(h = 0)
  },
  aspect = "xy",
  ylab = "Incidence",
  sub = list("Figure 3.66",cex=.8),
  xlab = "Year")
detach()
ans
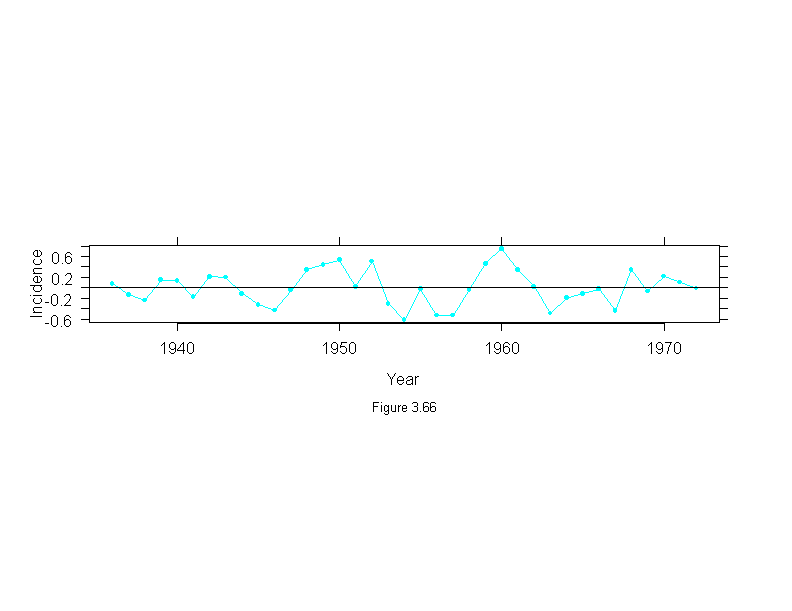
Figure 3.67
attach(melanoma)
mel.mlow <- stl(ts(incidence, start = 1936, frequency=1, end = 1972),
  fc.window = 30,
  fc.degree = 1)
mel.mo <- stl(mel.mlow$remainder,
  fc.window = 9,
  fc.degree = 2)
ans <- xyplot(mel.mo$fc.9~year,
  panel = function(x, y) {
    panel.xyplot(x, y, type = "o", pch = 16, cex = .6)
    panel.abline(h = 0)
  },
  aspect = "xy",
  ylab = "Incidence",
  sub = list("Figure 3.67",cex=.8),
  xlab = "Year")
detach()
ans
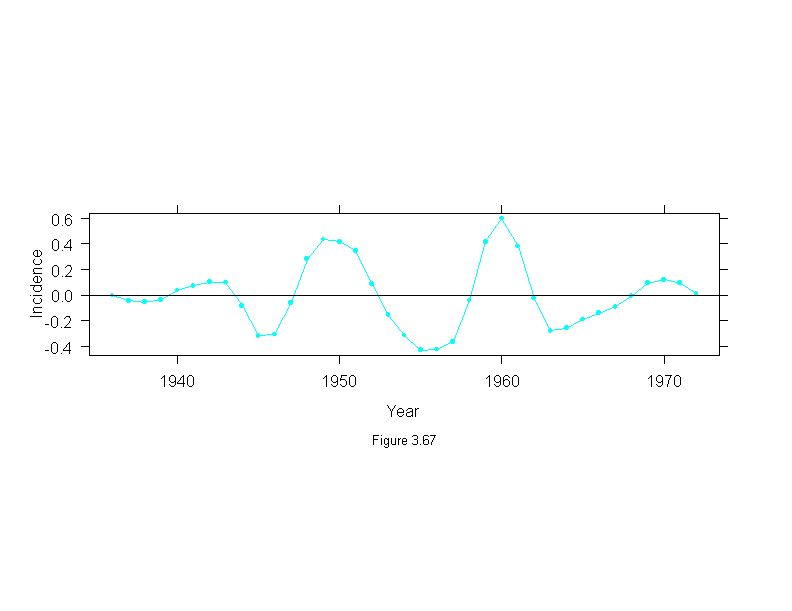
Figure 3.68
attach(melanoma)
mel.mboth <- stl(ts(incidence, start = 1936, frequency=1, end = 1972),
  fc.window = c(30,9),
  fc.degree = c(1,2))
ylim <- c(-1,1)*2*max(abs(mel.mboth$remainder))
ans <- xyplot(mel.mboth$remainder~year,
  panel = function(x, y) {
    panel.xyplot(x, y, type="o", pch = 16, cex=.75)
    panel.abline(h=0)
  },
  aspect="xy",
  las = 0, # vertical y-axis labels
  ylim=ylim,
  ylab = "ResidualnIncidence",
  sub = list("Figure 3.68",cex=.8),
  xlab = "Year")
detach()
ans
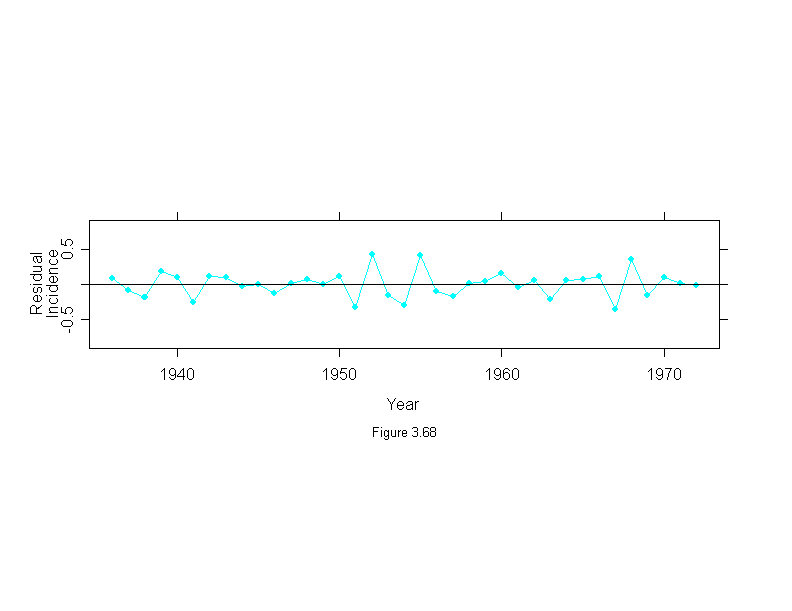
Figure 3.69
attach(melanoma)
mel.mboth <- stl(ts(incidence, start = 1936, frequency=1, end = 1972),
  fc.window = c(30,9),
  fc.degree = c(1,2))
ans <- qqmath(~mel.mboth$remainder,
  prepanel = prepanel.qqmathline,
  panel = function(x, y) {
    panel.qqmathline(y, distribution = qnorm)
    panel.qqmath(x, y)
  },
  aspect=1,
  sub = list("Figure 3.69",cex=.8),
  xlab = "Unit Normal Quantile",
  ylab = "Residual Incidence")
detach()
ans
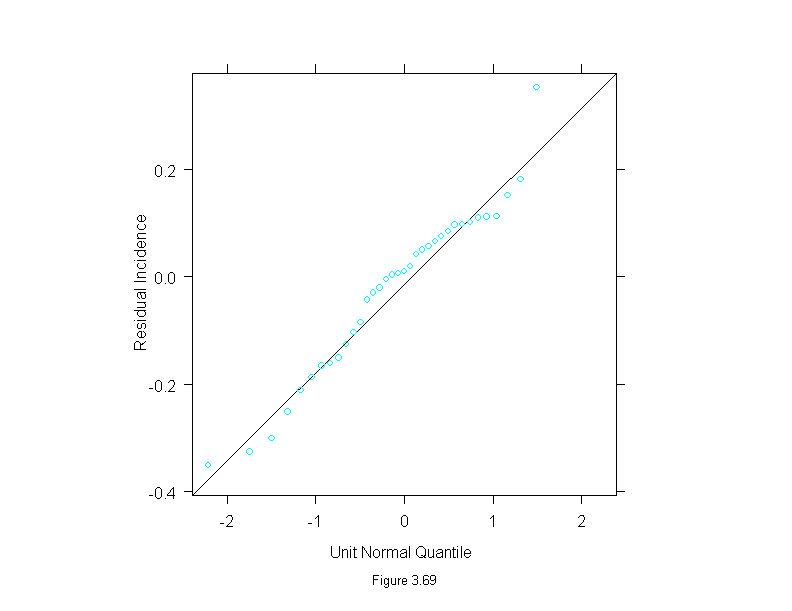
Figure 3.70
attach(melanoma)
mel.mboth <- stl(ts(incidence, start = 1936, frequency=1, end = 1972),
  fc.window = c(30,9),
  fc.degree = c(1,2))
n <- length(incidence)
mel.mboth$fc.30 <- mel.mboth$fc.30 - mean(mel.mboth$fc.30)
mel.components <- c(mel.mboth$fc.30,mel.mboth$fc.9, mel.mboth$remainder)
mel.year <-  rep(1936:1972,3)
mel.names <- ordered(rep(c("Trend","Oscillatory","Residuals"),c(n,n,n)),
 c("Trend","Oscillatory","Residuals"))
ans <- xyplot(mel.components~mel.year|mel.names,
  panel = function(x, y) {
    panel.grid(h = 7)
    panel.xyplot(x, y, type = "o", pch = 16, cex = .7)
  },
  layout=c(3,1),
  ylim = c(-1,1)*max(abs(mel.components)),
  sub = list("Figure 3.70",cex=.8),
  xlab="Year",
  ylab="Incidence")
detach()
ans
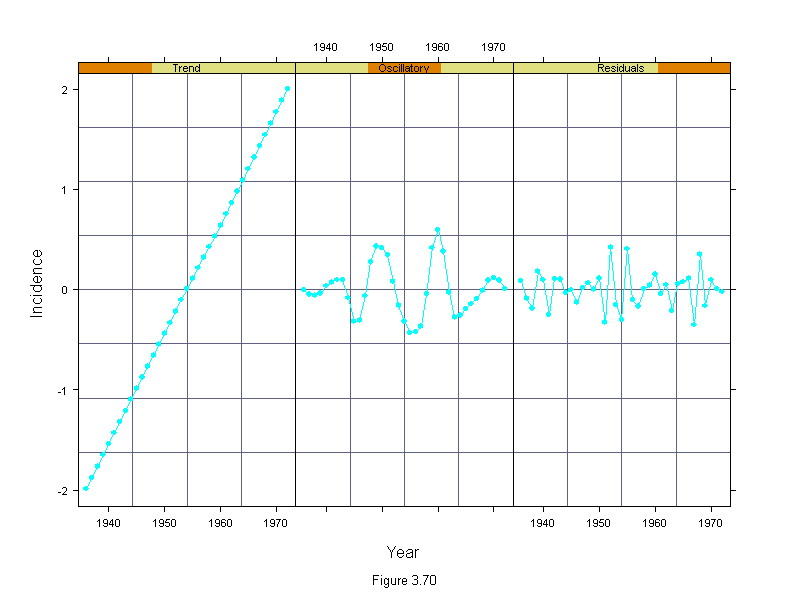
Figure 3.71
print(xyplot(stl(ts(incidence, start = 1936, frequency=1, end = 1972),
    fc.window = c(30,9), fc.degree = c(1,2))$fc.9 ~ year,
    data = melanoma,
    panel=function(x, y) {
      panel.grid(v = 5,h = 0)
      panel.xyplot(x, y, type = "l")
    },
    aspect = "xy",
    ylab = "Incidence",
    xlab = "Year"),
    position = c(0, .4, 1, 1), more = T)
print(xyplot(sunspot ~ year,
    data = melanoma,
    panel=function(x, y) {
      panel.grid(v = 5, h = 0)
      panel.xyplot(x, y, type = "l")
    },
    aspect = "xy",
    ylab = "Sunspot Number",
    sub = list("Figure 3.71",cex=.8),
    xlab = "Year"),
    position = c(0, .2, 1, .6))
invisible()
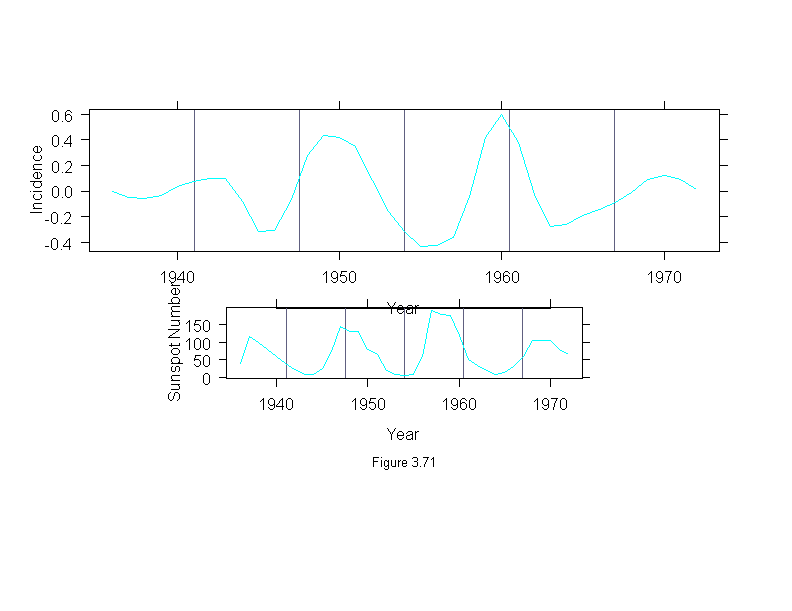
Figure 3.72
xyplot(carbon.dioxide~time(carbon.dioxide),
  aspect="xy",
  type="l",
  scales=list(x=list(cex=.7),y=list(cex=.7)),
  ylab = "CO2 (ppm)",
  sub = list("Figure 3.72",cex=.8),
  xlab = "Year")
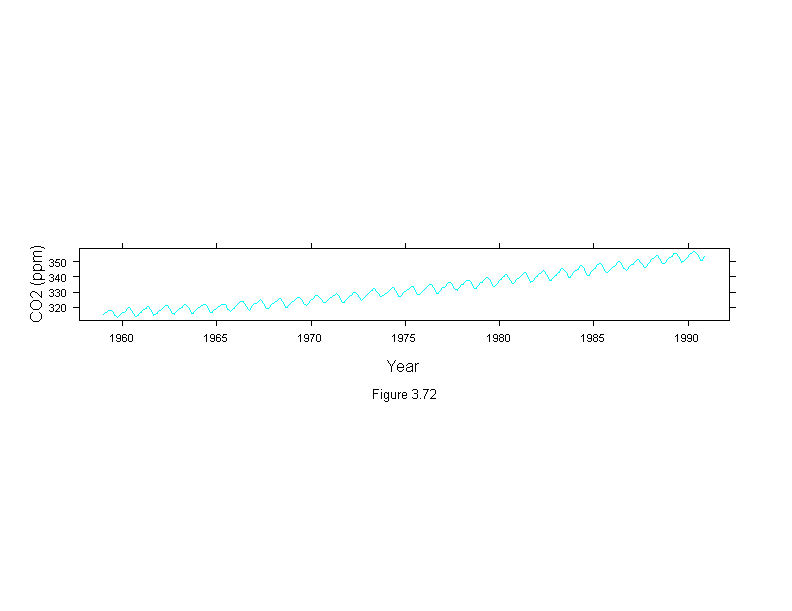
Figure 3.73
xyplot(carbon.dioxide ~ time(carbon.dioxide),
  aspect = 1,
  type = "l",
  ylab = "Carbon Dioxide (ppm)",
  sub = list("Figure 3.73",cex=.8),
  xlab = "Year")
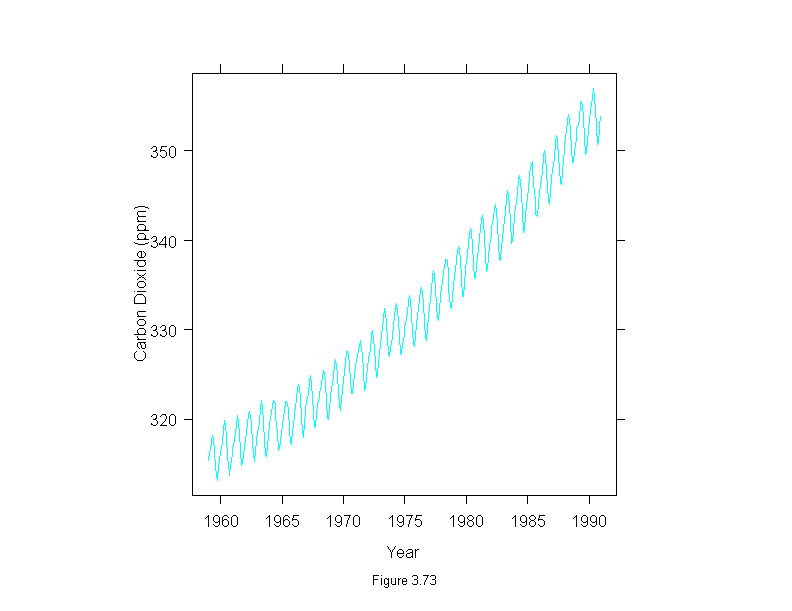
Figure 3.74
car.sfit <- stl(carbon.dioxide,ss.window = 25, ss.degree=1)$seasonal
ylim <- c(-1,1)*max(abs(car.sfit))
car.time <- time(carbon.dioxide)
xyplot(car.sfit ~ car.time | equal.count(car.time, 7, overlap=1),
  panel = function(x, y) {
    panel.grid(v = 0)
    panel.xyplot(x, y, type="l")
  },
  aspect = "xy",
  strip = F,
  ylim = ylim,
  scale = list(x = "free"),
  layout = c(1, 7),
  sub = list("Figure 3.74",cex=.8),
  xlab = "Year",
  ylab = "Carbon Dioxide (ppm)")
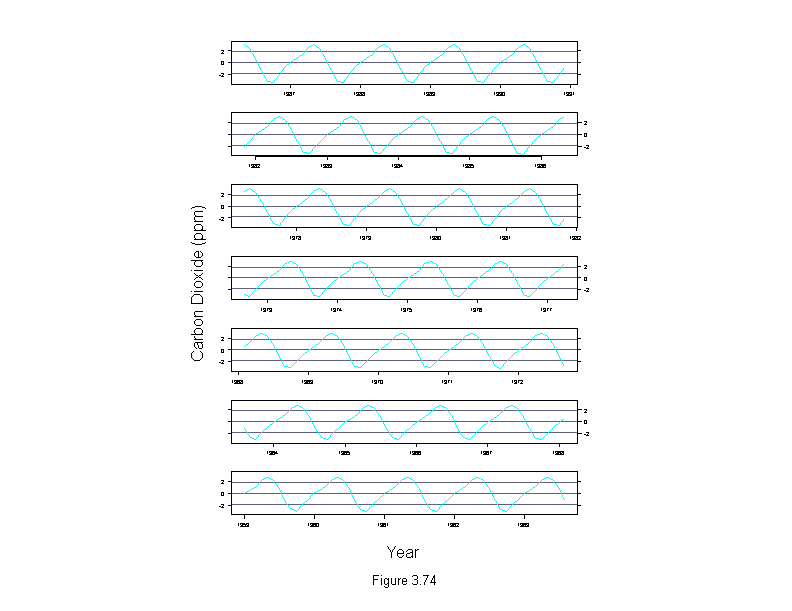
Figure 3.75
car.sfit <- stl(carbon.dioxide,ss.window = 25, ss.degree=1)$seasonal
car.time <- time(carbon.dioxide)-1959
car.subseries <- factor(cycle(carbon.dioxide),label=month.abb)
xyplot(car.sfit~car.time|car.subseries,
  layout=c(12,1),
  panel=function(x,y) {
    panel.xyplot(x,y,type="l")
    panel.abline(h=mean(y))
  },
  aspect="xy",
  scales=list(cex=.7, tick.number=3),
  sub = list("Figure 3.75",cex=.8),
  xlab="",
  ylab="Carbon Dioxide (ppm)")
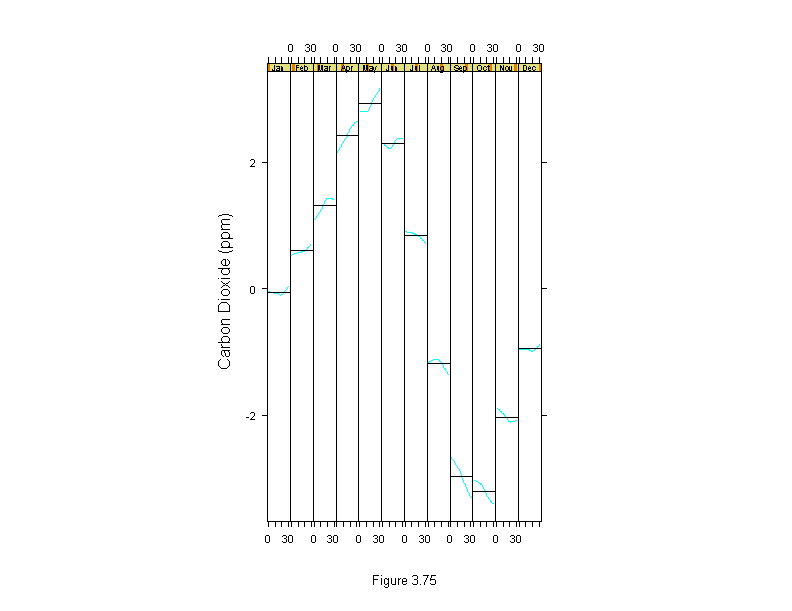
Figure 3.76
xyplot(stl(carbon.dioxide,ss.window = 25,
  ss.degree=1)$remainder ~ time(carbon.dioxide),
  aspect = 1,
  type = "l",
  ylab = "Carbon Dioxide (ppm)",
  sub = list("Figure 3.76",cex=.8),
  xlab = "Year")
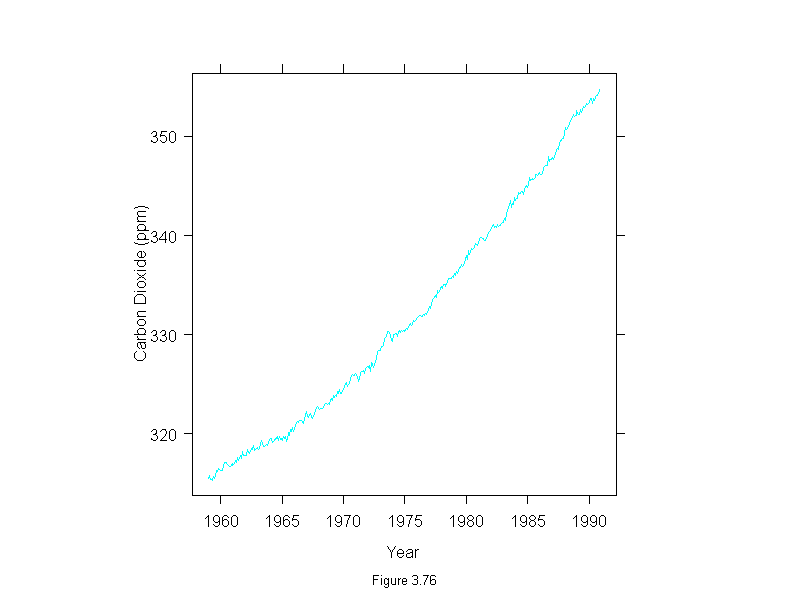
Figure 3.77
xyplot(stl(carbon.dioxide,ss.window = 25, ss.degree=1, fc.window=101,
    fc.degree=1)$fc.101 ~ time(carbon.dioxide),
  aspect="xy",
  type="l",
  ylab = "Carbon Dioxide (ppm)",
  sub = list("Figure 3.77",cex=.8),
  xlab = "Year")
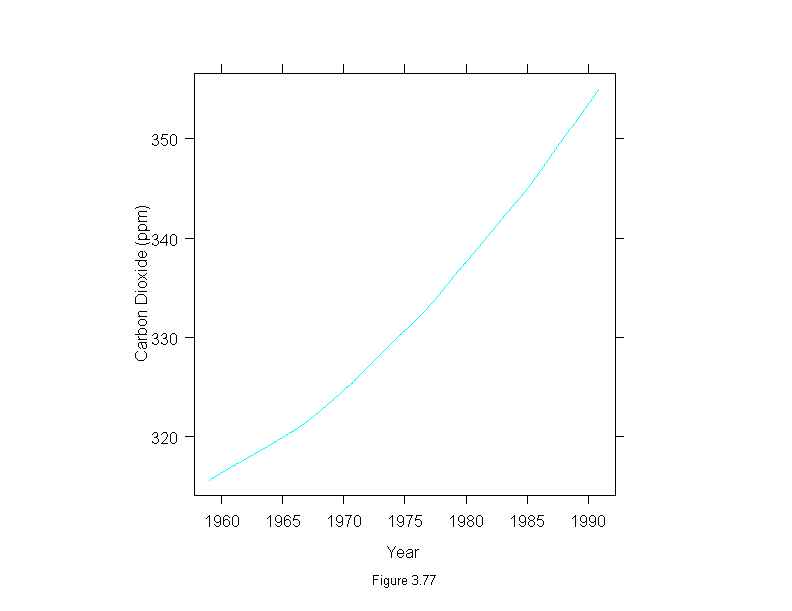
Figure 3.78
xyplot(stl(carbon.dioxide,ss.window = 25, ss.degree=1, fc.window=101,
    fc.degree=1)$remainder ~ time(carbon.dioxide),
  panel = function(x, y) {
    panel.xyplot(x, y, type = "l")
    panel.abline(h = 0)
  },
  aspect = 1/3,
  ylab = "Carbon Dioxide (ppm)",
  sub = list("Figure 3.78",cex=.8),
  xlab = "Year")
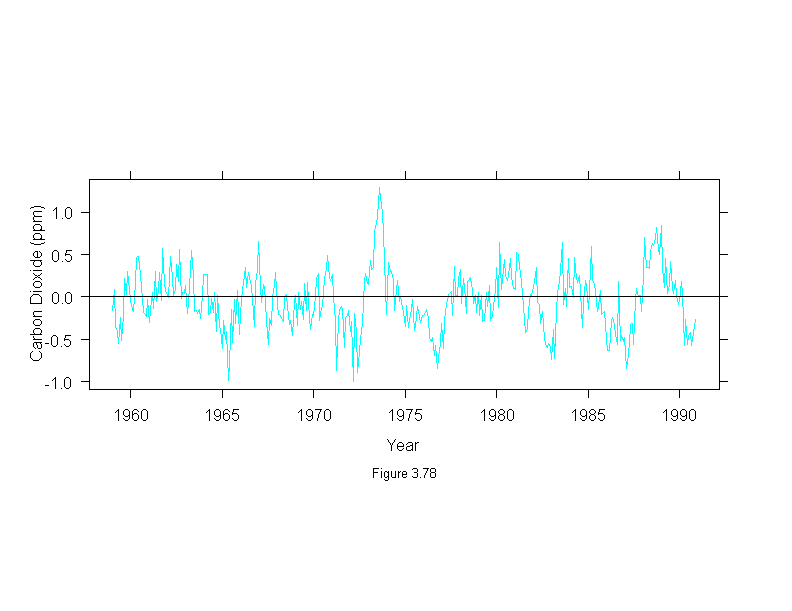
Figure 3.79
xyplot(stl(carbon.dioxide,ss.window = 25, ss.degree=1, fc.window=c(101,35),
    fc.degree=c(1,2))$fc.35 ~ time(carbon.dioxide),
  panel = function(x, y) {
    panel.xyplot(x, y, type="l")
    panel.abline(h = 0)
  },
  aspect = "xy",
  ylab = "CO2 (ppm)",
  sub = list("Figure 3.79",cex=.8),
  xlab = "Year")
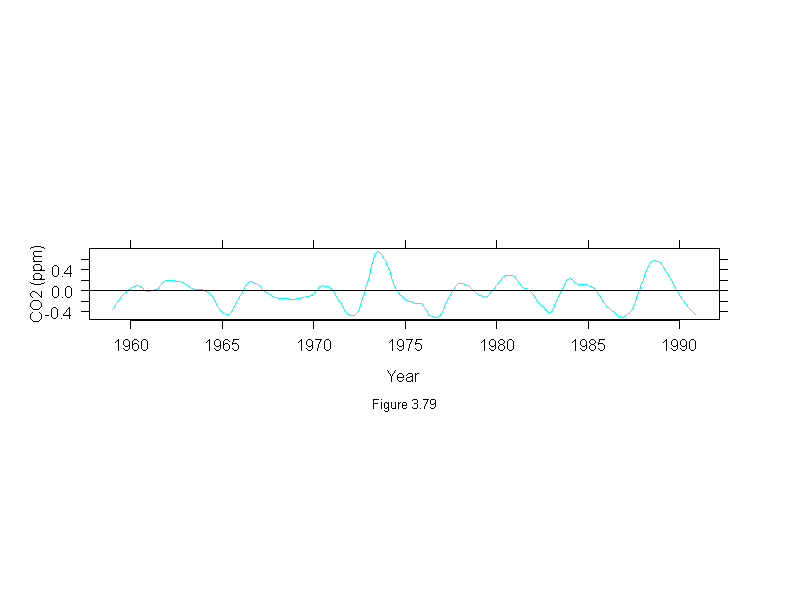
Figure 3.80
xyplot(stl(carbon.dioxide,ss.window = 25, ss.degree=1, fc.window=c(101,35),
    fc.degree=c(1,2))$remainder ~ time(carbon.dioxide),
  panel = function(x, y, ...) {
    panel.xyplot(x, y, type = "l")
    panel.abline(h = 0)
  },
  aspect = .1,
  ylab = "Residual CO2 (ppm)",
  sub = list("Figure 3.80",cex=.8),
  xlab = "Year")
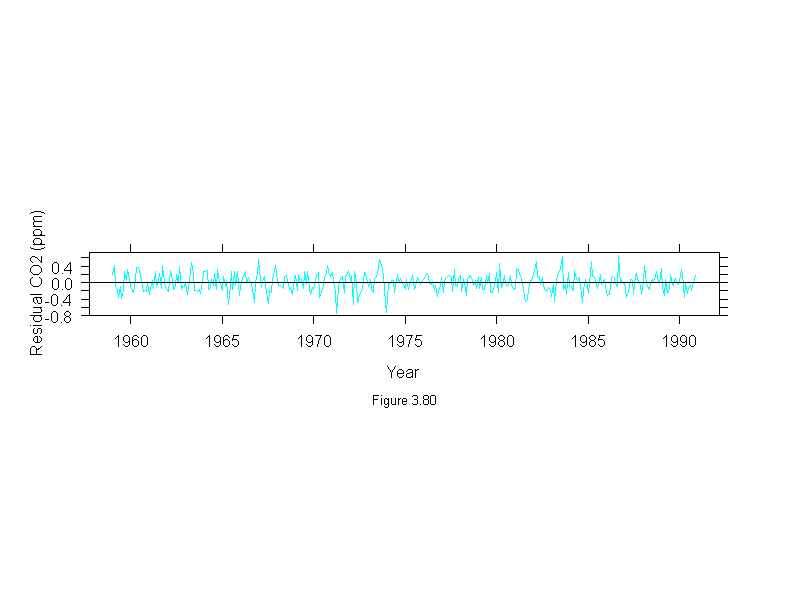
Figure 3.81
qqmath(~stl(carbon.dioxide,ss.window = 25, ss.degree=1,
    fc.window=c(101,35),fc.degree=c(1,2))$remainder,
  prepanel = prepanel.qqmathline,
  panel = function(x, y) {
    panel.qqmathline(y, distribution = qnorm)
    panel.qqmath(x, y)
  },
  aspect = 1,
  sub = list("Figure 3.81",cex=.8),
  xlab = "Unit Normal Quantile",
  ylab = "Residual Carbon Dioxide (ppm)")
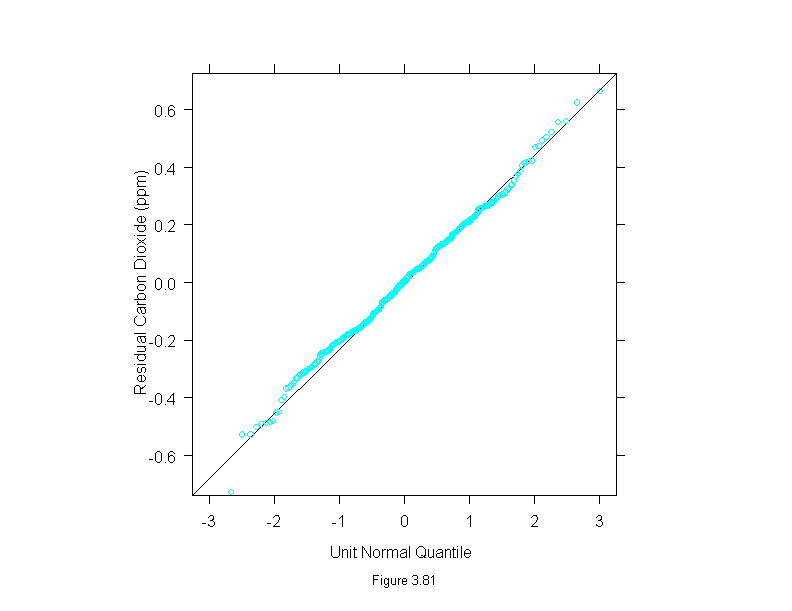
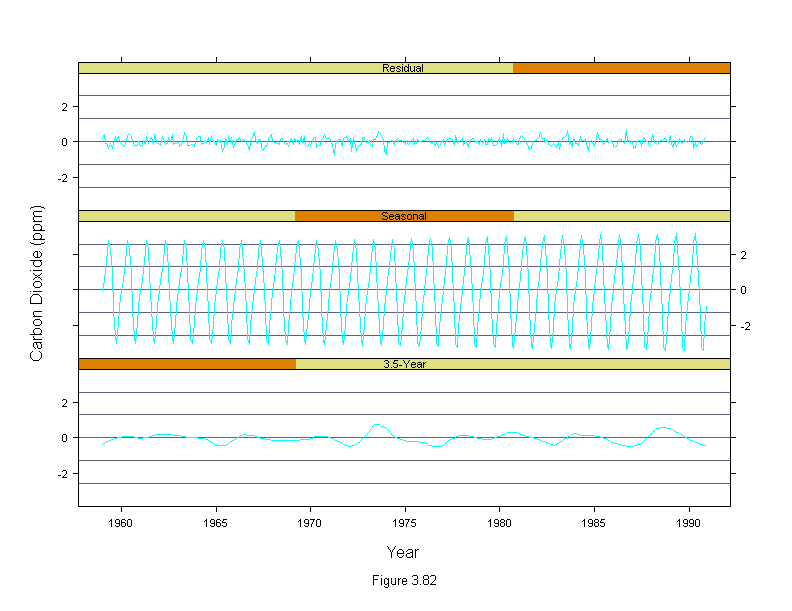
Figure 3,82
car.fit <- stl(carbon.dioxide,ss.window = 25, ss.degree=1,
  fc.window=c(101,35), fc.degree=c(1,2))
co2 <- unlist(car.fit[c("fc.35","seasonal","remainder")])
n <- length(carbon.dioxide)
co2.names <- factor(rep(c("3.5-Year","Seasonal","Residual"),rep(n,3)))
co2.names <- ordered(co2.names, c("3.5-Year","Seasonal","Residual"))
co2.year <- rep(time(carbon.dioxide),3)
xyplot(co2 ~ co2.year | co2.names,
  panel = function(x, y) {
    panel.grid(h = 5, v = 0)
    panel.xyplot(x, y, type = "l")},
  layout = c(1, 3),
  ylim = c(-1,1) *1.05 * max(abs(co2)),
  sub = list("Figure 3.82",cex=.8),
  xlab = "Year",
  ylab = "Carbon Dioxide (ppm)")
