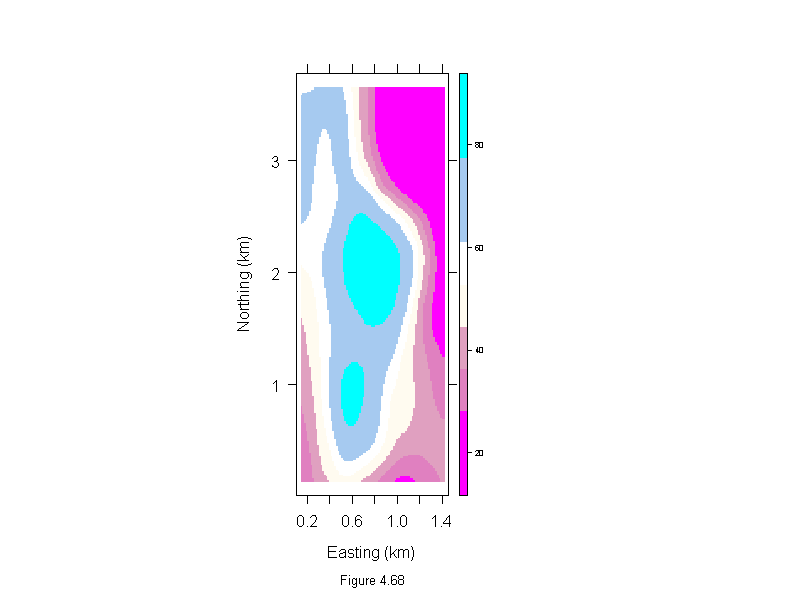
Figure 4.1
splom(~rubber[,1:3],
  varnames = c("Hardnessn(degrees Shore)",
    "Tensile Strengthn(kg/square cm)",
    "Abrasion Lossn(g/hp-hour)"),
  sub = list("Figure 4.1",cex=.8))
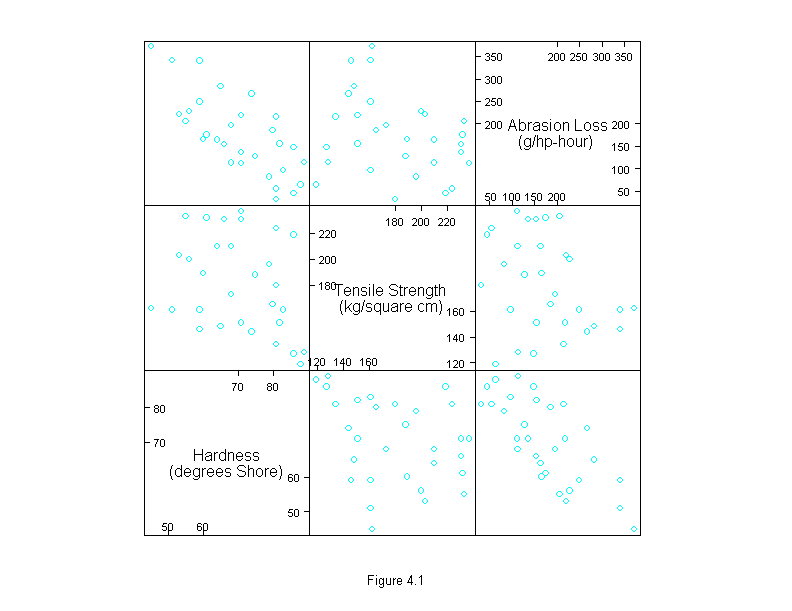
Figure 4.2
splom(~rubber[, 1:3],
  panel = function(x, y) {
       i <- rubber[,1] < 62
       panel.splom(x[!i], y[!i])
       panel.splom(x[i], y[i], pch = "+")
  },
  sub = list("Figure 4.2",cex=.8),
  varnames = c("Hardnessn(degrees Shore)",
    "Tensile Strengthn(kg/square cm)",
    "Abrasion Lossn(g/hp-hour)"))
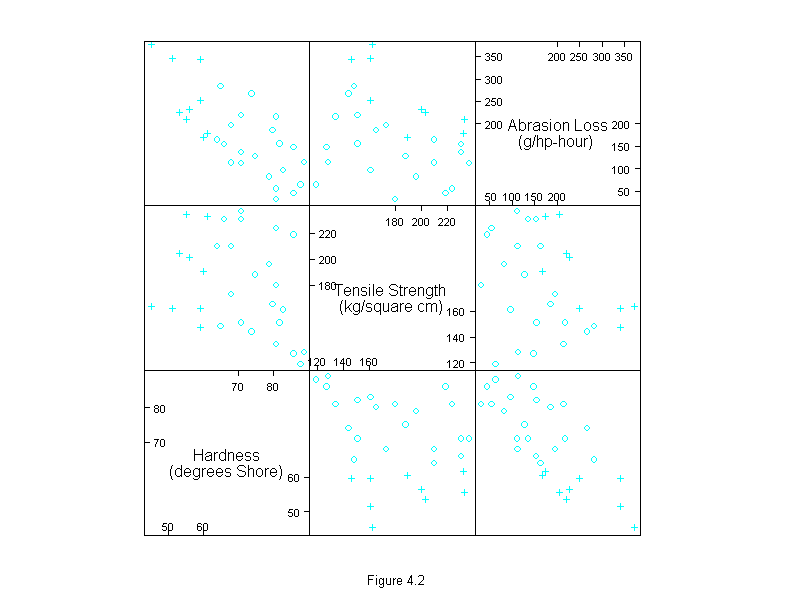
Figure 4.3
attach(rubber)
Hardness <- equal.count(hardness,6,3/4)
ans <- xyplot(abrasion.loss ~ tensile.strength | Hardness,
  prepanel=function(x,y) prepanel.loess(x, y, span = 3/4, degree = 1),
  panel = function(x, y) {
    panel.grid(h=2)
    panel.xyplot(x, y)
    panel.loess(x, y, span = 3/4, degree = 1)
  },
  layout = c(3,2),
  xlab = "Tensile Strength (kg/square cm)",
  ylab = "Abrasion Loss (g/hp-hour)")
detach()
print(ans, position=c(0,.375,1,1), more=T)

print(plot(equal.count(rubber$hardness,6,3/4),
  aspect=.2,
  scales=list(x=list(cex=.7),y=list(cex=.7)),
  sub = list("Figure 4.3",cex=.8),
  xlab = "Hardness (degrees Shore)"),
  position=c(0,.1,1,.425))
invisible()
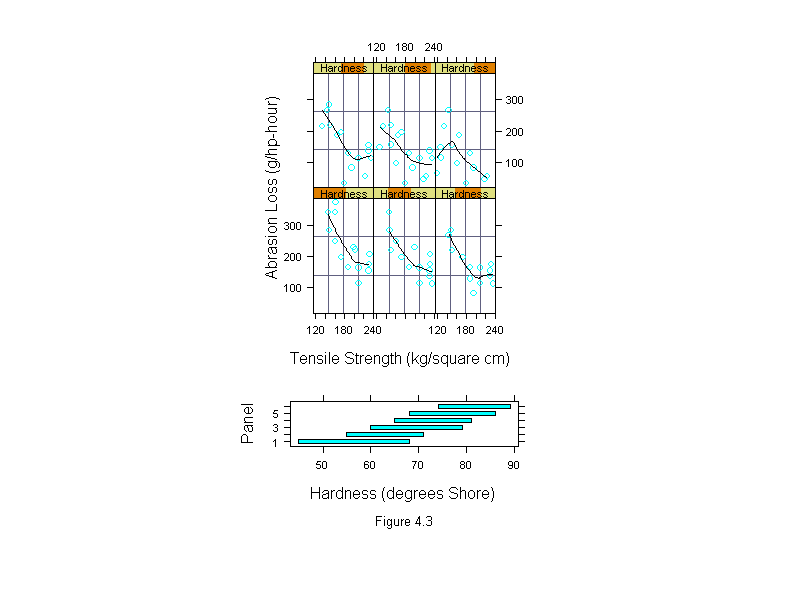
Figure 4.4
attach(rubber)
Tensile.strength <- equal.count(tensile.strength,6,3/4)
ans <- xyplot(abrasion.loss ~ hardness | Tensile.strength,
  prepanel=function(x,y) prepanel.loess(x, y, span = 3/4, degree = 1),
  panel = function(x, y){
    panel.grid()
      panel.xyplot(x,y)
      panel.loess(x, y, span = 3/4, degree = 1)
  },
  layout = c(3, 2),
  xlab = "Hardness (degrees Shore)",
  ylab = "Abrasion Loss (g/hp-hour)")
detach()
print(ans, position=c(0,.375,1,1), more=T)

print(plot(equal.count(rubber$tensile.strength,6,3/4),
  aspect=.25,
  sub = list("Figure 4.4",cex=.8),
  scales=list(x=list(cex=.7),y=list(cex=.7)),
  xlab = "Tensile Strength (kg/square cm)"),
  position=c(0,.1,1,.425))
invisible()
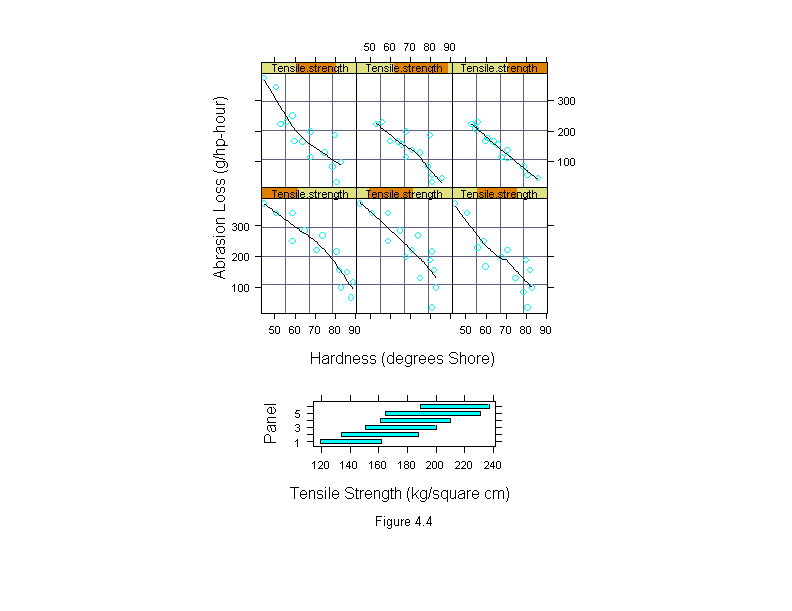
Figure 4.5
splom(~ethanol,
  sub = list("Figure 4.5",cex=.8),
  aspect = 1,
  varnames=c("NOxn(micrograms/J)",
    "CompressionnRatio",
    "EquivalencenRatio"))
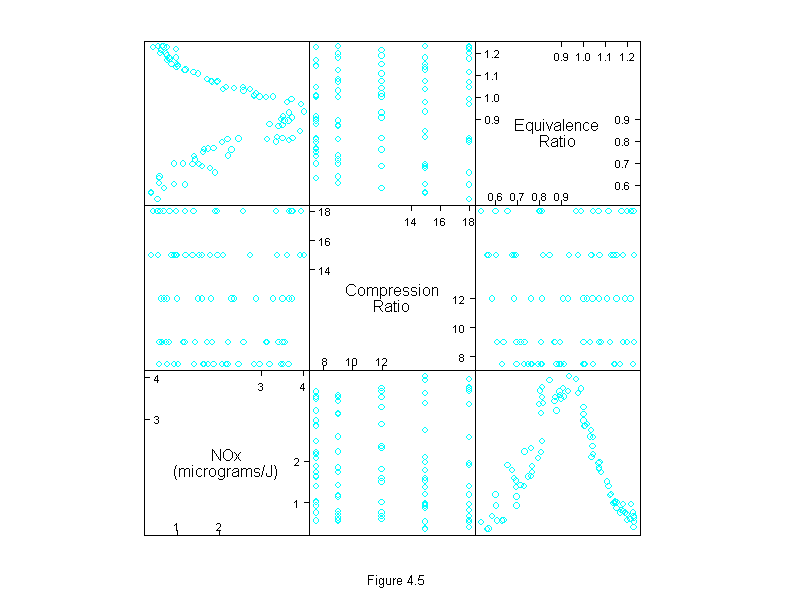
Figure 4.6
attach(ethanol)
Equivalence.Ratio <- equal.count(E, number = 9, overlap = 0.25)
ans <- xyplot(NOx ~ C | Equivalence.Ratio,
  prepanel= function(x,y) prepanel.loess(x, y, span = 1),
  panel = function(x, y) {
    panel.grid(v = 2)
    panel.xyplot(x, y)
    panel.loess(x, y, span = 1)
  },
  aspect = 2.5, # banking to 45 degrees results in aspect that is too big
  layout = c(5, 2),
  xlab = "Compression Ratio",
  ylab = "NOx (micrograms/J)")
detach()
print(ans, position=c(0,.375,1,1), more=T)

print(plot(equal.count(ethanol$E, number = 9, overlap = 0.25),
  sub = list("Figure 4.6",cex=.8),
  scales=list(x=list(cex=.7),y=list(cex=.7)),
  xlab = "Equivalence Ratio"),
  position=c(0,.1,1,.425))
invisible()
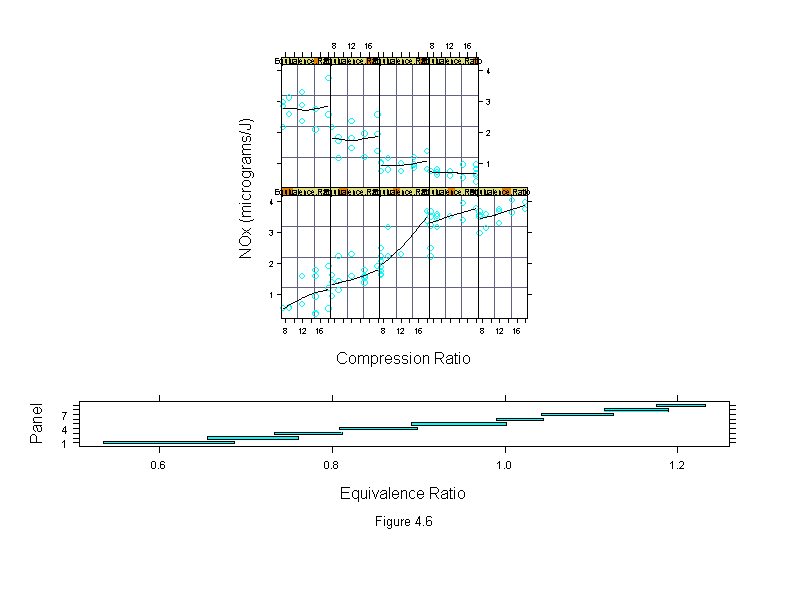
Figure 4.7
attach(ethanol)
Compression.Ratio <- C
ans <- xyplot(NOx ~ E | Compression.Ratio,
  prepanel=function(x,y) prepanel.loess(x, y, span = 3/4, degree = 2),
  panel = function(x, y) {
    panel.grid(h=2)
    panel.xyplot(x, y)
    panel.loess(x, y, span = 3/4, degree = 2)
  },
  layout=c(3,2),
  xlab = "Equivalence Ratio",
  ylab = "NOx (micrograms/J)")
detach()
print(ans, position=c(0,.375,1,1), more=T)

print(plot(shingle(ethanol$C),
  sub = list("Figure 4.7",cex=.8),
  scales=list(x=list(cex=.7),y=list(cex=.7)),
  xlab = "Compression Ratio"),
  position=c(0,.2,1,.5))
invisible()
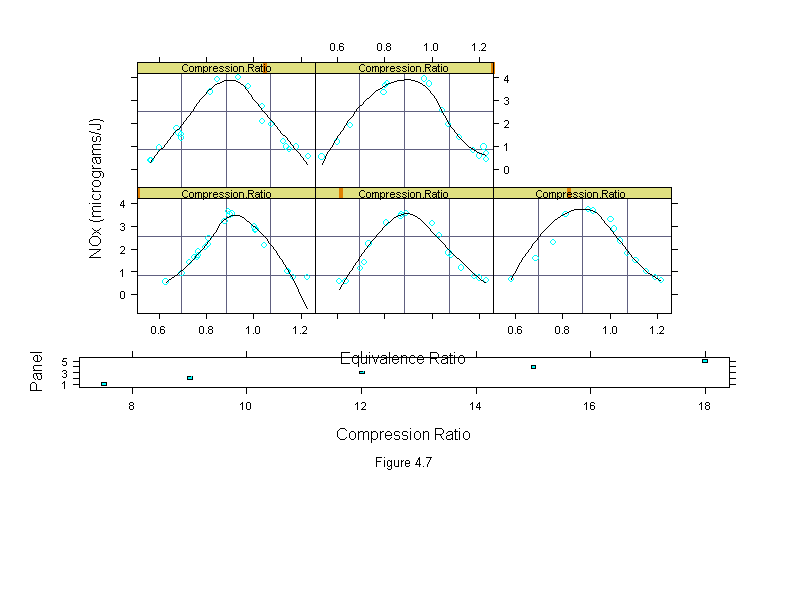
Figure 4.8
splom(~rubber[, 1:3],
  sub = list("Figure 4.8",cex=.8),
  varnames = c("Hardnessn(degrees Shore)",
    "Tensile Strengthn(kg/square cm)",
    "Abrasion Lossn(g/hp-hour)"))
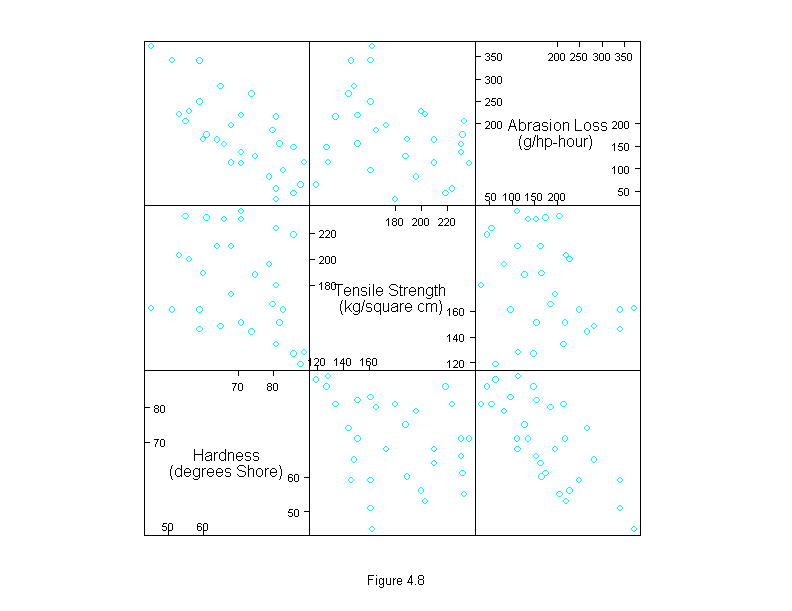
Figure 4.9
splom(~rubber[, 1:3],
  panel = function(x, y) {
       i <- rubber[,1] < 62
       panel.splom(x[!i], y[!i])
       panel.splom(x[i], y[i], pch = "+")
  },
  sub = list("Figure 4.9",cex=.8),
  varnames = c("Hardnessn(degrees Shore)",
    "Tensile Strengthn(kg/square cm)",
    "Abrasion Lossn(g/hp-hour)"))
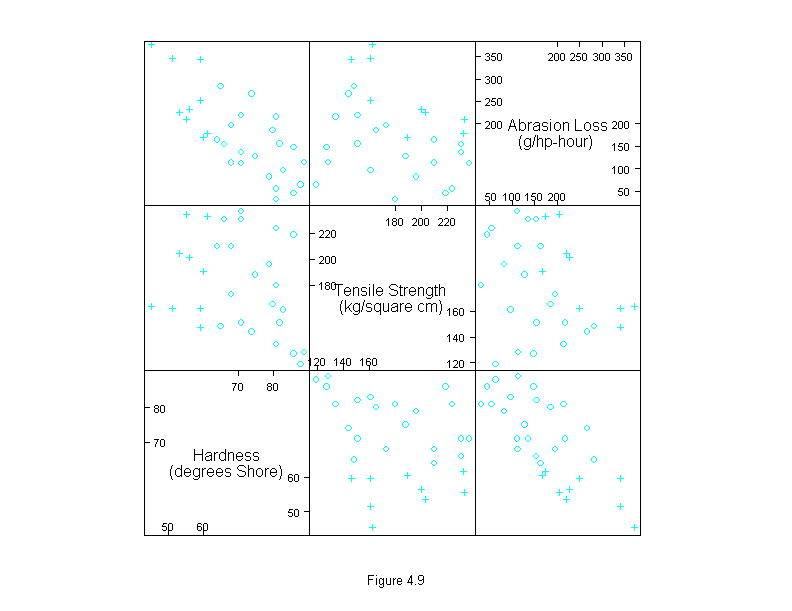
Figure 4.10
splom(~rubber[, 1:3],
  panel = function(x, y) {
       i <- rubber[,1] > 54 & rubber[,1] < 72
       panel.splom(x[!i], y[!i])
       panel.splom(x[i], y[i], pch = "+")
  },
  sub = list("Figure 4.10",cex=.8),
  varnames = c("Hardnessn(degrees Shore)",
    "Tensile Strengthn(kg/square cm)",
    "Abrasion Lossn(g/hp-hour)"))
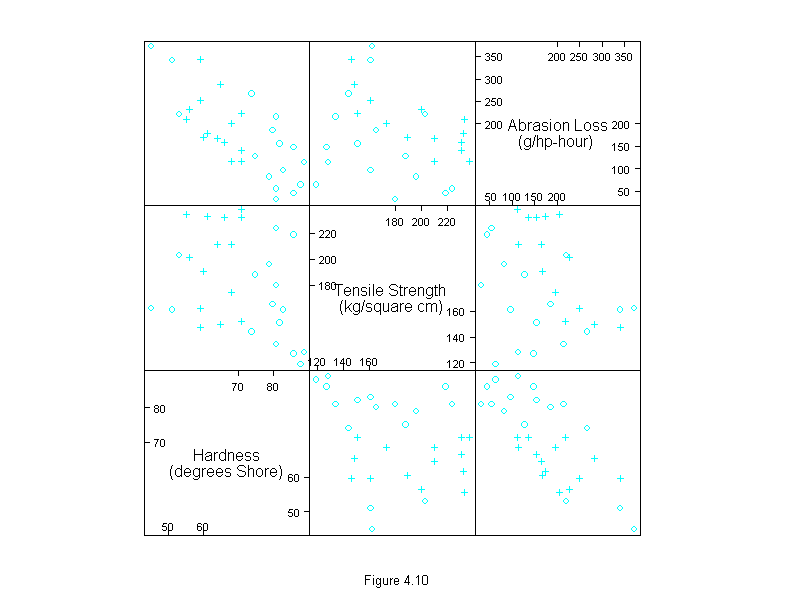
Figure 4.11
splom(~rubber[, 1:3],
  panel = function(x, y) {
       i <- rubber[,2] < 170
       panel.splom(x[!i], y[!i])
       panel.splom(x[i], y[i], pch = "+")
  },
  sub = list("Figure 4.11",cex=.8),
  varnames = c("Hardnessn(degrees Shore)",
    "Tensile Strengthn(kg/square cm)",
    "Abrasion Lossn(g/hp-hour)"))
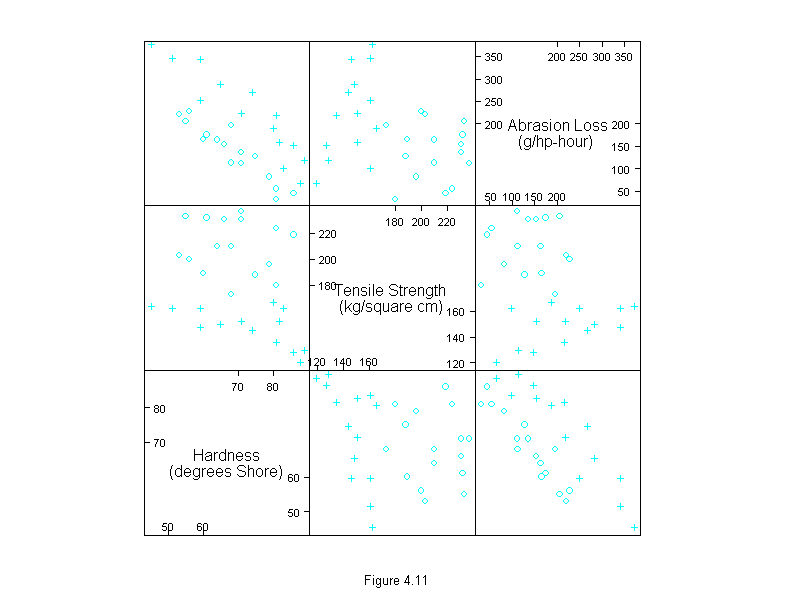
Figure 4.12
attach(ethanol)
eth.m <- loess(NOx ~ C * E, span = 1/3, degree = 2,
  parametric = "C", drop.square = "C",family="s")
CE.marginal <- list(C=seq(min(C),max(C),length=2),
  E=seq(min(E),max(E),length=16))
CE.grid <- expand.grid(CE.marginal)
eth.fit <- predict(eth.m,CE.grid)
EQ.Ratio <- CE.grid$E
ans <- xyplot(eth.fit ~ CE.grid$C | EQ.Ratio,
  aspect=2,
  layout = c(8, 2),
  panel = function(x, y) {
    panel.grid(v=2)
    panel.xyplot(x, y, type = "l")
  },
  xlab = "Compression Ratio",
  ylab = "NOx (micrograms/J)")
detach()
print(ans, position=c(0,.3,1,1), more=T)

ans <- plot(shingle(seq(min(ethanol$E), max(ethanol$E), length=16)),
  sub = list("Figure 4.12",cex=.8),
  scales=list(x=list(cex=.7),y=list(cex=.7)),
  xlab = "Equivalence Ratio")
print(ans, position=c(0,.1,1,.45))
invisible()
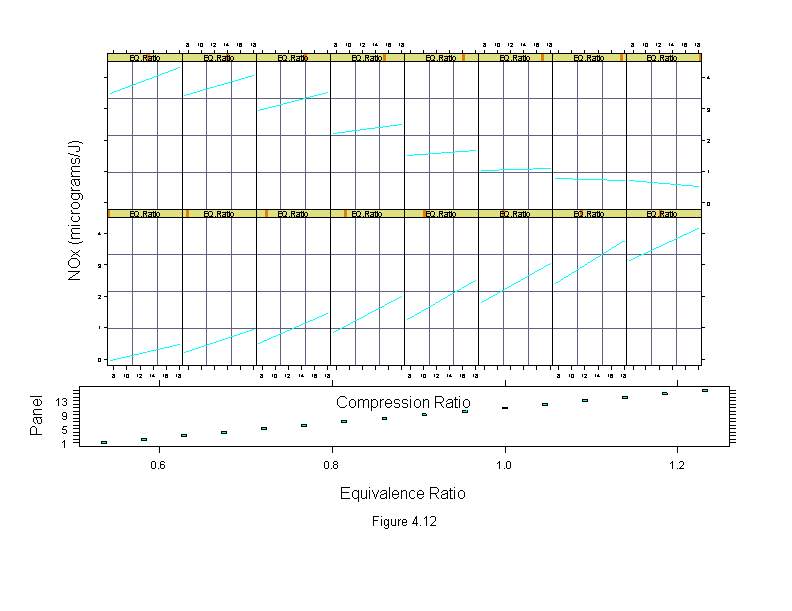
Figure 4.13
attach(ethanol)
eth.m <- loess(NOx ~ C * E, span = 1/3, degree = 2,
  parametric = "C", drop.square = "C",family="s")
C.marginal <- seq(min(C),max(C),length=16)
E.marginal <- seq(min(E),max(E),length=50)
CE.marginal <- list(C=C.marginal,E=E.marginal)
CE.grid <- expand.grid(CE.marginal)
eth.fit <- predict(eth.m,CE.grid)
Compression.Ratio <- CE.grid$C
ans <- xyplot(eth.fit ~ CE.grid$E | Compression.Ratio,
  panel = function(x, y) {
    panel.grid(h=2)
    panel.xyplot(x, y, type = "l")
  },
  aspect="xy",
  layout = c(4, 4),
  xlab = "Equivalence Ratio",
  ylab = "NOx (micrograms/J)")
detach()
print(ans, position=c(0,.3,1,1), more=T)

ans <- plot(shingle(seq(min(ethanol$C), max(ethanol$C), length=16)),
  sub = list("Figure 4.13",cex=.8),
  scales=list(x=list(cex=.7),y=list(cex=.7)),
  xlab = "Compression Ratio")
print(ans, position=c(0,.1,1,.45))
invisible()
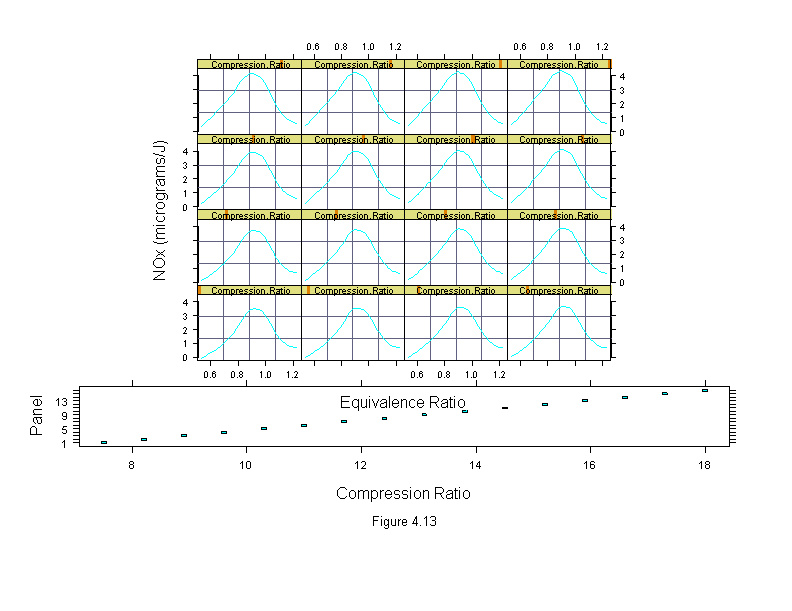
Figure 4.14
attach(ethanol)
c.values <- seq(min(C), max(C), length = 16)
e.values <- seq(min(E), max(E), length = 16)
ans <- xyplot(E ~ C,
  panel = substitute(function(x, y){
    segments(rep(min(x),16),e.values,rep(max(x),16),e.values)
    segments(c.values,rep(min(y),16),c.values,rep(max(y),16))
    panel.xyplot(x, y, col=0, pch=16)  # cover grid lines
    panel.xyplot(x, y)
  }),
  aspect = 1,
  sub = list("Figure 4.14",cex=.8),
  xlab = "Compression Ratio",
  ylab = "Equivalence Ratio")
detach()
ans
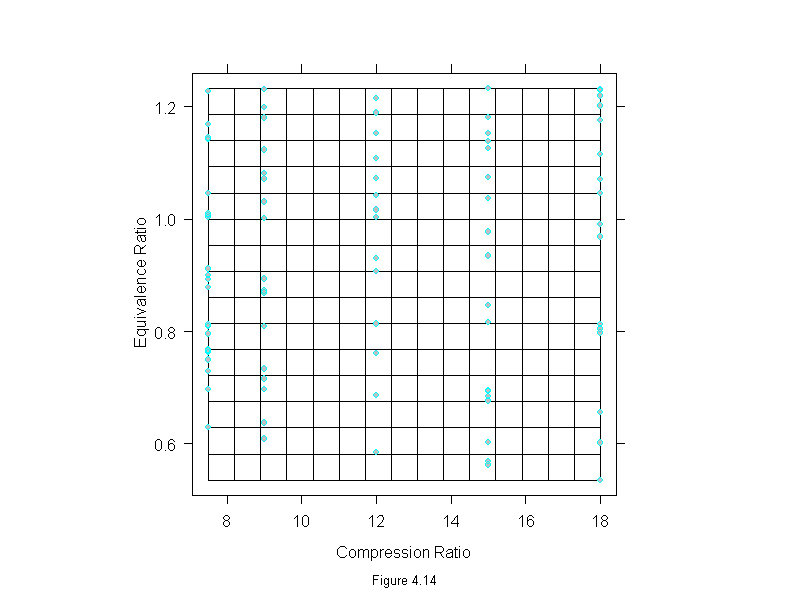
Figure 4.14
xyplot(hardness ~ tensile.strength,
  data = rubber,
  aspect=1,
  panel = function(x, y) {
    panel.xyplot(x, y)
    panel.abline(h=c(55,83),v=c(144,237))
  },
  ylab= "Hardness (degrees Shore)",
  sub = list("Figure 4.15",cex=.8),
  xlab= "Tensile Strength (kg/square cm)")
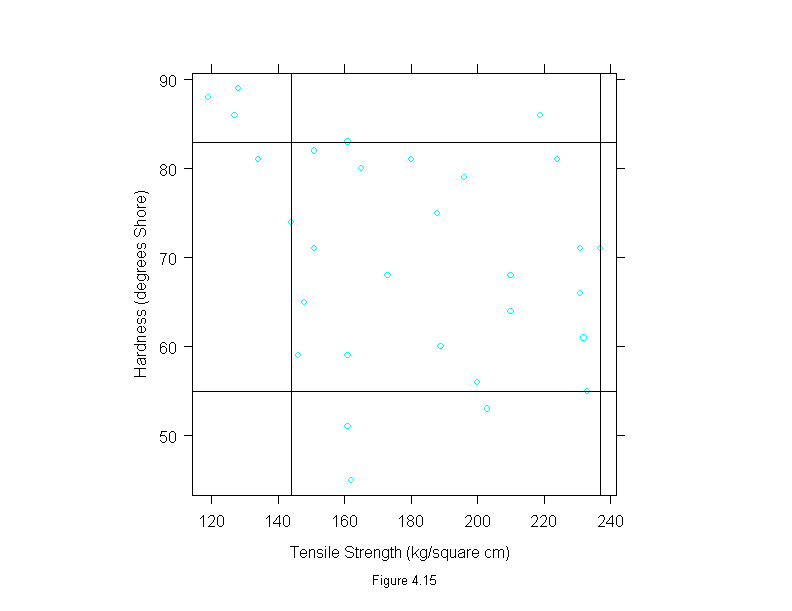
Figure 4.16
attach(rubber)
wt <- rep(1,length(abrasion.loss))
for(i in 1:10){
  rub.lm <- lm(abrasion.loss~hardness+ts.low,weights=wt)
  wt <- wt.bisquare(rub.lm$res/median(abs(rub.lm$res)),c=6)
grid <- expand.grid(hardness = seq(55, 83, length = 4),
  tensile.strength = c(seq(144,180,length=50),c(181, 190)))
center <- grid$tensile.strength-180
grid$ts.low <- center*(center<0)
rub.fit <- predict(rub.lm,grid)
Hardness <- grid$hardness
ans <- xyplot(rub.fit ~ grid$tensile.strength | Hardness,
  aspect="xy",
  layout = c(4, 1),
  panel = function(x, y) {
    panel.grid(v=2)
    panel.xyplot(x, y, type = "l")
  },
  xlab = "Tensile Strength (kg/square cm)",
  ylab = "Abrasion Loss (g/hp-hour)")
detach()
print(ans, position=c(0,.3,1,1), more=T)

print(plot(shingle(seq(55, 83, length = 4)),
  sub = list("Figure 4.16",cex=.8),
  scales=list(x=list(cex=.7),y=list(cex=.7)),
  xlab = "Hardness (degrees Shore)"),
  position=c(0,.1,1,.45))
invisible()
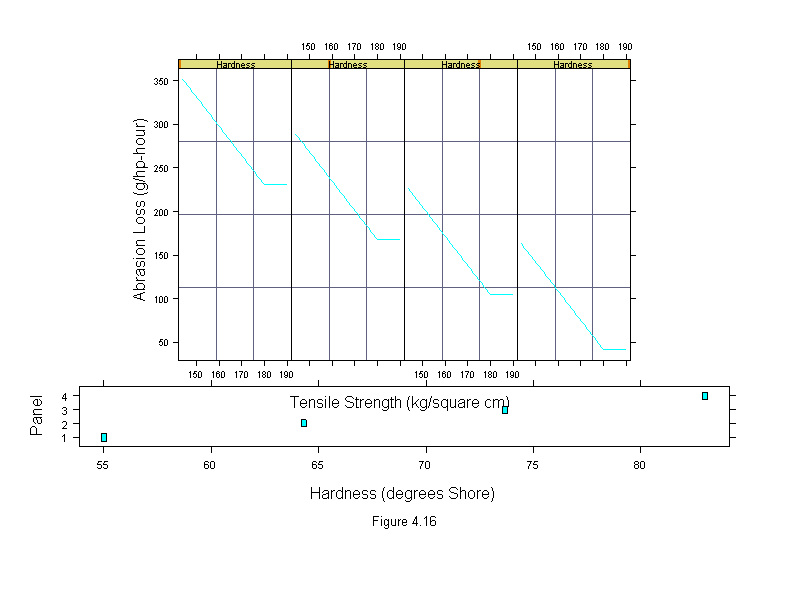
Figure 4.17
attach(rubber)
wt <- rep(1,length(abrasion.loss))
for(i in 1:10){
  rub.lm <- lm(abrasion.loss~hardness+ts.low,weights=wt)
  wt <- wt.bisquare(rub.lm$res/median(abs(rub.lm$res)),c=6)
grid<-expand.grid(tensile.strength = seq(144,180,length = 3),
  hardness = seq(55, 83,length=50))
#this mimics the computation of ts.low for this cropped version of tensile strength
center <- grid$tensile.strength-180
grid$ts.low <- center*(center<0)
rub.fit <- predict(rub.lm,grid)
Tensile.strength <- grid$tensile.strength
ans <- xyplot(rub.fit ~ grid$hardness | Tensile.strength,
  aspect="xy",
  layout = c(3, 1),
  panel = function(x, y) {
    panel.grid(v=2)
    panel.xyplot(x, y, type = "l")
  },
  xlab = "Hardness (degrees Shore)",
  ylab = "Abrasion Loss (g/hp-hour)")
detach()
print(ans, position=c(0,.3,1,1), more=T)

print(plot(shingle(seq(144,180,length = 3)),
  sub = list("Figure 4.17",cex=.8),
  scales=list(x=list(cex=.7),y=list(cex=.7)),
  xlab = "Tensile Strength (kg/square cm)"),
  position=c(0,.1,1,.45))
invisible()
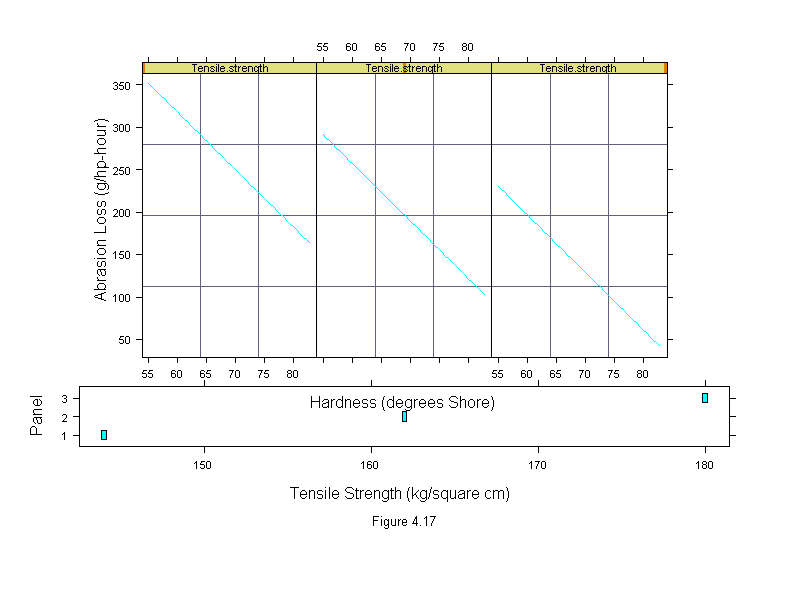
Figure 4.18
attach(rubber)
wt <- rep(1,length(abrasion.loss))
for(i in 1:10){
  rub.lm <- lm(abrasion.loss~hardness+ts.low,weights=wt)
  wt <- wt.bisquare(rub.lm$res/median(abs(rub.lm$res)),c=6)
ans <- xyplot(residuals(rub.lm) ~ tensile.strength,
  panel = function(x, y) {
    panel.xyplot(x, y)
    panel.loess(x, y, span=1)
    panel.abline(h=0)
  },
  aspect=1,
  sub = list("Figure 4.18",cex=.8),
  xlab = "Tensile Strength (kg/square cm)",
  ylab = "Residual Abrasion Loss (g/hp-hour)")
detach()
ans
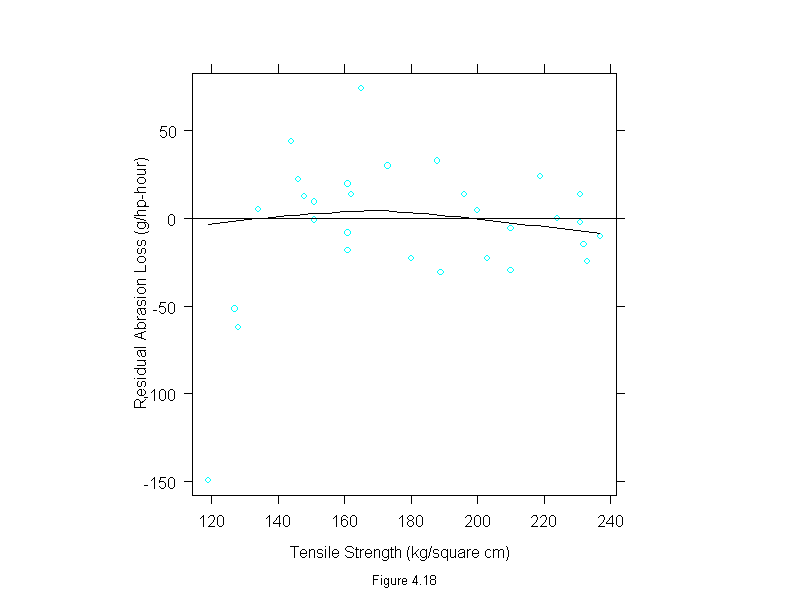
Figure 4.19
attach(rubber)
wt <- rep(1,length(abrasion.loss))
for(i in 1:10){
  rub.lm <- lm(abrasion.loss~hardness+ts.low,weights=wt)
  wt <- wt.bisquare(rub.lm$res/median(abs(rub.lm$res)),c=6)
ans <- xyplot(residuals(rub.lm) ~ hardness,
  panel = function(x, y) {
    panel.xyplot(x, y)
    panel.loess(x, y, span=1)
    panel.abline(h=0)
  },
  aspect=1,
  sub = list("Figure 4.19",cex=.8),
  xlab = "Hardness (degrees Shore)",
  ylab = "Residual Abrasion Loss (g/hp-hour)")
detach()
ans
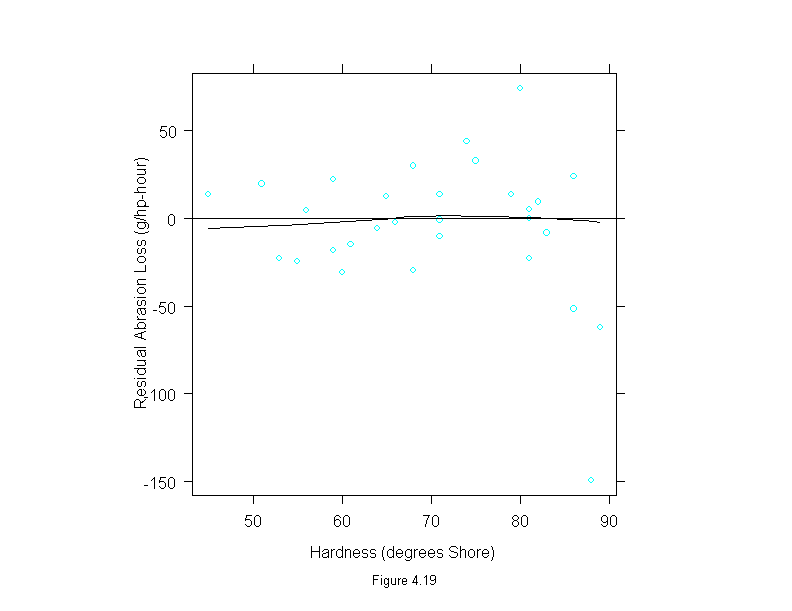
Figure 4.20
attach(rubber)
wt <- rep(1,length(abrasion.loss))
for(i in 1:10){
  rub.lm <- lm(abrasion.loss~hardness+ts.low,weights=wt)
  wt <- wt.bisquare(rub.lm$res/median(abs(rub.lm$res)),c=6)
Hardness <- equal.count(hardness,6,3/4)
ans <- xyplot(residuals(rub.lm) ~ tensile.strength | Hardness,
  panel = function(x, y, ...) {
    panel.grid(v=2)
    panel.xyplot(x, y)
    panel.loess(x, y, span = 1, degree = 1)
    panel.abline(h=0)
  },
  aspect = 2,
  layout = c(3, 2),
  xlab = "Tensile Strength (kg/square cm)",
  ylab = "Residual Abrasion Loss (g/hp-hour)")
detach()
print(ans, position=c(0,.375,1,1), more=T)

print(plot(equal.count(rubber$hardness,6,3/4),
  sub = list("Figure 4.20",cex=.8),
  scales=list(x=list(cex=.7),y=list(cex=.7)),
  xlab = "Hardness (degrees Shore)"),    position=c(0,.1,1,.425))
invisible()
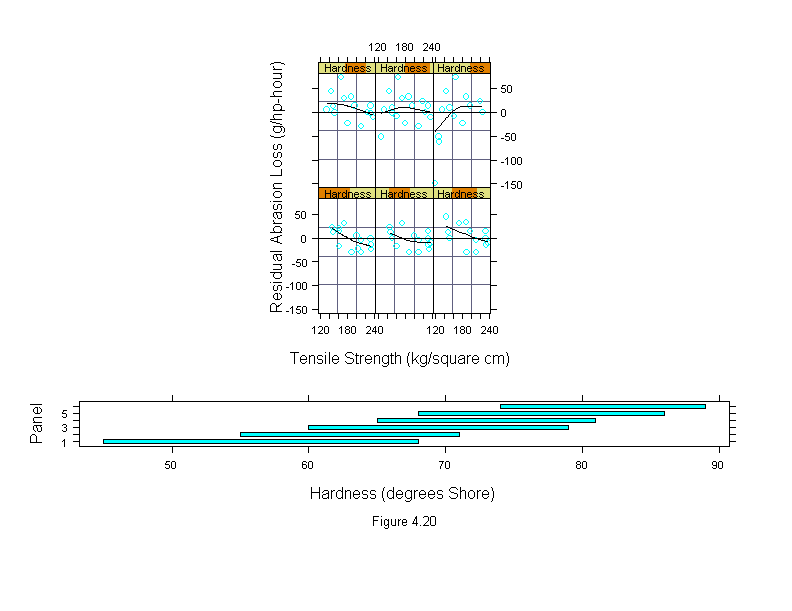
Figure 4.21
attach(rubber)
wt <- rep(1,length(abrasion.loss))
for(i in 1:10){
  rub.lm <- lm(abrasion.loss~hardness+ts.low,weights=wt)
  wt <- wt.bisquare(rub.lm$res/median(abs(rub.lm$res)),c=6)
Tensile.Strength <- equal.count(tensile.strength,6,3/4)
ans <- xyplot(residuals(rub.lm) ~ hardness | Tensile.Strength,
  panel = function(x, y) {
    panel.grid(v=2)
    panel.xyplot(x, y)
    panel.loess(x, y, span = 1, degree = 1)
    panel.abline(h=0)
  },
  aspect = 2,
  layout = c(3, 2),
  xlab = "Hardness (degrees Shore)",
  ylab = "Residual Abrasion Loss (g/hp-hour)")
detach()
print(ans, position=c(0,.375,1,1), more=T)

print(plot(equal.count(rubber$tensile.strength,6,3/4),
  sub = list("Figure 4.21",cex=.8),
  scales=list(x=list(cex=.7),y=list(cex=.7)),
  xlab = "Tensile Strength (kg/square cm)"),
  position=c(0,.1,1,.425))
invisible()
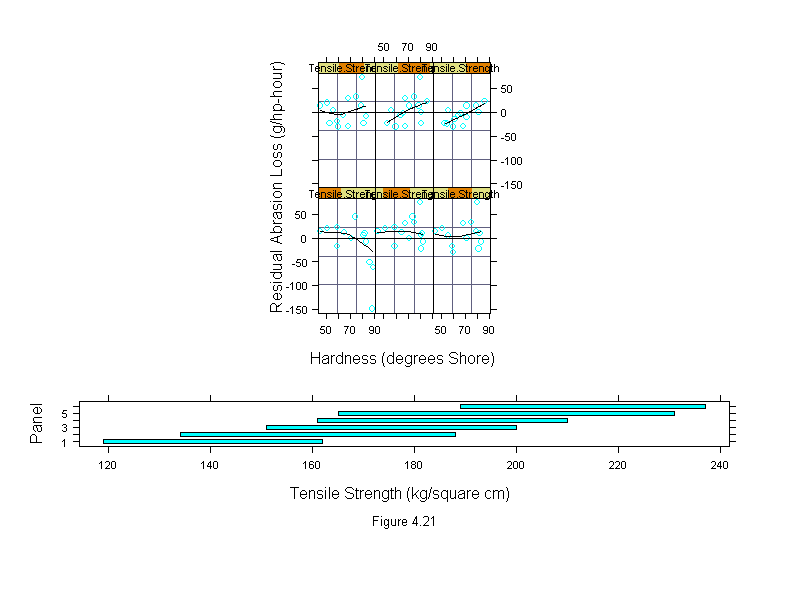
Figure 4.22
new.rubber <- rubber[rubber$tensile.strength>130,]
attach(new.rubber)
wt <- rep(1,length(abrasion.loss))
for(i in 1:10){
  rub.lm <- lm(abrasion.loss~hardness*ts.low, weights=wt)
  wt <- wt.bisquare(rub.lm$res/median(abs(rub.lm$res)),c=6)
Hardness <- equal.count(hardness,6,3/4)
ans <- xyplot(residuals(rub.lm) ~ tensile.strength | Hardness,
  panel = function(x, y, ...) {
    panel.grid(v=2, h=2)
    panel.xyplot(x, y)
    panel.loess(x, y, span = 1, degree = 1)
    panel.abline(h=0)
  },
  aspect = 1,
  layout = c(3, 2),
  xlab = "Tensile Strength (kg/square cm)",
  ylab = "Residual Abrasion Loss (g/hp-hour)")
detach()
print(ans, position=c(0,.375,1,1), more=T)

print(plot(equal.count(rubber[rubber$tensile.strength>130,]$hardness,6,3/4),
  sub = list("Figure 4.22",cex=.8),
  scales=list(x=list(cex=.7),y=list(cex=.7)),
  xlab = "Hardness (degrees Shore)"),
  position=c(0,.1,1,.425))
invisible()
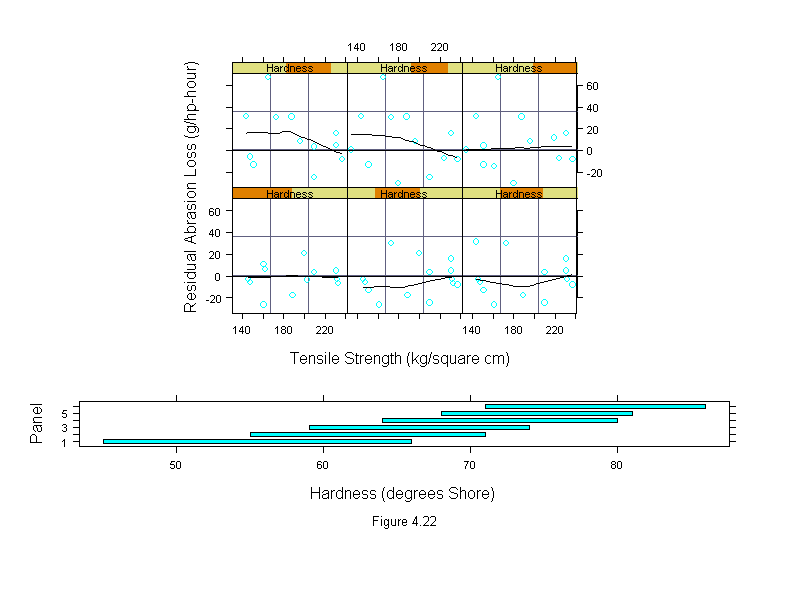
Figure 4.23
new.rubber <- rubber[rubber$tensile.strength>130,]
attach(new.rubber)
wt <- rep(1,length(abrasion.loss))
for(i in 1:10){
  rub.lm <- lm(abrasion.loss~hardness*ts.low,weights=wt)
  wt <- wt.bisquare(rub.lm$res/median(abs(rub.lm$res)),c=6)
Tensile.Strength <- equal.count(tensile.strength,6,3/4)
ans <- xyplot(residuals(rub.lm) ~ hardness | Tensile.Strength,
  panel = function(x, y, ...) {
    panel.grid(v=2, h=2)
    panel.xyplot(x, y)
    panel.loess(x, y, span = 1, degree = 1)
    panel.abline(h=0)
  },
  aspect = 1,
  layout = c(3, 2),
  xlab = "Hardness (degrees Shore)",
  ylab = "Residual Abrasion Loss (g/hp-hour)")
detach()
print(ans, position=c(0,.375,1,1), more=T)

print(plot(equal.count(rubber[rubber$tensile.strength>130,]$tensile.strength,6,3/4),
  sub = list("Figure 4.23",cex=.8),
  scales=list(x=list(cex=.7),y=list(cex=.7)),
  xlab = "Tensile Strength (kg/square cm)"),
  position=c(0,.1,1,.425))
invisible()
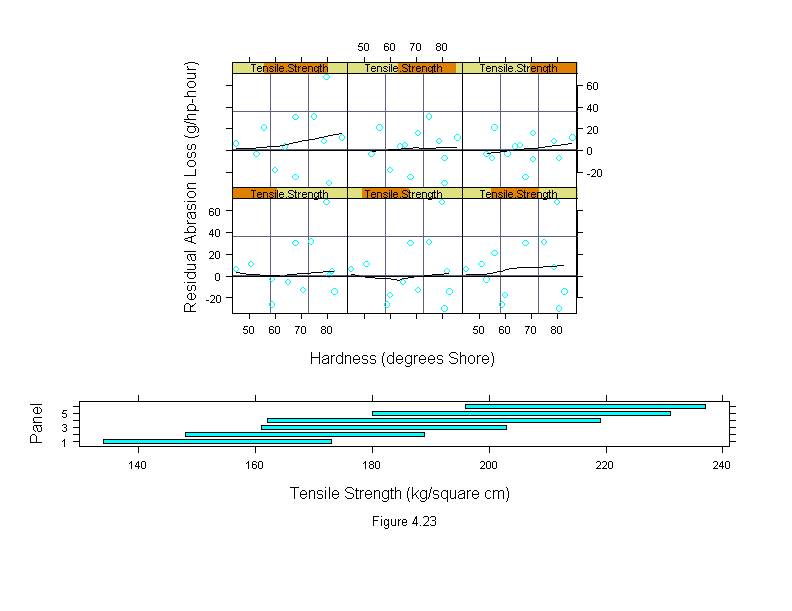
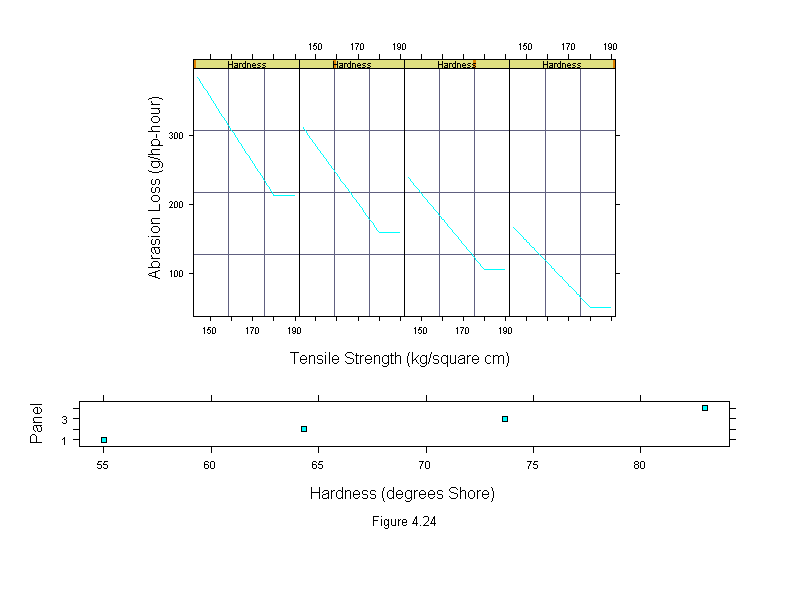
Figure 4.24
new.rubber <- rubber[rubber$tensile.strength>130,]
attach(new.rubber)
wt <- rep(1,length(abrasion.loss))
for(i in 1:10){
  rub.lm <- lm(abrasion.loss~hardness*ts.low,weights=wt)
  wt <- wt.bisquare(rub.lm$res/median(abs(rub.lm$res)),c=6)
grid <- expand.grid(hardness = seq(55, 83, length = 4),
  tensile.strength = c(seq(144,180,length=50),181, 190))
center <- grid$tensile.strength-180
grid$ts.low <- center*(center<0)
rub.fit <- predict(rub.lm,grid)
Hardness <- grid$hardness
ans <- xyplot(rub.fit ~ grid$tensile.strength | Hardness,
  aspect="xy",
  layout = c(4, 1),
  panel = function(x, y) {
    panel.grid(v=2)
    panel.xyplot(x, y, type = "l")
  },
  xlab = "Tensile Strength (kg/square cm)",
  ylab = "Abrasion Loss (g/hp-hour)")
detach()  print(ans, position=c(0,.375,1,1), more=T)

print(plot(shingle(seq(55, 83, length = 4)),
  sub = list("Figure 4.24",cex=.8),
  scales=list(x=list(cex=.7),y=list(cex=.7)),
  xlab = "Hardness (degrees Shore)"),
  position=c(0,.1,1,.425))
invisible()
Figure
new.rubber <- rubber[rubber$tensile.strength>130,]
attach(new.rubber)
wt <- rep(1,length(abrasion.loss))
for(i in 1:10){
  rub.lm <- lm(abrasion.loss~hardness*ts.low, weights=wt)
  wt <- wt.bisquare(rub.lm$res/median(abs(rub.lm$res)),c=6)
grid<-expand.grid(tensile.strength = seq(144,180,length = 3),
    hardness = seq(55, 83,length=50))
center <- grid$tensile.strength-180
grid$ts.low <- center*(center<0)
rub.fit <- predict(rub.lm,grid)
Tensile.Strength <- grid$tensile.strength
ans <- xyplot(rub.fit ~ grid$hardness | Tensile.Strength,    aspect="xy",
  layout = c(3, 1),
  panel = function(x, y) {
    panel.grid(h=2)
    panel.xyplot(x, y, type = "l")
  },
  xlab = "Hardness (degrees Shore)",
  ylab = "Abrasion Loss (g/hp-hour)")
detach()
print(ans, position=c(0,.375,1,1), more=T)

print(plot(shingle(seq(144,180,length = 3)),
  sub = list("Figure 4.25",cex=.8),
  scales=list(x=list(cex=.7),y=list(cex=.7)),
  xlab = "Tensile Strength (kg/square cm)"),
  position=c(0,.1,1,.425))
invisible()
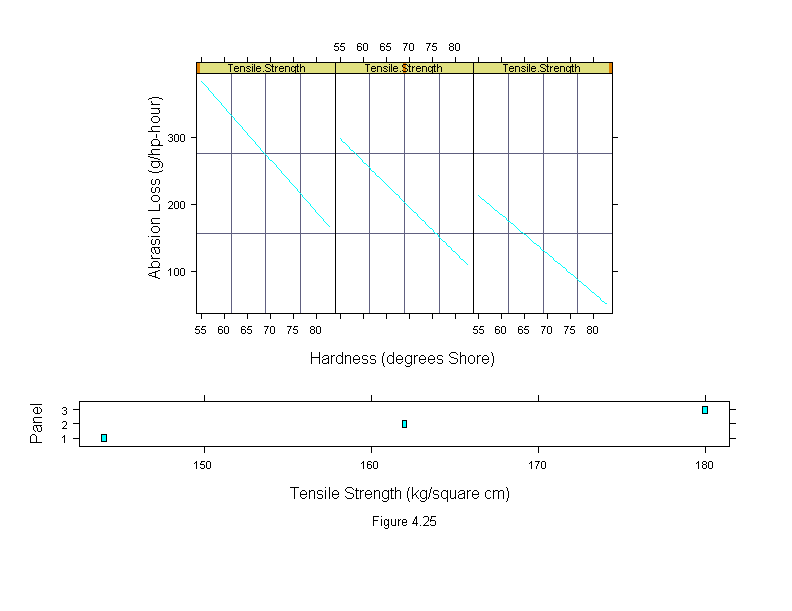
Figure 4.26
new.rubber <- rubber[rubber$tensile.strength>130,]
attach(new.rubber)
wt <- rep(1,length(abrasion.loss))
for(i in 1:10){
  rub.lm <- lm(abrasion.loss~hardness*ts.low, weights=wt)
  wt <- wt.bisquare(rub.lm$res/median(abs(rub.lm$res)),c=6)
ans <- xyplot(sqrt(abs(rub.lm$res)) ~ rub.lm$fit,
  panel = function(x, y){
    panel.xyplot(x, y)
    panel.loess(x, y, span=2)
  },
  aspect=1,
  sub = list("Figure 4.26",cex=.8),
  xlab = "Fitted Abrasion Loss (g/hp-hour)",
  ylab = "Square Root Absolute Residual Abrasion Loss (g/hp-hour)")
detach()
ans
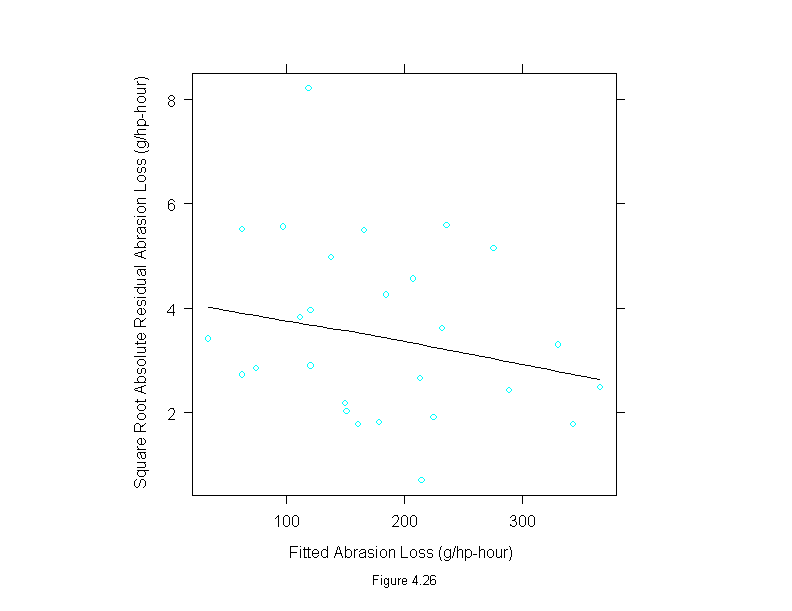
Figure 4.27
new.rubber <- rubber[rubber$tensile.strength>130,]
attach(new.rubber)
wt <- rep(1,length(abrasion.loss))
for(i in 1:10){
  rub.lm <- lm(abrasion.loss~hardness*ts.low, weights=wt)
  wt <- wt.bisquare(rub.lm$res/median(abs(rub.lm$res)),c=6)
ans <- qqmath(~residuals(rub.lm),
  prepanel = prepanel.qqmathline,
  panel = function(x, y) {
    panel.qqmathline(y, distribution = qnorm)
    panel.qqmath(x, y)
  },
  aspect=1,
  sub = list("Figure 4.27",cex=.8),
  xlab = "Unit Normal Quantile",
  ylab="Residual Abrasion Loss (g/hp-hour)")
detach()
ans
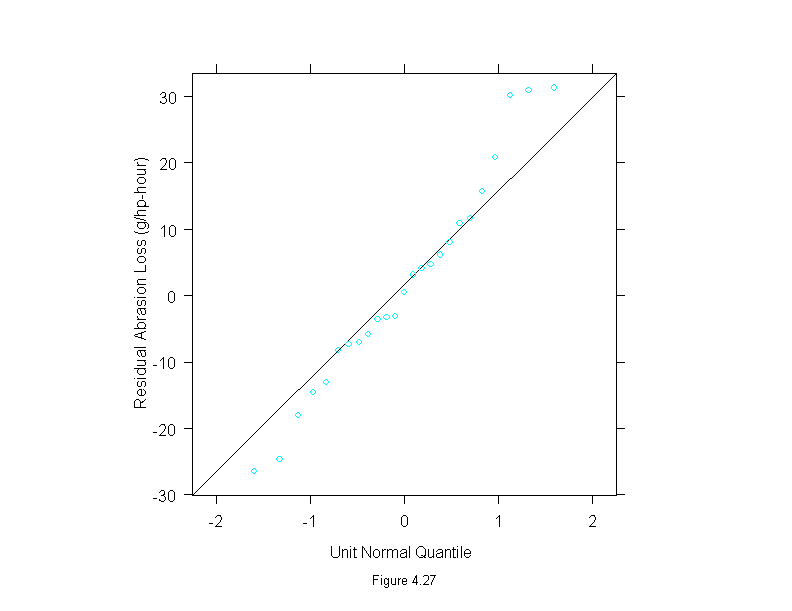
Figure 4.28
new.rubber <- rubber[rubber$tensile.strength>130,]
attach(new.rubber)
wt <- rep(1,length(abrasion.loss))
for(i in 1:10){
  rub.lm <- lm(abrasion.loss~hardness*ts.low, weights=wt)
  wt <- wt.bisquare(rub.lm$res/median(abs(rub.lm$res)),c=6)
ans <- rfs(rub.lm,
  sub = list("Figure 4.28",cex=.8),
  aspect=1.5,
  ylab="Residual Abrasion Loss (g/hp-hour)")
detach()
ans
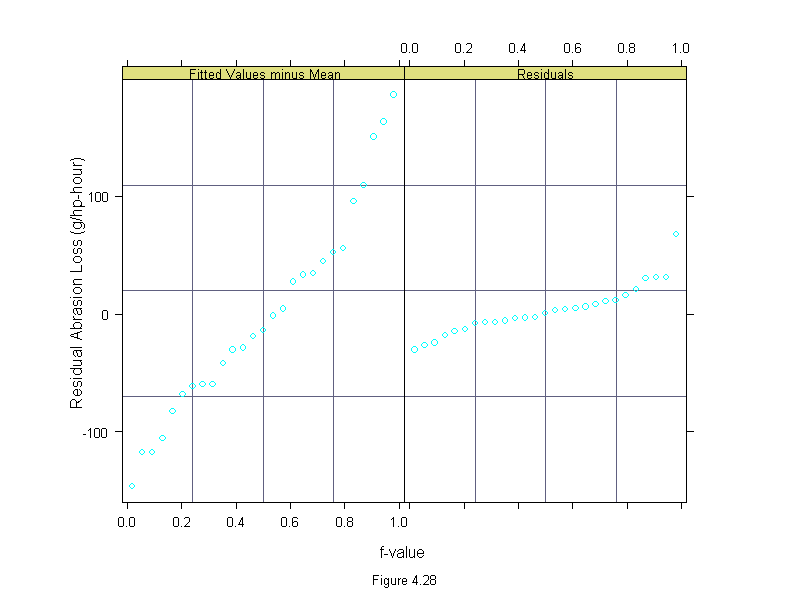
Figure 4.29
xyplot(loess(NOx ~ C * E, span = 1/2, degree = 2,
    parametric = "C", drop.square = "C",family="s")$residuals ~ E,
  data = ethanol,
  panel = function(x, y) {
    panel.xyplot(x, y)
    panel.loess(x, y, span=1/2, degree=1)
    panel.abline(h=0)
  },
  aspect=1,
  sub = list("Figure 4.29",cex=.8),
  xlab="Equivalence Ratio",
  ylab = "Residual NOx (micrograms/J)")
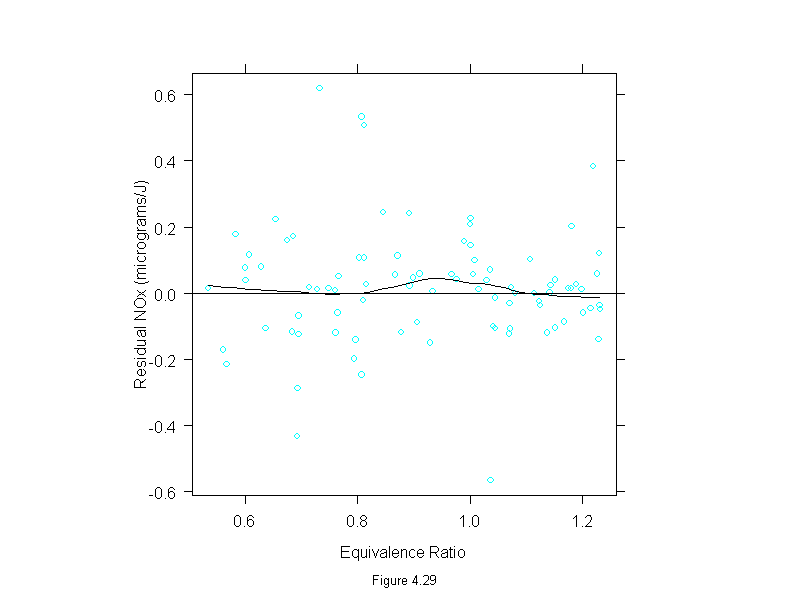
Figure 4.30
attach(ethanol)
eth.m <- loess(NOx ~ C * E, span = 1/3, degree = 2,
  parametric = "C", drop.square = "C",family="s")
ans <- xyplot(sqrt(abs(residuals(eth.m))) ~ fitted.values(eth.m),
  panel = function(x, y) {
    panel.xyplot(x, y)
    panel.loess(x, y, span=2)
  },
  aspect=1,
  scales=list(cex=.9),
  sub = list("Figure 4.30",cex=.8),
  xlab = list("Fitted NOx (micrograms/J)",cex=.9),
  ylab = list("Square Root Absolute Residual NOx (square root micrograms/J)",cex=.9))
detach()
ans
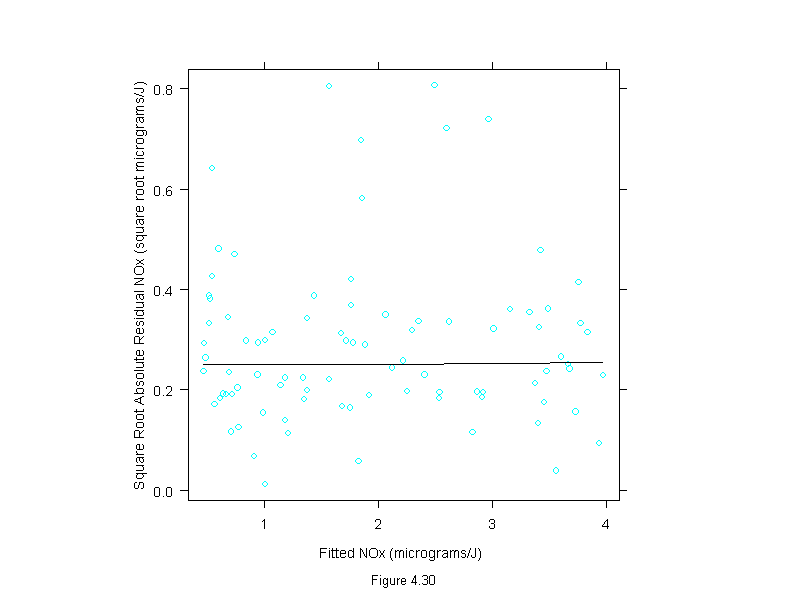
Figure 4.31
qqmath(~loess(NOx ~ C * E, data = ethanol, span = 1/3, degree = 2,
    parametric = "C", drop.square = "C",family="s")$residuals,
  prepanel = prepanel.qqmathline,
  panel = function(x, y) {
    panel.qqmathline(y, distribution = qnorm)
    panel.qqmath(x, y)
  },
  aspect=1,
  sub = list("Figure 4.31",cex=.8),
  xlab = "Unit Normal Quantile",
  ylab = "Residual NOx (micrograms/J)")
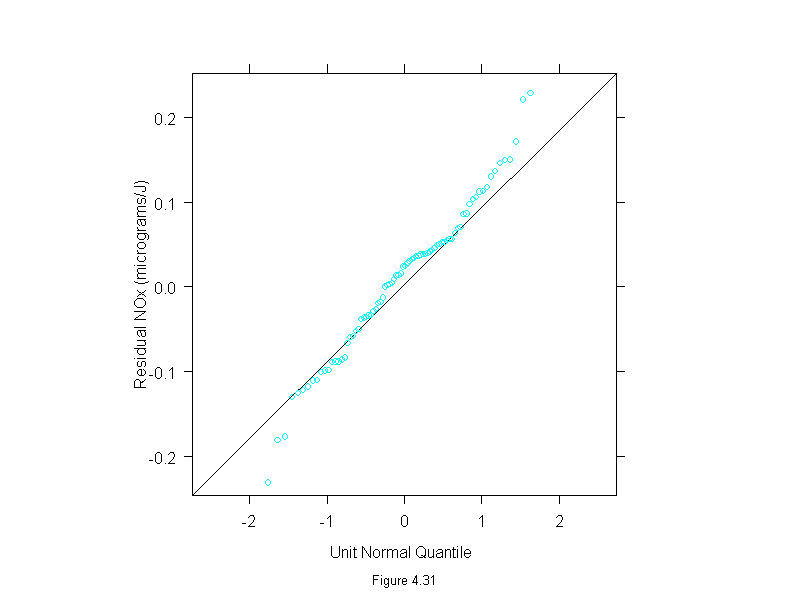
Figure 4.32
rfs(loess(NOx ~ C * E, data = ethanol, span = 1/3, degree = 2,
    parametric = "C", drop.square = "C",family="s"),
  sub = list("Figure 4.32",cex=.8),
  aspect=2,
  ylab = "NOx (micrograms/J)")
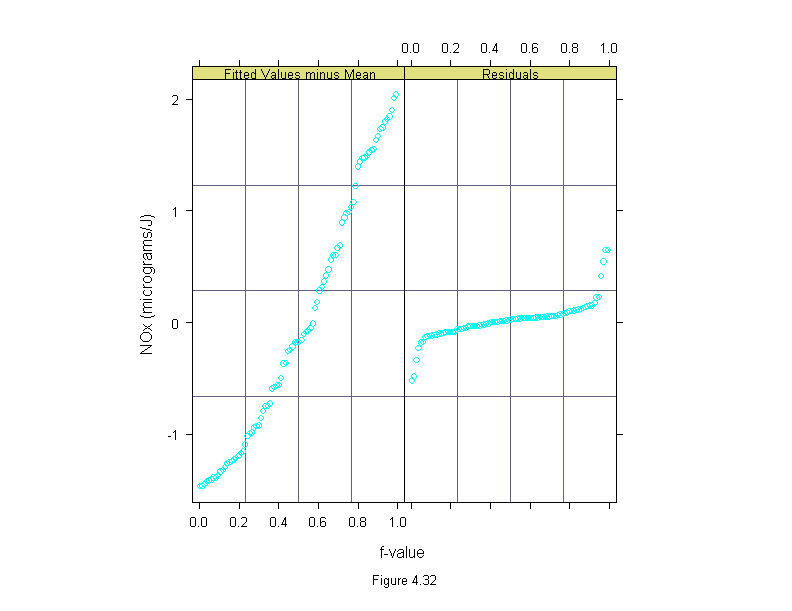
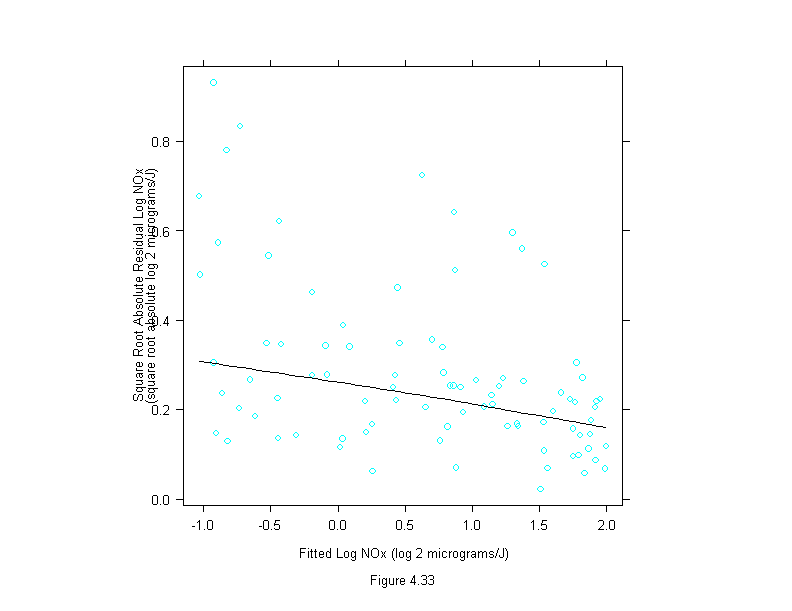
Figure 4.33
attach(ethanol)
eth.m <- loess(logb(NOx,2) ~ C * E, span = 1/3, degree = 2,
  parametric = "C", drop.square = "C",family="s")
ans <- xyplot(sqrt(abs(eth.m$res)) ~ eth.m$fit,
  panel = function(x, y) {
    panel.xyplot(x, y)
    panel.loess(x, y, span=2)
  },
  aspect=1,
  scales=list(cex=.8),
  sub = list("Figure 4.33",cex=.8),
  xlab = list("Fitted Log NOx (log 2 micrograms/J)",cex=.8),
  ylab = list("Square Root Absolute Residual Log NOxn(square root absolute log 2 micrograms/J)n",cex=.8))
detach()
ans
# no fig 4.34
Figure 4.35
set.seed(19)
new.slope <- slope
new.slope$percent <- jitter(new.slope$percent,2)
splom(~new.slope,
  varnames =c("AbsolutenErrorn(%)",
    "JitterednPercentn(%)",
    "Distancen(degrees)",
    "Resolutionn(degrees)"),
sub = list("Figure 4.35",cex=.8))
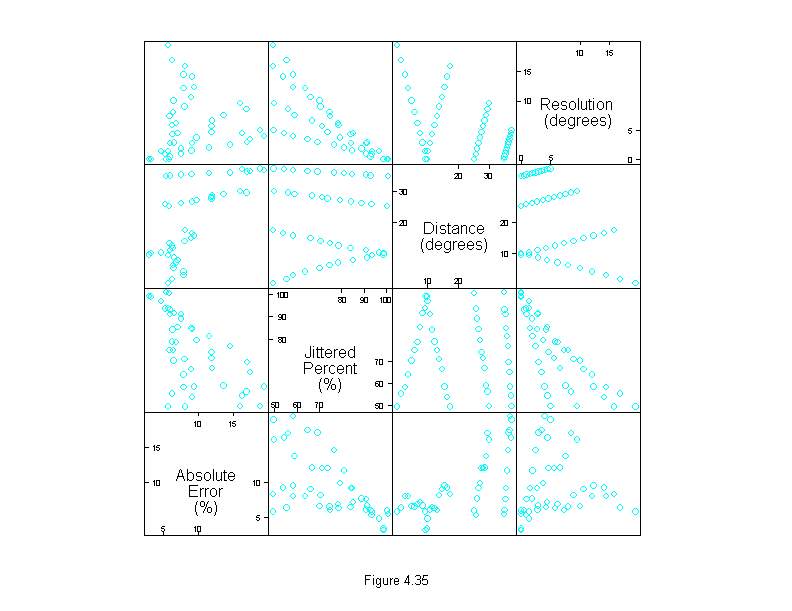
Figure 4.36
print(xyplot(error ~ distance | percent,
  data = slope,
  aspect="xy",
  layout = c(6,2),
  panel = function(x, y) {
    panel.grid(v=2)
    panel.xyplot(x, y)
  },
  xlab="Distance (degrees)",
  ylab="Absolute Error (%)"),
  position=c(0,.375,1,1), more=T)

print(plot(shingle(slope$percent),
  sub = list("Figure 4.36",cex=.8),
  scales=list(x=list(cex=.7),y=list(cex=.7)),
  xlab = "Percent (%)"),
  position=c(0,.1,1,.425))
invisible()
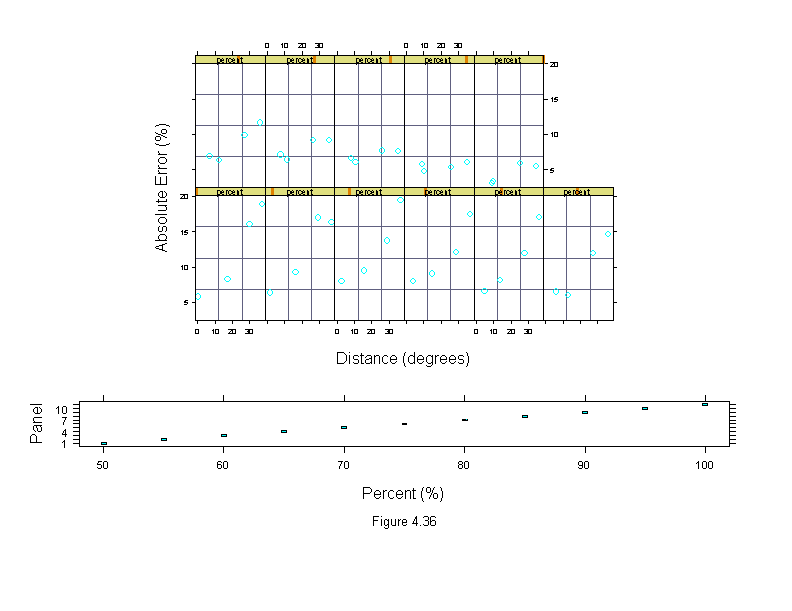
Figure 4.37
print(xyplot(error ~ resolution | percent,
  data = slope,
  aspect="xy",
  layout=c(6,2),
  panel = function(x, y) {
    panel.grid(h=2, v=2)
    panel.xyplot(x, y)
  },
  xlab="Resolution (degrees)",
  ylab="Absolute Error (%)"),
  position=c(0,.375,1,1), more=T)

print(plot(shingle(slope$percent),
  sub = list("Figure 4.37",cex=.8),
  scales=list(x=list(cex=.7),y=list(cex=.7)),
  xlab = "Percent (%)"),
  position=c(0,.25,1,.55))
invisible()
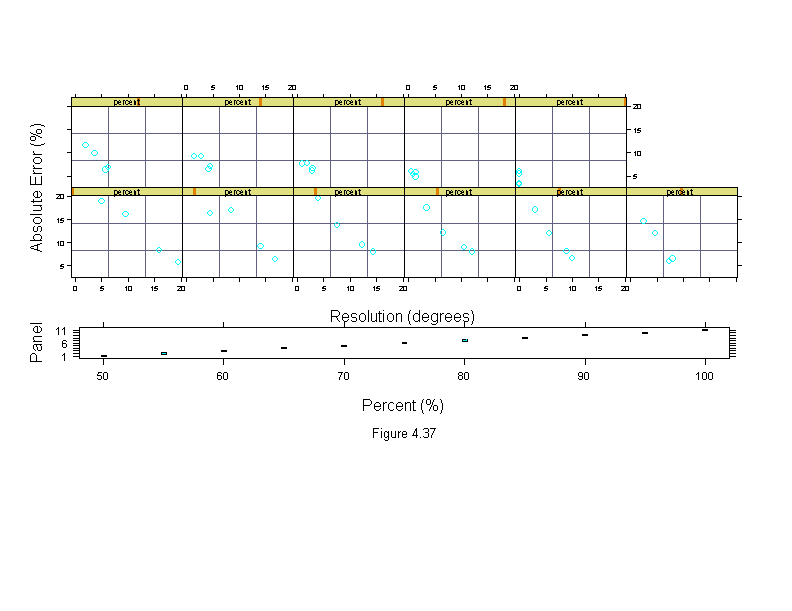
Figure 4.38
attach(slope)
Resolution <- equal.count(resolution,8,1/4)
ans <- xyplot(error ~ percent | Resolution,
  aspect=1,
  layout=c(4,2),
  panel = function(x, y) {
    panel.grid()
    panel.xyplot(x, y)
  },
  xlab="Percent (%)",
  ylab="Absolute Error (%)")
detach()
print(ans, position=c(0,.3,1,1), more=T)

print(plot(equal.count(slope$resolution,8,1/4),
  sub = list("Figure 4.38",cex=.8),
  scales=list(x=list(cex=.7),y=list(cex=.7)),
  xlab = "Resolution (degrees)"),
  position=c(0,.1,1,.45))
invisible()
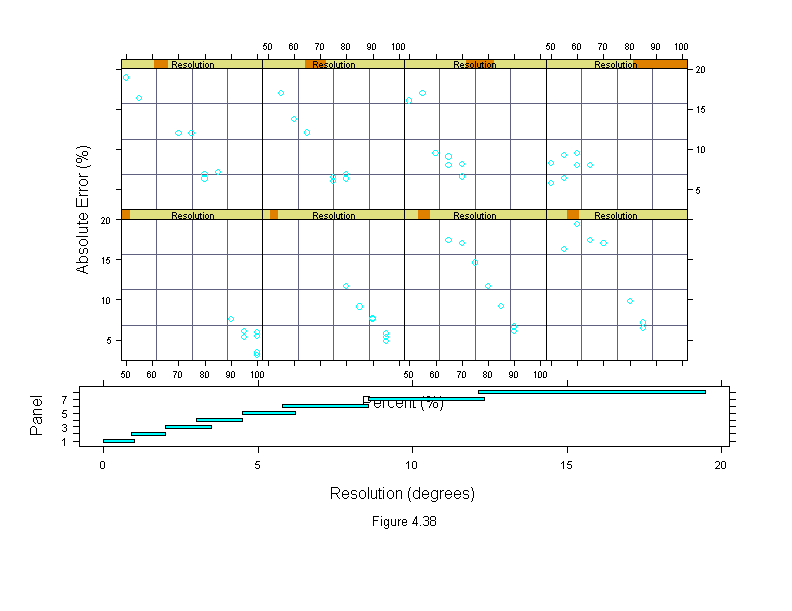
Figure 4.39
attach(slope)
wt <- rep(1,length(error))
for(i in 1:10){
  slo.lm <- lm(error~percent+resolution,weights=wt)
  wt <- wt.bisquare(slo.lm$res/median(abs(slo.lm$res)),c=6)
ans <- xyplot(residuals(slo.lm) ~ percent,
  panel = function(x, y) {
    panel.xyplot(x, y)
    panel.loess(x, y, span=1/2)
    panel.abline(h=0)
  },
  aspect=1,
  sub = list("Figure 4.39",cex=.8),
  xlab="Percent (%)",
  ylab="Residual Absolute Error (%)")
detach()
ans
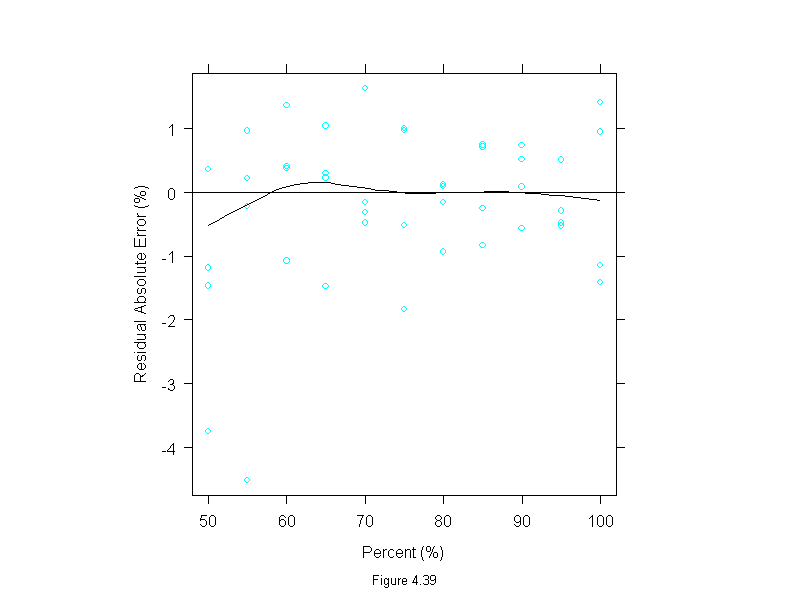
Figure 4.40
attach(slope)
wt <- rep(1,length(error))
for(i in 1:10){
  slo.lm <- lm(error~percent+resolution,weights=wt)
  wt <- wt.bisquare(slo.lm$res/median(abs(slo.lm$res)),c=6)
ans <- xyplot(residuals(slo.lm) ~ resolution,
  panel = function(x, y) {
    panel.xyplot(x, y)
    panel.loess(x, y, span=1/2)
    panel.abline(h=0)
  },
  aspect=1,
  sub = list("Figure 4.40",cex=.8),
  xlab="Resolution (degrees)",
  ylab="Residual Absolute Error (%)")
detach()
ans
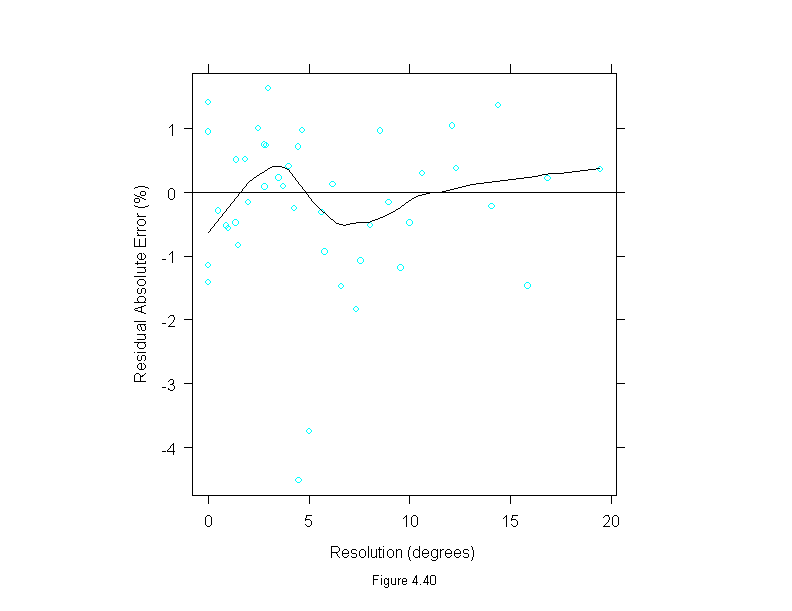
Figure 4.41
attach(slope)
wt <- rep(1,length(error))  for(i in 1:10){
  slo.lm <- lm(error~percent+resolution,weights=wt)
  wt <- wt.bisquare(slo.lm$res/median(abs(slo.lm$res)),c=6)
ans <- rfs(slo.lm,
  sub = list("Figure 4.41",cex=.8),
  aspect = 1.5,    ylab="Residual Absolute Error (%)")
detach()
ans
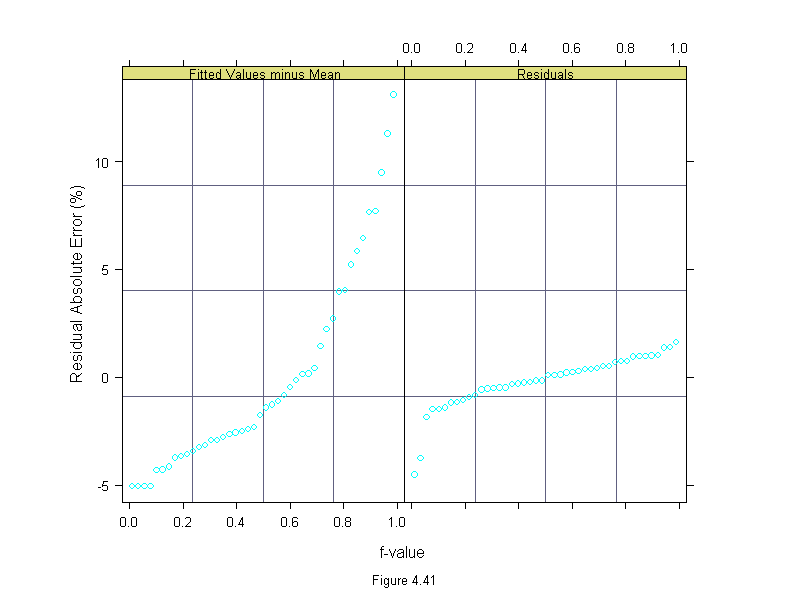
Figure 4.42
attach(slope)
grid <- expand.grid(d = seq(0, 45, length = 46),
        p = seq(min(percent), max(percent), length = 11))
p <- grid$p
d <- grid$d
a <- 52.7 - 1.19 * asin(cos(d*pi/90) * (100 - p) / (100 + p)) * 180/pi - 0.48 * p
Percent <- p
ans <- xyplot(a ~ d | Percent,
  aspect="xy",
  layout=c(4,3),
  panel = function(x, y) {
    panel.grid(v=2)
    panel.xyplot(x, y, type = "l")
  },
  xlab="Distance (degrees)",
  ylab="Absolute Error (%)")
detach()
print(ans, position=c(0,.375,1,1), more=T)

print(plot(shingle(seq(min(slope$percent),
  max(slope$percent), length = 11)),
  sub = list("Figure 4.42",cex=.8),
  scales=list(x=list(cex=.7),y=list(cex=.7)),
  xlab = "Percent (%)"),
  position=c(0,.1,1,.425))
invisible()
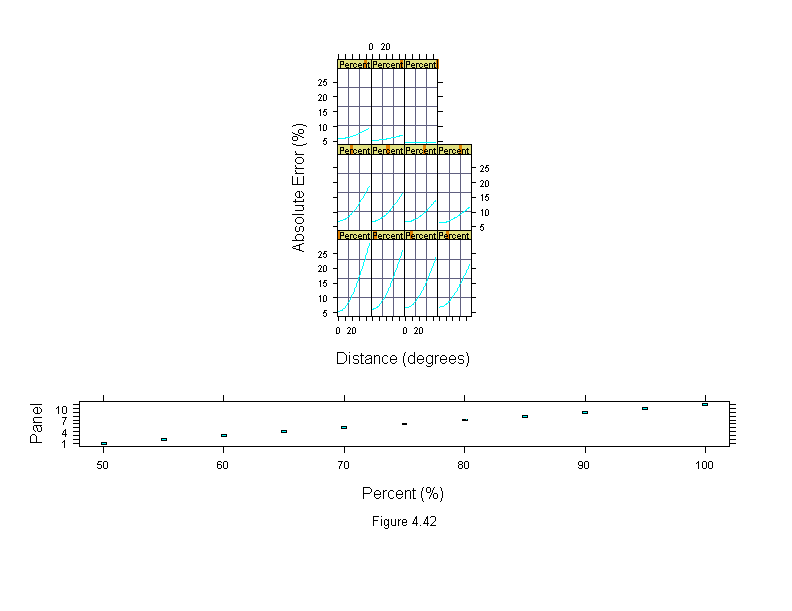
Figure 4.43
attach(galaxy)
set.seed(19)
ans <- xyplot(jitter(north.south, .3) ~ jitter(east.west, .3),
  aspect = diff(range(north.south))/diff(range(east.west)),
  sub = list("Figure 4.43",cex=.8),
  xlab = "Jittered East-West Coordinate (arcsec)",
  ylab = "Jittered South-North Coordinate (arcsec)")
detach()
ans
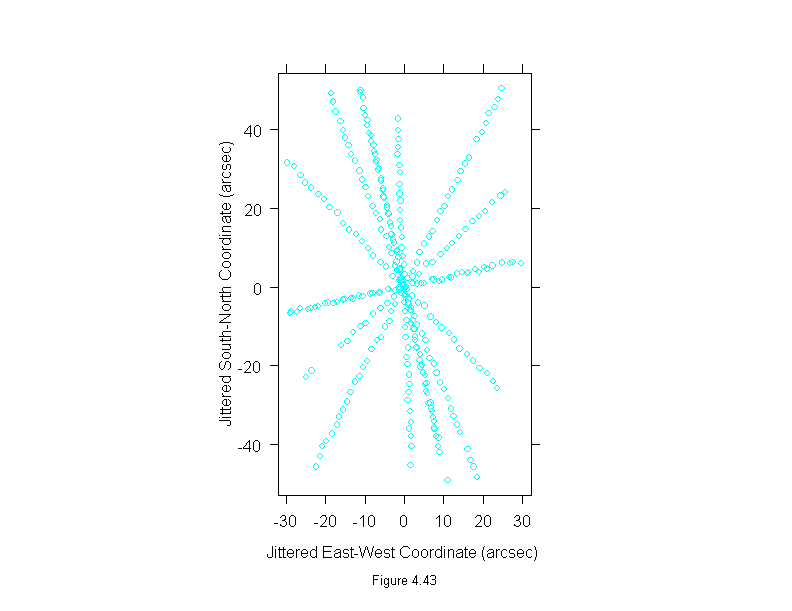
Figure 4.44
attach(galaxy)
set.seed(19)
Velocity <- equal.count(velocity,15,1/4)
ans <- xyplot(jitter(north.south, .3) ~ jitter(east.west, .3) | Velocity,
  layout = c(5, 3),
  panel = function(x, y) {
    panel.grid(v=2)
    panel.xyplot(x, y)
  },
  aspect=diff(range(north.south))/diff(range(east.west)),
  xlab = "Jittered East-West Coordinate (arcsec)",
  ylab = "Jittered South-North Coordinate (arcsec)")
detach()
print(ans, position=c(0,.375,1,1), more=T)

print(plot(equal.count(galaxy$velocity,15,1/4),
  sub = list("Figure 4.44",cex=.8),
  scales=list(x=list(cex=.7),y=list(cex=.7)),
  xlab = "Velocity (km/sec)"),
  position=c(0,.1,1,.425))
invisible()
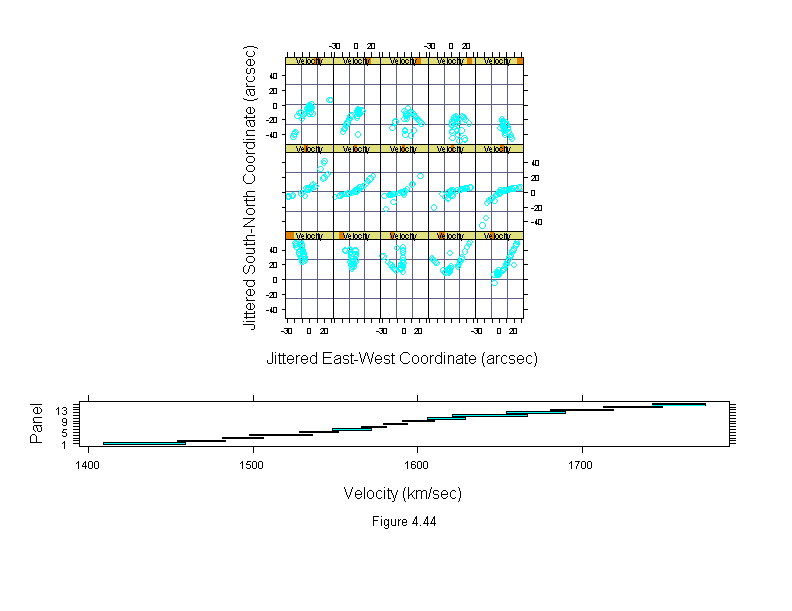
Figure 4.45
ans <- xyplot(velocity ~ radial.position | angle,
  data = galaxy,
  prepanel=function(x,y) prepanel.loess(x, y, span = 1/2, degree = 2),
  panel = function(x, y) {
    panel.grid()
    panel.xyplot(x, y)
    panel.loess(x, y, span = 1/2, degree = 2)
  },
  layout = c(4, 2),
  xlab = "Radial Position (arcsec)",
  ylab = "Velocity (km/sec)")
print(ans, position=c(0,.375,1,1), more=T)

print(plot(shingle(galaxy$angle),
  sub = list("Figure 4.45",cex=.8),
  scales=list(x=list(cex=.7),y=list(cex=.7)),
  xlab = "Slit (degrees)"),
  position=c(0,.1,1,.425))
invisible()
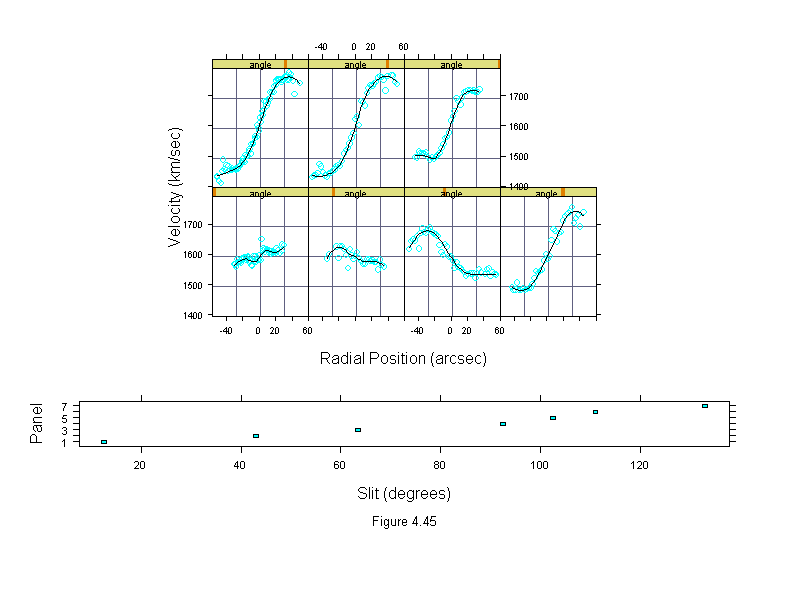
Figure 4.46
attach(galaxy)
gal.m <- loess(velocity ~ east.west * north.south,
         span = 0.25, degree = 2, normalize = F, family = "symmetric")
slitfit <- fitted.values(gal.m)
ans <- xyplot(velocity ~ radial.position | angle,
  prepanel = substitute(function(x, y, subscripts){
    k <- order(x)
    list(dx = diff(x[k]), dy = diff(slitfit[subscripts][k]))
  }),
  panel = substitute(function(x, y, subscripts) {
    add.line <- trellis.par.get("add.line")
    panel.grid()
    panel.xyplot(x,y)
     k <- order(x)
    lines(x[k], slitfit[subscripts][k],
      lwd = add.line$lwd, lty = add.line$lty, col = add.line$col)
  }),
  layout = c(4, 2),
  xlab = "Radial Position (arcsec)",
  ylab = "Velocity (km/sec)")
detach()
print(ans, position=c(0,.375,1,1), more=T)

print(plot(shingle(galaxy$angle),
  sub = list("Figure 4.46",cex=.8),
  scales=list(x=list(cex=.7),y=list(cex=.7)),
  xlab = "Slit (degrees)"),
  position=c(0,.1,1,.425))
invisible()
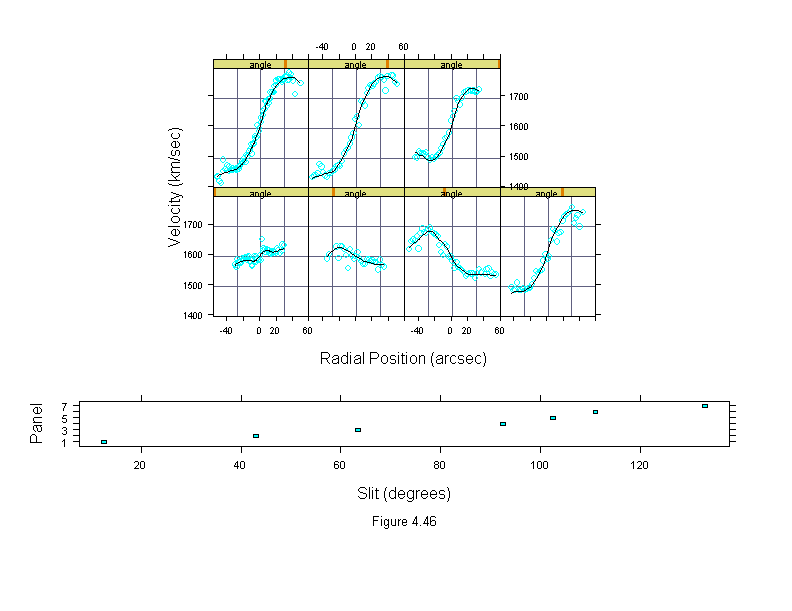
Figure 4.47
ans <- xyplot(loess(velocity ~ east.west * north.south,
  span = 0.25,
  degree = 2, normalize = F,
  family = "symmetric")$residuals ~ radial.position | angle,
  data = galaxy,
  panel = function(x, y) {
    panel.grid()
    panel.xyplot(x, y)
    panel.loess(x, y, span = 1, degree = 2)
    panel.abline(h=0)
  },
  aspect=1,
  layout = c(4, 2),
  xlab = "Radial Position (arcsec)",
  ylab = "Residual Velocity (km/sec)")
print(ans, position=c(0,.375,1,1), more=T)

print(plot(shingle(galaxy$angle),
  sub = list("Figure 4.47",cex=.8),
  scales=list(x=list(cex=.7),y=list(cex=.7)),
  xlab = "Slit (degrees)"),
  position=c(0,.1,1,.425))
invisible()
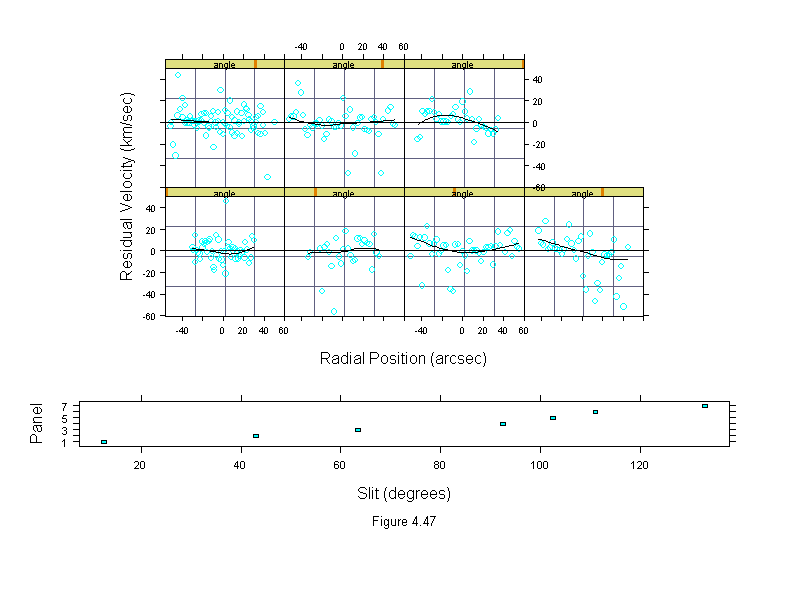
Figure 4.48
qqmath(~loess(velocity ~ east.west * north.south, data = galaxy,
    span = 0.25, degree = 2, normalize = F,
    family = "symmetric")$residuals,
  prepanel = prepanel.qqmathline,
  panel = function(x, y) {
    panel.qqmathline(y, distribution = qnorm)
    panel.qqmath(x, y)
  },
  aspect=1,
  sub = list("Figure 4.48",cex=.8),
  xlab="Unit Normal Quantile",
  ylab="Residual Velocity (km/sec)")
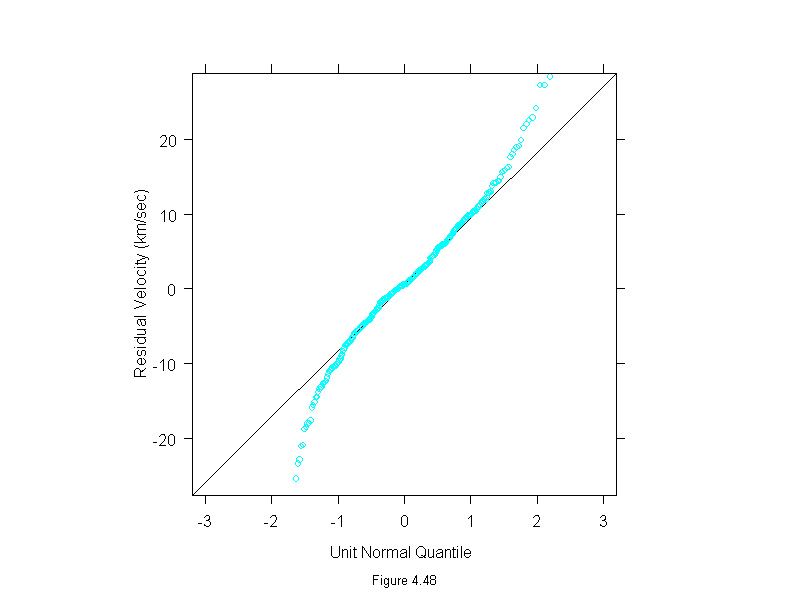
Figure 4.49
rfs(loess(velocity ~ east.west * north.south, data = galaxy,
    span = 0.25, degree = 2, normalize = F,
    family = "symmetric"),
  sub = list("Figure 4.49",cex=.8),
  aspect=1.5,
  ylab="Velocity (km/sec)")
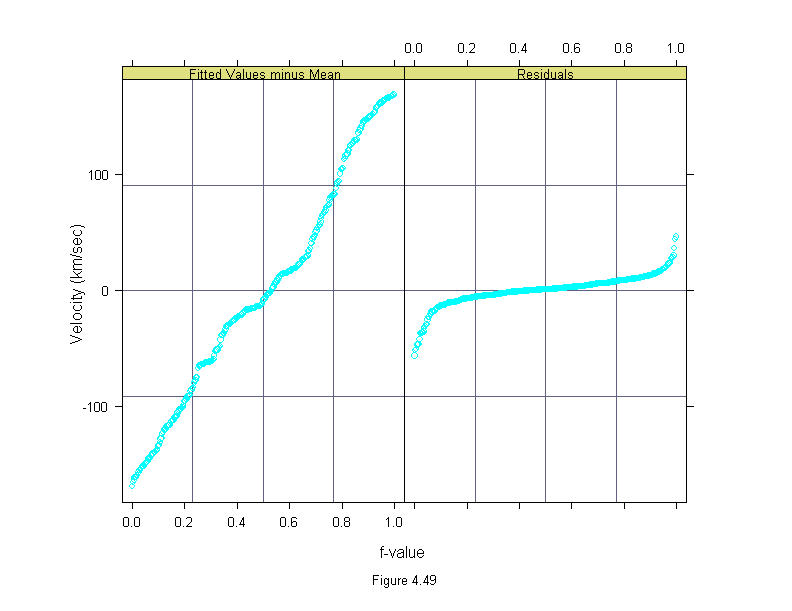
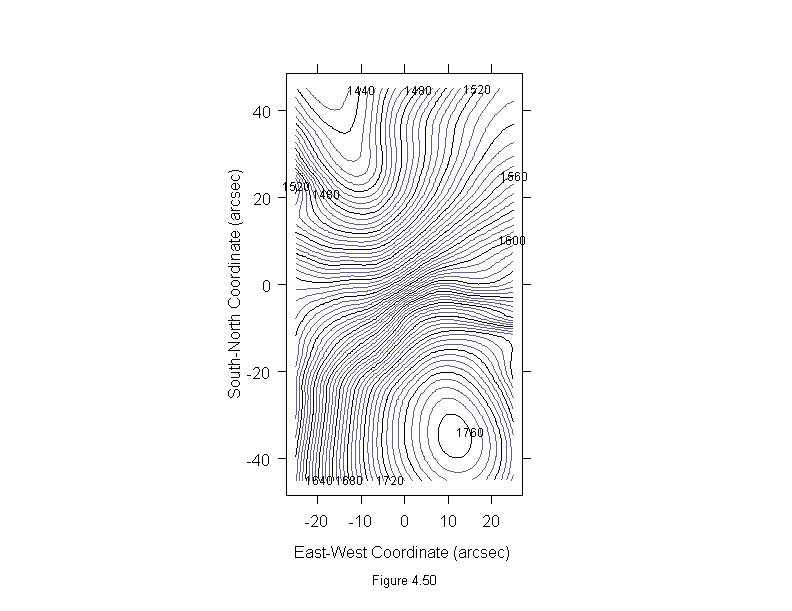
Figure 4.50
attach(galaxy)
galaxy.marginal <- list(east.west = seq(-25, 25,length=101),
  north.south = seq(-45, 45,length=181))
galaxy.grid <- expand.grid(galaxy.marginal)
gal.m <- loess(velocity ~ east.west * north.south, span = 0.25,
  degree = 2, normalize = F, family = "symmetric")
galaxy.fit <- predict(gal.m, galaxy.grid)
x <- range(galaxy.marginal$east.west)
y <- range(galaxy.marginal$north.south)
ans <- contourplot(galaxy.fit ~ galaxy.grid$east.west * galaxy.grid$north.south,
  at = seq(1435, 1755, by = 5),
  panel = function(..., at) {
    ref <- trellis.par.get("reference.line")
    panel.contourplot(..., labels = F,
      at = at,
      lty = ref$lty, lwd = ref$lwd, col = ref$col)
    panel.contourplot(..., labels = F,
      at = seq(1460, 1740, by = 40))
    panel.contourplot(...,
      at = seq(1440, 1760, by = 40))
  },
  aspect = diff(range(y))/diff(range(x)),
  sub = list("Figure 4.50",cex=.8),
  xlab = "East-West Coordinate (arcsec)",
  ylab = "South-North Coordinate (arcsec)")
detach()
ans
# no figs for 4.51 4.54
Figure 4.55
attach(galaxy)
galaxy.marginal <- list(east.west = seq(-25, 25,length=101),
  north.south = seq(-45, 45,length=181))
galaxy.grid <- expand.grid(galaxy.marginal)
gal.m <- loess(velocity ~ east.west * north.south, span = 0.25,
  degree = 2, normalize = F, family = "symmetric")
galaxy.fit <- predict(gal.m, galaxy.grid)
n.level <- 48
given <- seq(min(galaxy.fit),max(galaxy.fit),length=n.level+1)
Velocity <- shingle(as.vector(galaxy.fit),
  cbind(given[-(n.level+1)],given[-1]))
ans <- xyplot(galaxy.grid$n ~ galaxy.grid$e | Velocity,
  layout = c(8, 6),
  panel = function(x, y) {
    panel.grid(v=2, h=2)
    panel.xyplot(x, y, pch = ".")
  },
  aspect=diff(range(galaxy.grid$n))/diff(range(galaxy.grid$e)),
  xlab = "East-West Coordinate (arcsec)",
  ylab = "South-North Coordinate (arcsec)")
detach()
print(ans, position=c(0,.3,1,1), more=T)

attach(galaxy)
galaxy.marginal <- list(east.west = seq(-25, 25,length=101),
  north.south = seq(-45, 45,length=181))
galaxy.grid <- expand.grid(galaxy.marginal)
gal.m <- loess(velocity ~ east.west * north.south, span = 0.25,
  degree = 2, normalize = F, family = "symmetric")
galaxy.fit <- predict(gal.m, galaxy.grid)
given <- seq(min(galaxy.fit),max(galaxy.fit),length=49)
ans <- plot(shingle(as.vector(galaxy.fit),
  intervals = cbind(given[-length(given)], given[-1])),
  cex=.7,
  scales=list(x=list(cex=.7),y=list(at=seq(10,40,10),cex=.7)),
  sub = list("Figure 4.55",cex=.8),
  ylab="",
  xlab = "Velocity (km/sec)")
detach()
print(ans, position=c(0,.05,1,.35))
invisible()
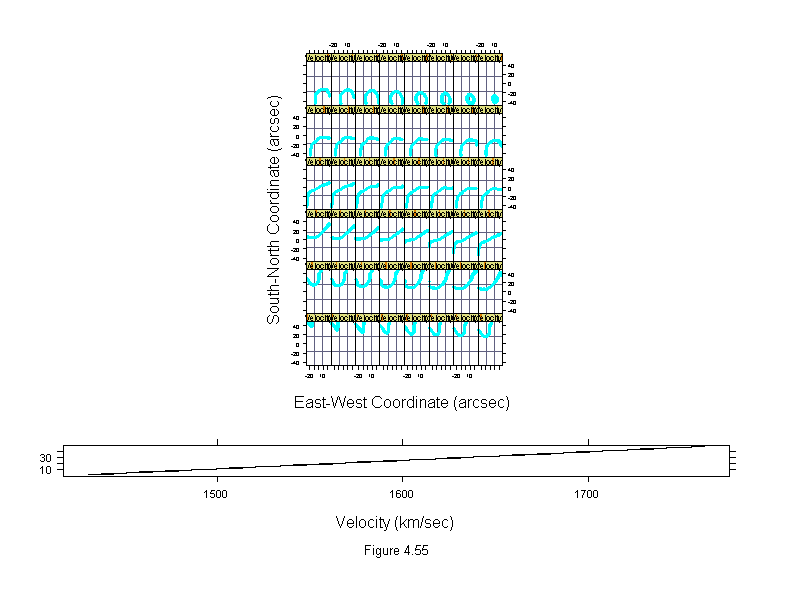
Figure 4.56
attach(galaxy)
galaxy.marginal <- list(east.west = seq(-25, 25, by = 2),
  north.south = seq(-45, 45, by = 2))
galaxy.grid <- expand.grid(galaxy.marginal)
galaxy.fit <- predict(loess(velocity ~ east.west * north.south,
  span = 0.25, degree = 2, normalize = F, family = "symmetric"),
  galaxy.grid)
ar <- diff(range(galaxy.grid$north.south))/diff(range(galaxy.grid$east.west))
ans <- wireframe(galaxy.fit ~ galaxy.grid$east.west * galaxy.grid$north.south,
  screen = list(z = 30, x = -60, y = 0),
  aspect = c(ar, 1.3),
  sub = list("Figure 4.56",cex=.8),
  xlab = "East-West",
  ylab = "South-North",
  zlab = "Velocity")
detach()
ans
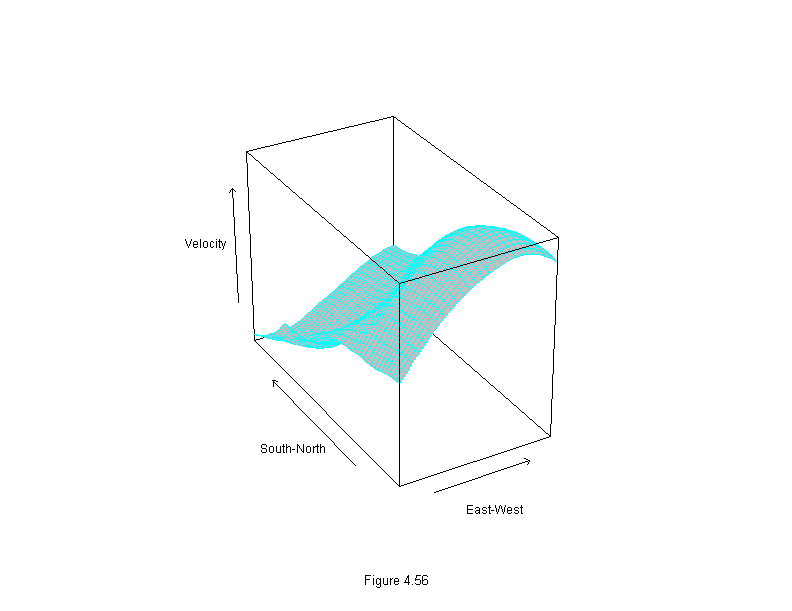
Figure 4.57
attach(galaxy)
galaxy.marginal <- list(east.west = seq(-25, 25, by = 2),
  north.south = seq(-45, 45, by = 2))
galaxy.grid <- expand.grid(galaxy.marginal)
galaxy.fit <- predict(loess(velocity ~ east.west * north.south,
  span = 0.25, degree = 2, normalize = F, family = "symmetric"),
  galaxy.grid)
ar <- diff(range(galaxy.grid$north.south))/diff(range(galaxy.grid$east.west))
ans <- wireframe(galaxy.fit ~ galaxy.grid$east.west * galaxy.grid$north.south,
  screen = list(z = 120, x = -60, y = 0),
  aspect = c(ar, 1.3),
  sub = list("Figure 4.57",cex=.8),
  xlab = "East-West",
  ylab = "South-North",
  zlab = "Velocity")
detach()
ans
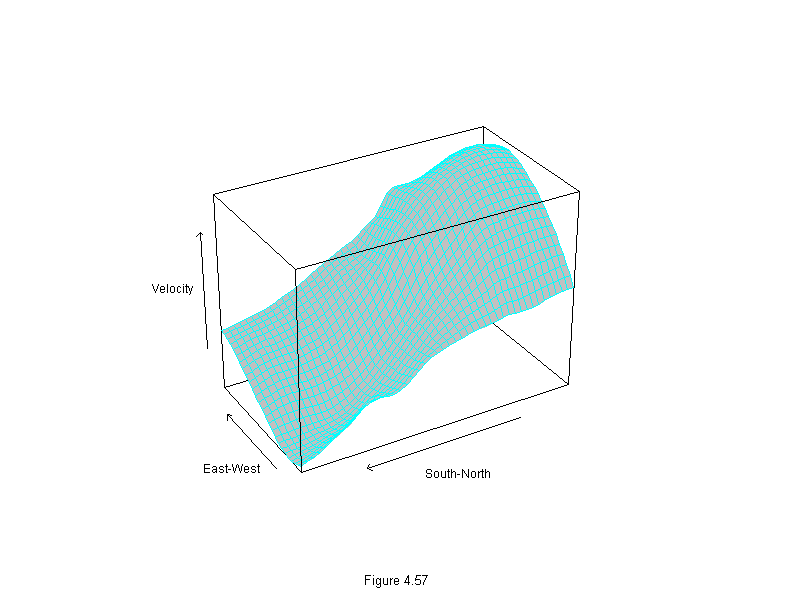
Figure 4.58
attach(galaxy)
galaxy.marginal <- list(east.west = seq(-25, 25, by = 2),
  north.south = seq(-45, 45, by = 2))
galaxy.grid <- expand.grid(galaxy.marginal)
galaxy.fit <- predict(loess(velocity ~ east.west * north.south,
  span = 0.25, degree = 2, normalize = F, family = "symmetric"),
  galaxy.grid)
ar <- diff(range(galaxy.grid$north.south))/diff(range(galaxy.grid$east.west))
ans <- wireframe(galaxy.fit ~ galaxy.grid$east.west * galaxy.grid$north.south,
  screen = list(z = 210, x = -60, y = 0),
  aspect = c(ar, 1.3),
  sub = list("Figure 4.58",cex=.8),
  xlab = "East-West",
  ylab = "South-North",
  zlab = "Velocity")
detach()
ans
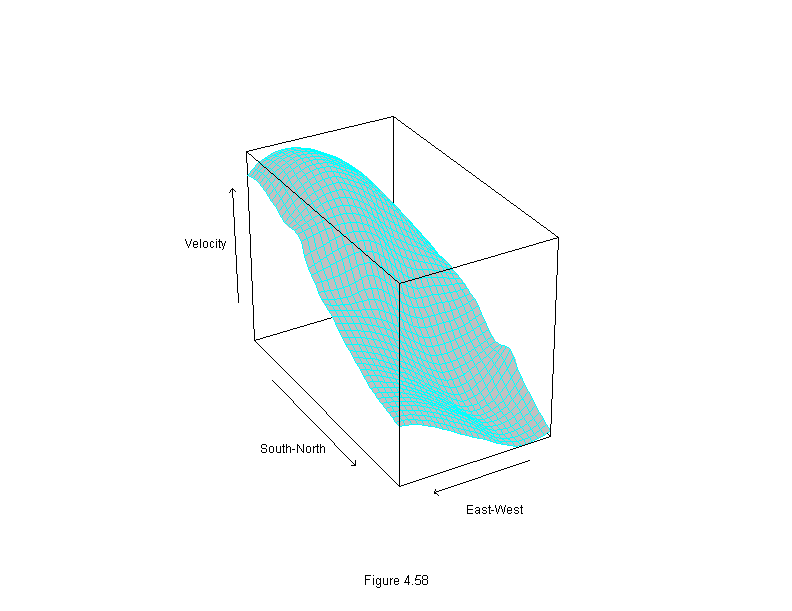
Figure 4.59
attach(galaxy)
galaxy.marginal <- list(east.west = seq(-25, 25, by = 2),
  north.south = seq(-45, 45, by = 2))
galaxy.grid <- expand.grid(galaxy.marginal)
galaxy.fit <- predict(loess(velocity ~ east.west * north.south,
  span = 0.25, degree = 2, normalize = F, family = "symmetric"),
  galaxy.grid)
ar <- diff(range(galaxy.grid$north.south))/diff(range(galaxy.grid$east.west))
ans <- wireframe(galaxy.fit ~ galaxy.grid$east.west * galaxy.grid$north.south,
  screen = list(z = 300, x = -60, y = 0),
  aspect = c(ar, 1.3),
  sub = list("Figure 4.59",cex=.8),
  xlab = "East-West",
  ylab = "South-North",
  zlab = "Velocity")
detach()
ans
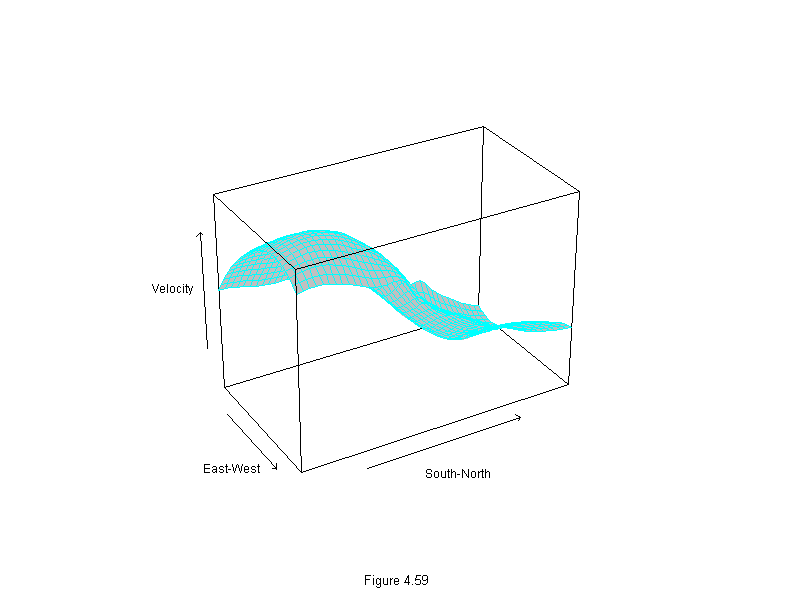
Figure 4.60
attach(ethanol)
eth.m <- loess(NOx ~ C * E, span = 1/3, degree = 2,
  parametric = "C", drop.square = "C", family = "s")
eth.marginal <- list(C = seq(min(C), max(C), length = 6),
  E = seq(min(E), max(E), length = 25))
eth.grid <- expand.grid(eth.marginal)
eth.fit <- predict(eth.m, eth.grid)
ans <- wireframe(eth.fit ~ eth.grid$C * eth.grid$E,
  screen = list(z = 94, x = -95, y = 0),
  distance = .3,
  sub = list("Figure 4.60",cex=.8),
  xlab = "C",    ylab = "E",
  zlab = "NOx")
detach()
ans
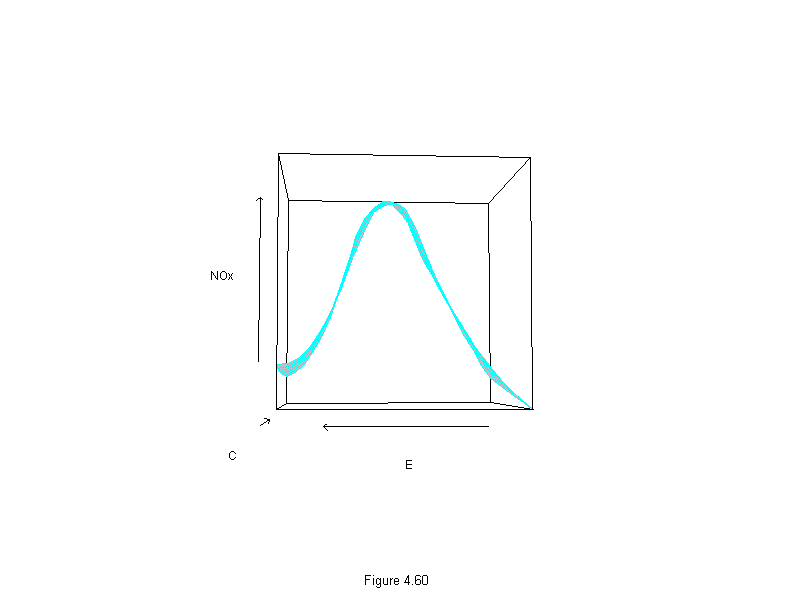
Figure 4.61
attach(ethanol)
eth.m <- loess(NOx ~ C * E, span = 1/3, degree = 2, parametric = "C",
  drop.square = "C", family="s")
eth.marginal <- list(C = seq(min(C), max(C), length = 25),
  E = seq(min(E), max(E), length = 25))
eth.grid <- expand.grid(eth.marginal)
eth.fit <- predict(eth.m, eth.grid)
ans <- wireframe(eth.fit ~ eth.grid$C * eth.grid$E,
  screen = list(z = 30, x = -60, y=0),
  distance = .3,
  sub = list("Figure 4.61",cex=.8),
  xlab = "C",
  ylab = "E",
  zlab = "NOx")
detach()
ans
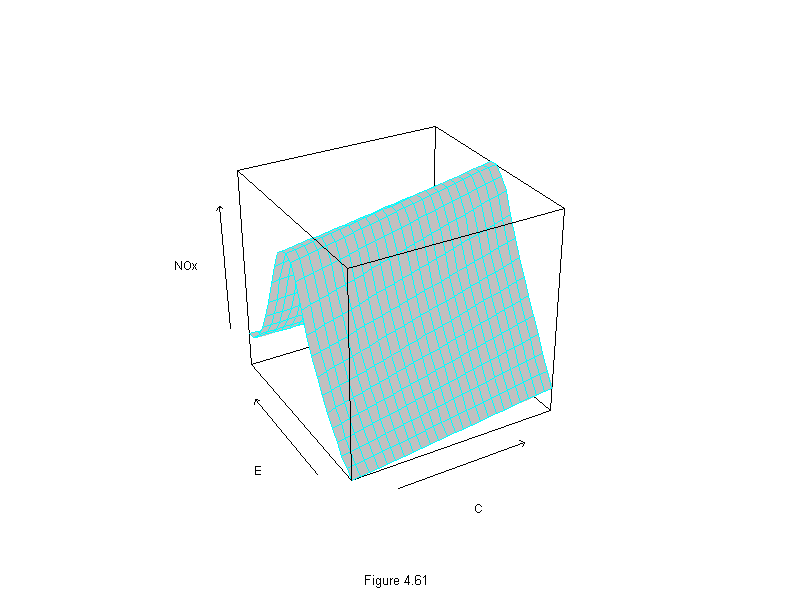
Figure 4.62
attach(ethanol)
eth.m <- loess(NOx ~ C * E, span = 1/3, degree = 2,
  parametric = "C", drop.square = "C",family="s")
eth.marginal <- list(C = seq(min(C), max(C), length = 6),
  E = seq(min(E), max(E), length = 25))
eth.grid <- expand.grid(eth.marginal)
eth.fit <- predict(eth.m, eth.grid)
ans <- wireframe(eth.fit ~ eth.grid$C * eth.grid$E,
  screen = list(z = 90, x = -90, y = 0),
  perspective = F,
  distance =.3,
  sub = list("Figure 4.62",cex=.8),
  xlab = "",
  ylab = "E",
  zlab = "NOx")
detach()
ans
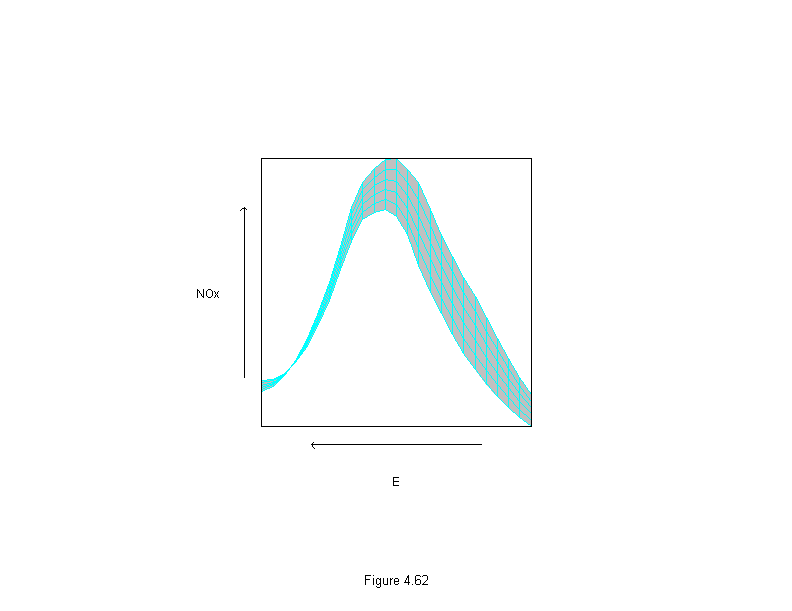
Figure 4.63
ar <- diff(range(galaxy$north.south))/diff(range(galaxy$east.west))
left <- cloud(velocity ~ east.west*north.south,
  data = galaxy,
  screen=list(z=123, x=-60, y=0),
  perspective=F,
  aspect = c(ar, 1.6),
  sub = list("Figure 4.63",cex=.8),
  scales=list(cex=.7),
  xlab=list("East-West",cex=.4),
  ylab=list("South-North",cex=.4),
  zlab=list("Velocity",cex=.4))
right <- update(left, screen=list(z=117,x =-60, y=0), sub="")
print(left, split = c(1,1,2,1), more = T)
print(right, split = c(2,1,2,1))
invisible()
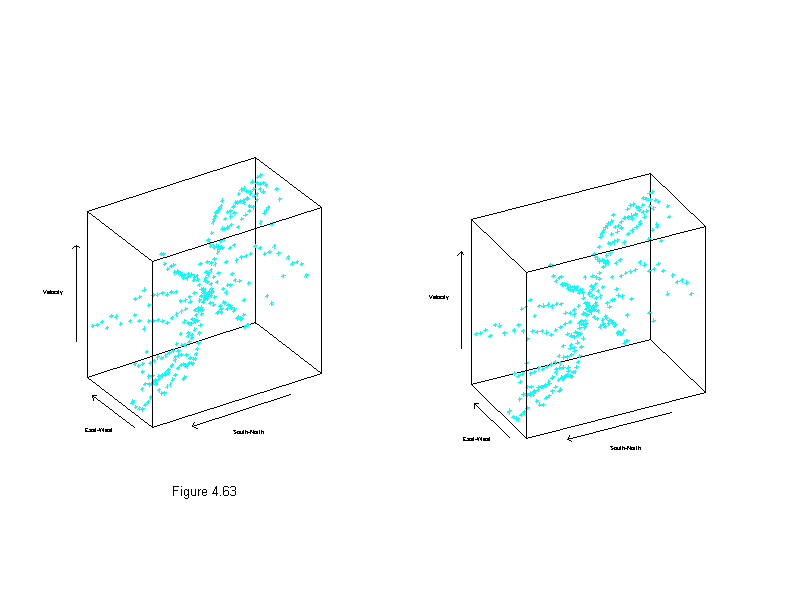
Figure 4.64
xyplot(northing ~ easting,
  data = soil,
  panel = function(x, y) points(x, y, pch=".", cex=.75),
  aspect=diff(range(soil$northing))/diff(range(soil$easting)),
  ylab= "Northing (km)",
  sub = list("Figure 4.64",cex=.8),
  xlab= "Easting (km)")
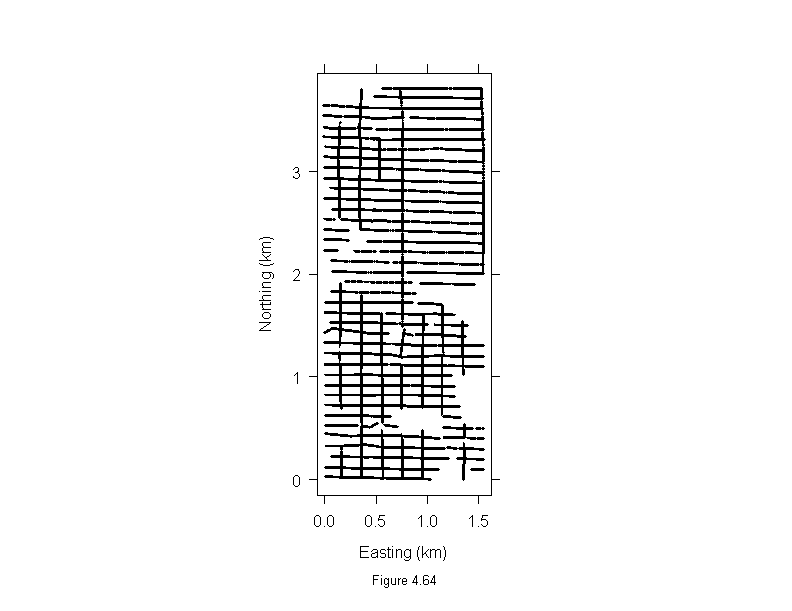
Figure 4.65
xyplot(northing ~ resistivity | track,
  data = soil,
  subset = is.ns,
  layout=c(4,2),
  panel=function(x, y) {
    panel.grid(v=2)
    points(x, y, pch=".", cex=1.25)
  },
  sub = list("Figure 4.65",cex=.8),
  xlab="Resistivity (ohm-cm)",
  ylab="Northing (km)")
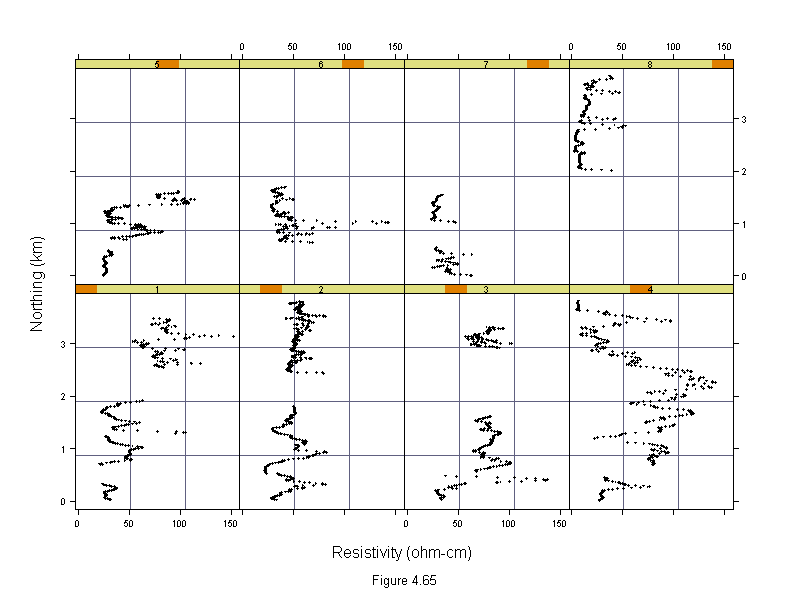
Figure 4.66
xyplot(resistivity[!is.ns] ~ easting[!is.ns] | track[!is.ns],
  data = soil,
  layout=c(4,10),
  panel=function(x, y) {
    panel.grid(h=2)
    points(x, y, pch=".", cex=1.25)
  },
  sub = list("Figure 4.66",cex=.8),
  xlab="Easting (km)",
  ylab="Resistivity (ohm-cm)")
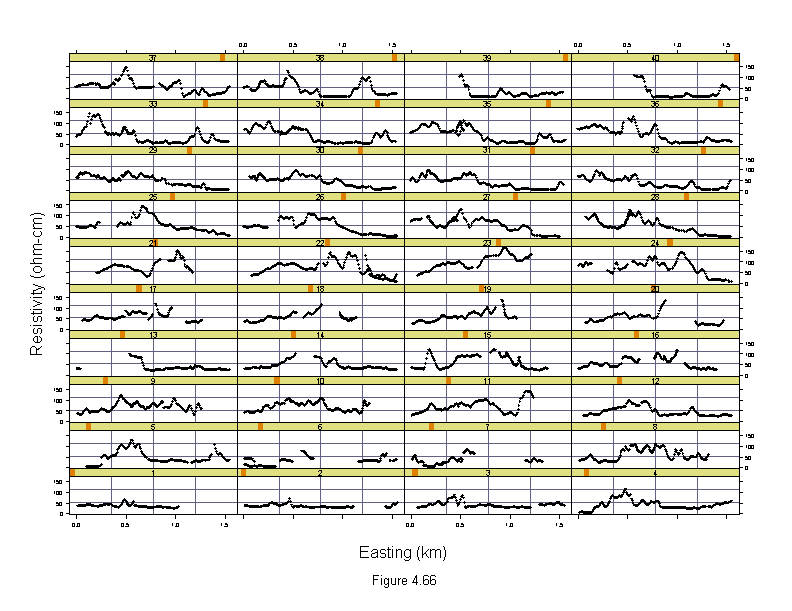
Figure 4.67
attach(soil)
soi.marginal <- list(easting = seq(.15, 1.410, by = .015),
  northing = seq(.150, 3.645, by = .015))
soi.grid <-  expand.grid(soi.marginal)
soi.m <- loess(resistivity~easting*northing, span = 0.25, degree = 2)
soi.fit <- predict(soi.m, soi.grid)
given <- seq(min(soi.fit), max(soi.fit), length = 29)
Resistivity <- shingle(as.vector(soi.fit), cbind(given[-29],given[-1]))
ans <- xyplot(soi.grid$n ~ soi.grid$e | Resistivity,
  layout = c(7, 4),
  panel = function(x, y) {
    panel.grid(v=2)
    points(x, y, pch = ".")
  },
  aspect=diff(range(soi.grid$n))/diff(range(soi.grid$e)),
  xlab = "Easting (km)",
  ylab = "Northing (km)")
detach()
print(ans, position=c(0,.25,1,1), more=T)


attach(soil)
soi.marginal <- list(easting = seq(.15, 1.410, by = .015),
  northing = seq(.150, 3.645, by = .015))
soi.grid <-  expand.grid(soi.marginal)
soi.m <- loess(resistivity~easting*northing, span = 0.25, degree = 2)
soi.fit <- predict(soi.m, soi.grid)
given <- seq(min(soi.fit), max(soi.fit), length = 29)
ans <- plot(shingle(as.vector(soi.fit),
  intervals = cbind(given[-29],given[-1])),
  cex=.7,
  sub = list("Figure 4.67", cex = 0.8),
  scales=list(x=list(cex=.7),
    y=list(cex=.7,at=seq(5,25,5))),
  xlab = "Resistivity (ohm-cm)")
detach()
print(ans, position=c(0,.05,1,.3))

invisible()
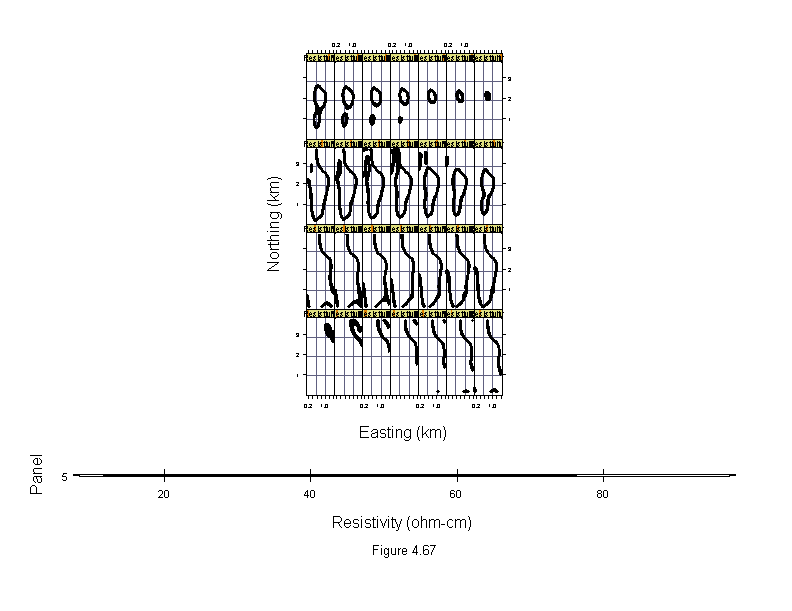
Figure 4.68
attach(soil)
soi.grid <- expand.grid(easting = seq(.15, 1.410, by = .015),
  northing = seq(.150, 3.645, by = .015))
soi.fit <- predict(loess(resistivity~easting*northing, span = 0.25,
  degree = 2), soi.grid)
ans <- levelplot(soi.fit ~ soi.grid$easting * soi.grid$northing,
  cuts = 9,
  colorkey = list(labels = list(at = c(20, 40, 60, 80)),
    width = 5),
  aspect=diff(range(soi.grid$n))/diff(range(soi.grid$e)),
  sub = list("Figure 4.68",cex=.8),
  xlab = "Easting (km)",
  ylab = "Northing (km)")
detach()
ans
