Figure 5.1
env <- environmental
env$ozone <- env$ozone ^ (1/3)
splom(~env,
  sub = list("Figure 5.1",cex=.8),
  varnames = c("Cube RootnOzonen(cube root ppb)",
    "SolarnRadiationn(langleys)",
    "Temperaturen(Degrees Fahrenheit)",
    "Wind Speedn(mph)"))
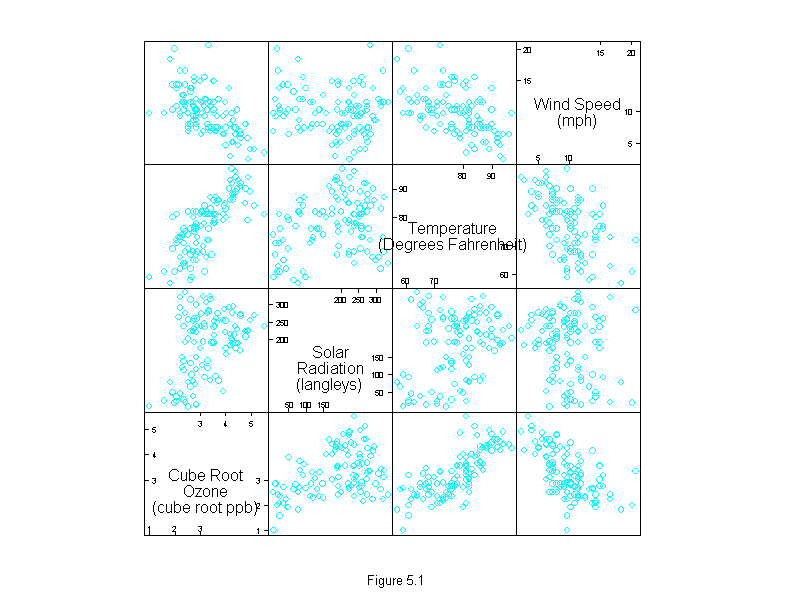
Figure 5.2
attach(environmental)
Temperature <- equal.count(temperature, 4, 1/2)
Wind <- equal.count(wind, 4, 1/2)
ans <- xyplot((environmental$ozone^(1/3)) ~ radiation | Temperature * Wind,
  prepanel = function(x, y)
    prepanel.loess(x, y, span = 1),
  panel = function(x, y){
    panel.grid(h = 2, v = 2)
    panel.xyplot(x, y, cex = 1)
    panel.loess(x, y, span = 1)
  },
  aspect = 2,
  sub = list("Figure 5.2",cex=.8),
  xlab = "Solar Radiation (langleys)",
  ylab = "Cube Root Ozone (cube root ppb)")
detach()
ans
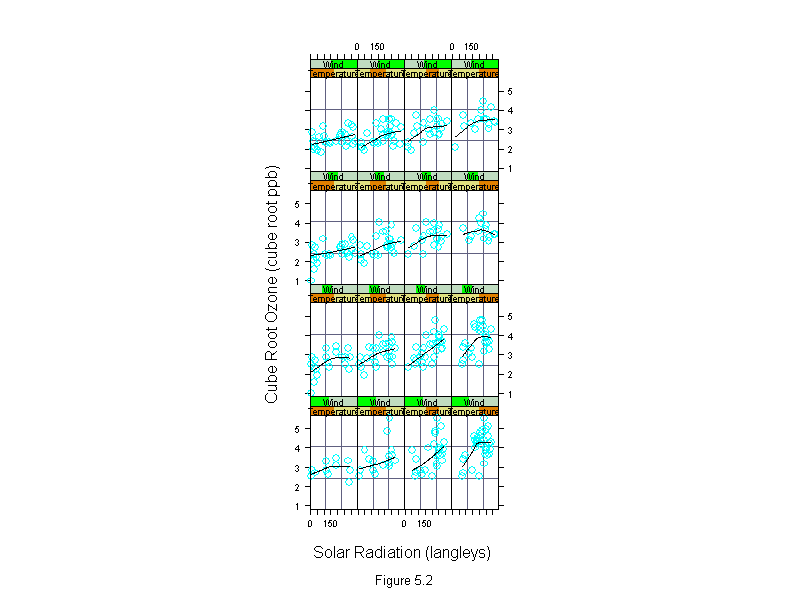
Figure 5.3
attach(environmental)
Temperature <- equal.count(temperature, 4, 1/2)
Wind <- equal.count(wind, 4, 1/2)
ans <- xyplot((environmental$ozone^(1/3)) ~ radiation | Temperature * Wind,
  prepanel = function(x, y)
    prepanel.loess(x, y, span = 1),
  panel = function(x, y){
    panel.grid(h = 2, v = 2)
    panel.xyplot(x, y, cex = 1)
    panel.loess(x, y, span = 1)
  },
  aspect = 2,
  sub = list("Figure 5.3",cex=.8),
  xlab = "Solar Radiation (langleys)",
  ylab = "Cube Root Ozone (cube root ppb)")
detach()
ans
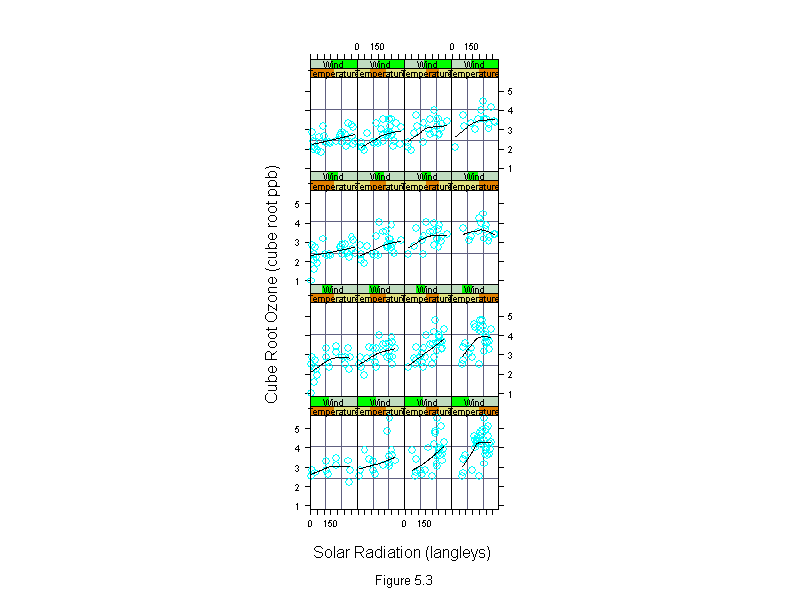
Figure 5.4
attach(environmental)
Radiation <- equal.count(radiation, 4, 1/2)
Temperature <- equal.count(temperature, 4, 1/2)
ans <- xyplot((environmental$ozone^(1/3)) ~ wind | Radiation * Temperature,
  prepanel = function(x, y)
    prepanel.loess(x, y, span = 1),
  panel = function(x, y){
    panel.grid(h = 2, v = 2)
    panel.xyplot(x, y, cex = 1)
    panel.loess(x, y, span = 1)
  },
  aspect = 2,
  sub = list("Figure 5.4",cex=.8),
  xlab = "Wind Speed (mph)",
  ylab = "Cube Root Ozone (cube root ppb)")
detach()
ans
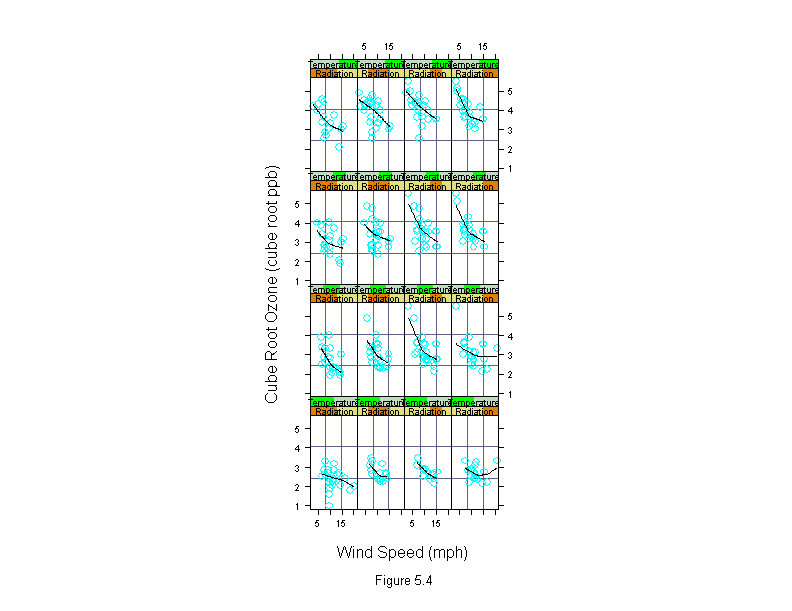
Figure 5.5
attach(environmental)
Radiation <- equal.count(radiation, 4, 1/2)
Wind <- equal.count(wind, 4, 1/2)
ans <- xyplot((environmental$ozone^(1/3)) ~ temperature | Radiation * Wind,
  prepanel = function(x, y)
    prepanel.loess(x, y, span = 1),
  panel = function(x, y) {
    panel.grid(h = 2, v = 2)
    panel.xyplot(x, y, cex = 1)
    panel.loess(x, y, span = 1)
  },
  aspect = 2,
  sub = list("Figure 5.5",cex=.8),
  xlab = "Temperature (degrees F)",
  ylab = "Cube Root Ozone (cube root ppb)")
detach()
ans
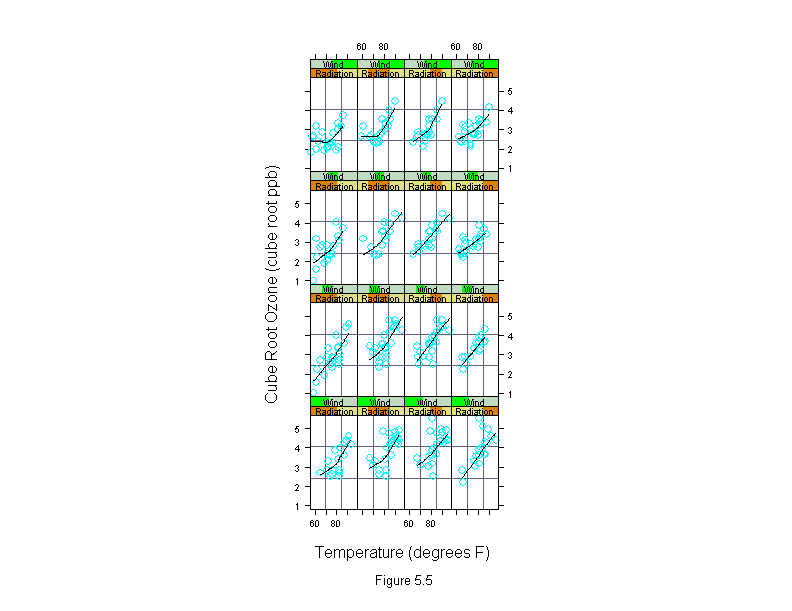
Figure 5.6
attach(environmental)
env.tm <- loess((environmental$ozone^(1/3))~wind,span=2/3,degree=1,surface="d")
ws <- seq(min(wind),35,length=50)
env.wfit <- predict(env.tm, ws)
xlim <- range(ws)
ylim <- range(env.wfit, environmental$ozone^(1/3))
ans <- xyplot((environmental$ozone^(1/3)) ~ wind,
  prepanel = substitute(function(x, y)
    list(dx = diff(ws), dy = diff(env.wfit))),
  panel = substitute(function(x,y){
    add.line <- trellis.par.get("add.line")
    panel.xyplot(x,y)
    lines(ws, env.wfit, lwd = add.line$lwd,
      lty = add.line$lty, col = add.line$col)
  }),
  xlim = xlim,
  ylim = ylim,
  aspect = 1,
  sub = list("Figure 5.6",cex=.8),
  xlab="Wind Speed (mph)",
  ylab="Cube Root Ozone (cube root ppb)")
detach()
ans
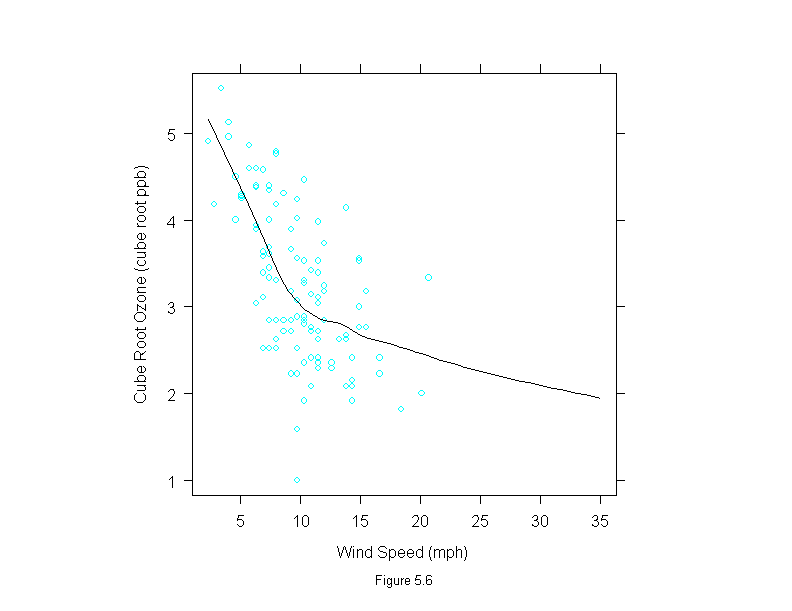
Figure 5.7
left <- xyplot(environmental$r ~ environmental$t,
  aspect=1,
  panel=function(x,y){
    panel.xyplot(x,y)
    panel.abline(h=range(y))
  },
  sub = list("Figure 5.7",cex=.8),
  xlab = "Temperature (degrees F)",
  ylab = "Radiation (langleys)")
right <- xyplot(environmental$t ~ environmental$w,
  aspect=1,
  panel=function(x,y){
    panel.xyplot(x,y)
    panel.abline(v=c(4,16),h=c(61,92))
    panel.abline(112,-2)
    panel.abline(87,-2)
  },
  sub = list("Figure 5.7",cex=.8),
  xlab = "Wind Speed (mph)",
  ylab = "Temperature (degrees F)")
print(left, split = c(1,1,2,1), more = T)
print(right, split = c(2,1,2,1))
invisible()
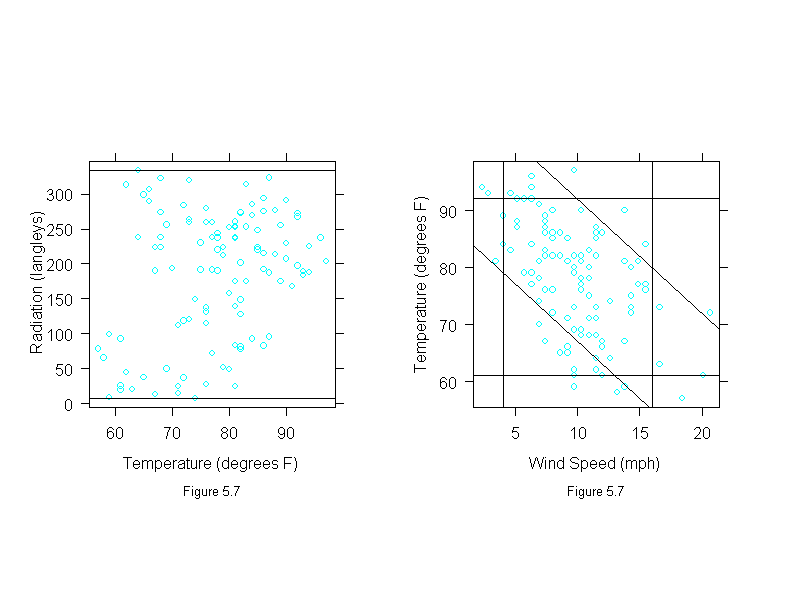
Figure 5.8
attach(environmental)
ind <- (wind > 4)&
  (wind < 16)&
  (temperature < (-2 * wind + 112))&
  (temperature > (-2 * wind + 87))&
  (temperature > 61)&
  (temperature < 92)
splom(~environmental[ind, 2:4],
   sub = list("Figure 5.8",cex=.8),
  varnames = c("SolarnRadiationn(langleys)",
    "Temperaturen(Degrees Fahrenheit)",
    "Wind Speedn(mph)"))
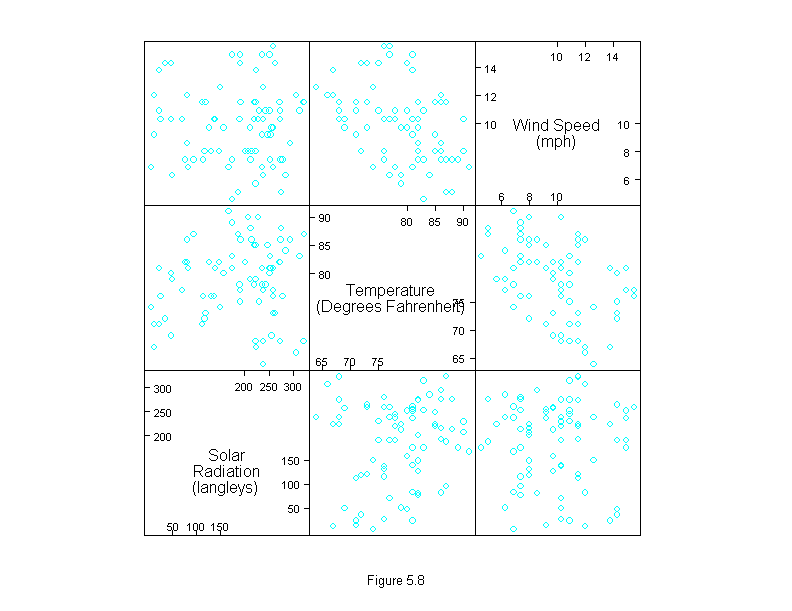
Figure 5.9
attach(environmental)
env.m <- loess((environmental$ozone^(1/3))~radiation*temperature*wind,
  parametric=c("radiation","wind"),
  span = 1,
  degree = 2)
r.marginal <- seq(min(radiation),max(radiation),length=50)
t.marginal <- seq(61,92,length=5)
w.marginal <- seq(4,16,length=5)
twr.marginal <- list(temperature=t.marginal,wind=w.marginal,radiation=r.marginal)
twr.grid <- expand.grid(twr.marginal)
env.fit <- predict(env.m,twr.grid)
ind <- (twr.grid$wind>=4)&
  (twr.grid$wind<=16)&
  (twr.grid$temperature<(-2*twr.grid$wind+112))&
  (twr.grid$temperature>(-2*twr.grid$wind+87))&
  (twr.grid$temperature>=61)&
  (twr.grid$temperature<=92)
env.fit[!ind] <- NA
Temp <- twr.grid$temperature
Wind <- twr.grid$wind
ans <- xyplot(env.fit ~ twr.grid$radiation | Temp * Wind,
  panel = function(x, y)
    if(!all(is.na(y))) {        panel.grid(h = 2, v = 2)
      panel.xyplot(x, y, type = "l")
    },
  aspect = 2,
  sub = list("Figure 5.9",cex=.8),
  xlab = "Solar Radiation (langleys)",
  ylab = "Cube Root Ozone (cube root ppb)")
detach()
ans
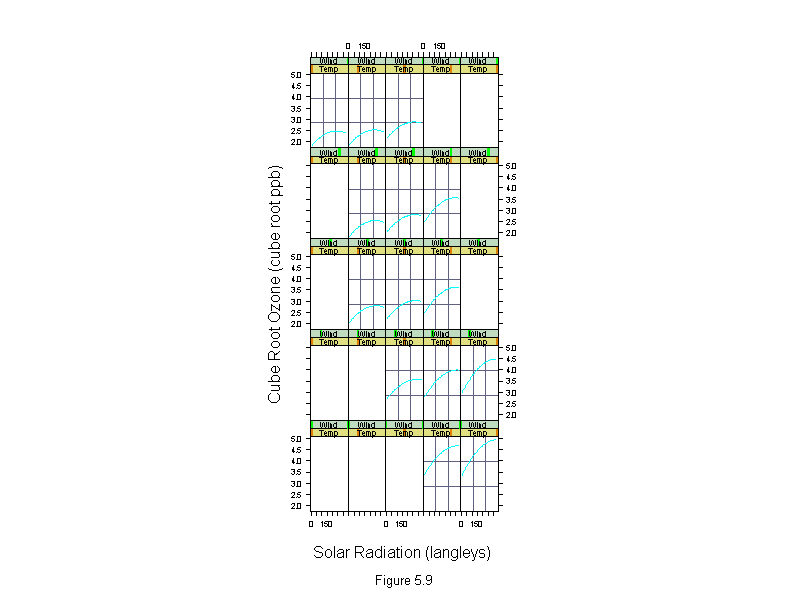
Figure 5.10
attach(environmental)
env.m <- loess((environmental$ozone^(1/3))~radiation*temperature*wind,
  parametric=c("radiation","wind"),
  span = 1,
  degree = 2)
r.marginal <- seq(min(radiation),max(radiation),length=5)
t.marginal <- seq(61,92,length=5)
w.marginal <- seq(4,16,length=50)
twr.marginal <- list(temperature=t.marginal,wind=w.marginal,radiation=r.marginal)
twr.grid <- expand.grid(twr.marginal)
env.fit <- predict(env.m,twr.grid)
ind <- (twr.grid$wind>=4)&
  (twr.grid$wind<=16)&
  (twr.grid$temperature<(-2*twr.grid$wind+112))&
  (twr.grid$temperature>(-2*twr.grid$wind+87))&
  (twr.grid$temperature>=61)&
  (twr.grid$temperature<=92)
env.fit[!ind] <- NA
Radiation <- twr.grid$radiation
Temp <- twr.grid$temperature
ans <- xyplot(env.fit ~ twr.grid$wind | Radiation * Temp,
  panel=function(x, y) {
    panel.grid(h = 2, v = 2)
    panel.xyplot(x, y, type = "l")
  },
  aspect = 2,
  sub = list("Figure 5.10",cex=.8),
  xlab = "Wind Speed (mph)",
  ylab = "Cube Root Ozone (cube root ppb)")
detach()
ans
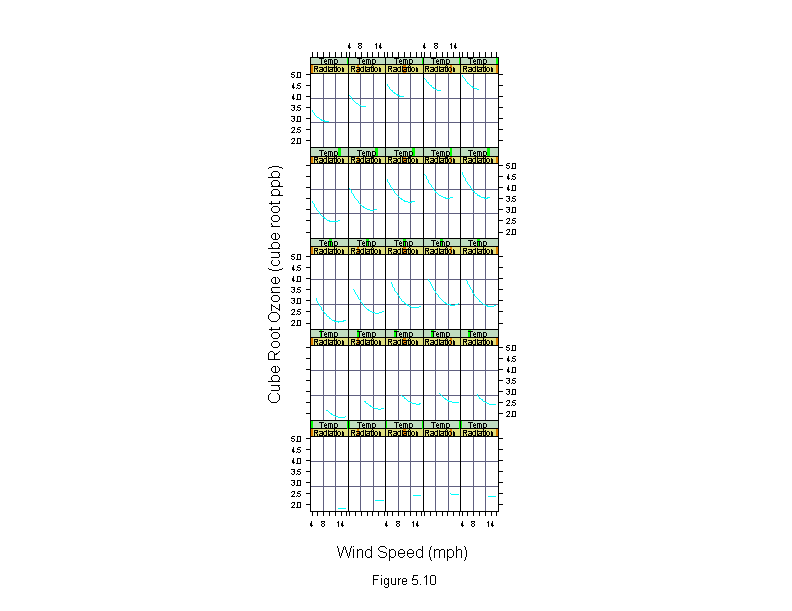
Figure 5.11
attach(environmental)
env.m <- loess((environmental$ozone^(1/3))~wind*radiation*temperature,
  parametric=c("radiation","wind"),
  span = 1,
  degree = 2)
r.marginal <- seq(min(radiation),max(radiation),length=5)
t.marginal <- seq(61,92,length=50)
w.marginal <- seq(4,16,length=5)
#r.marginal <- seq(50,275,length=50)
twr.marginal <- list(temperature=t.marginal,wind=w.marginal,radiation=r.marginal)
twr.grid <- expand.grid(twr.marginal)
env.fit <- predict(env.m,twr.grid)
ind <- (twr.grid$wind>=4)&
  (twr.grid$wind<=16)&
  (twr.grid$temperature<(-2*twr.grid$wind+112))&
  (twr.grid$temperature>(-2*twr.grid$wind+87))&
  (twr.grid$temperature>=61)&
  (twr.grid$temperature<=92)
env.fit[!ind] <- NA
Radiation <- twr.grid$radiation
Wind <- twr.grid$wind
ans <- xyplot(env.fit ~ twr.grid$temperature | Radiation * Wind,
  panel = function(x, y) {
    panel.grid(h = 2, v = 2)
    panel.xyplot(x, y, type = "l")
  },
  aspect = 2,
  sub = list("Figure 5.11",cex=.8),
  xlab = "Temperature (Degrees Fahrenheit)",
  ylab = "Cube Root Ozone (cube root ppb)")
detach()
ans
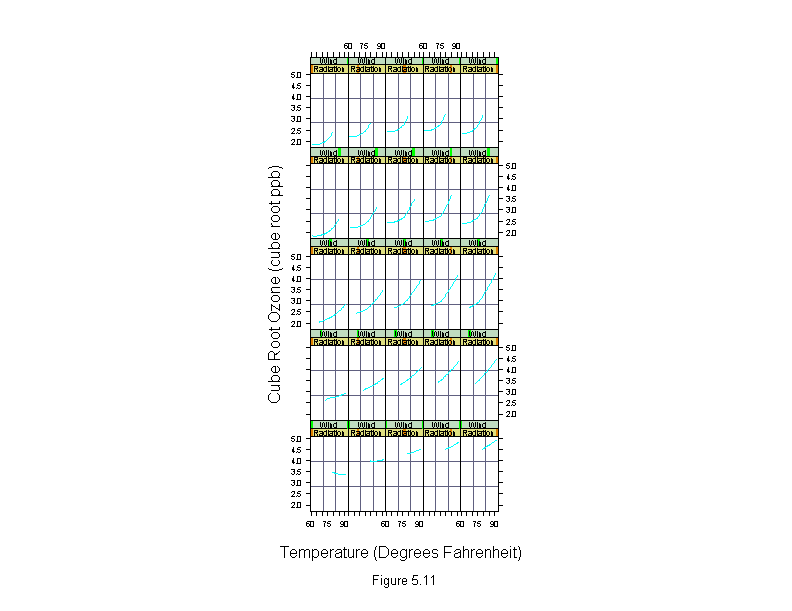
Figure 5.12
attach(environmental)
env.m <- loess(environmental$ozone ~ radiation * temperature * wind,
  parametric = c("radiation", "wind"), span = 1, degree = 2)
ans <- xyplot(sqrt(abs(residuals(env.m))) ~ fitted.values(env.m),
  panel = function(x, y){
    panel.xyplot(x, y)
    panel.loess(x, y, span = 1, family = "g")
  },
  aspect = 1,
  las = 0, # tick labels parallel to axis
  sub = list("Figure 5.12",cex=.8),
  xlab = "Fitted Ozone (ppb)",
  ylab = "Square Root Absolute Residual Ozone (square root ppb)")
detach()
ans
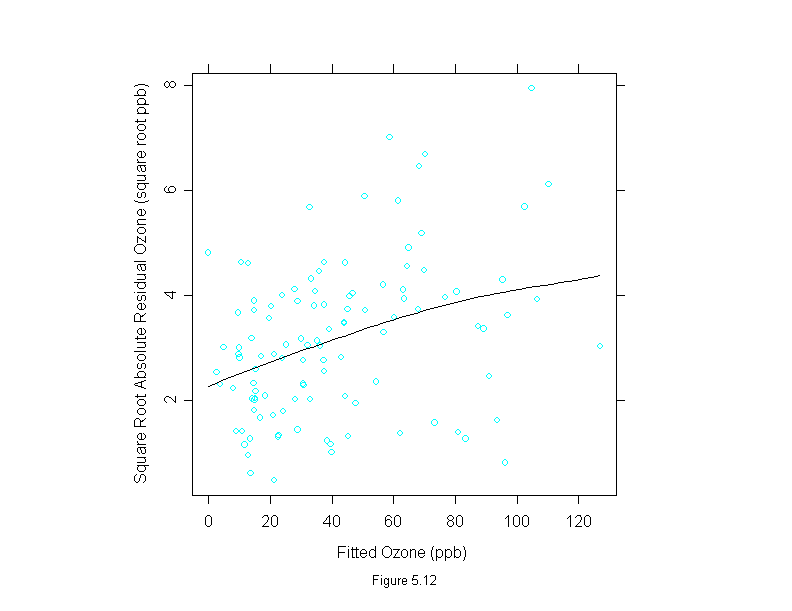
Figure 5.13
attach(environmental)
env.m <- loess(logb(environmental$ozone,2) ~ radiation * temperature * wind,
  parametric = c("radiation", "wind"), span = 1, degree = 2)
ans <- xyplot(sqrt(abs(residuals(env.m))) ~ fitted.values(env.m),
  panel = function(x, y){
    panel.xyplot(x, y)
    panel.loess(x, y, span = 1, family = "g")
  },
  aspect = 1,
  las = 0, # tick labels parallel to axis
  sub = list("Figure 5.13",cex=.8),
  xlab = "Fitted Log Ozone (log 2 ppb)",
  ylab = "Square Root Absolute ResidualnLog Ozone (square root absolute log 2 ppb)")
detach()
ans
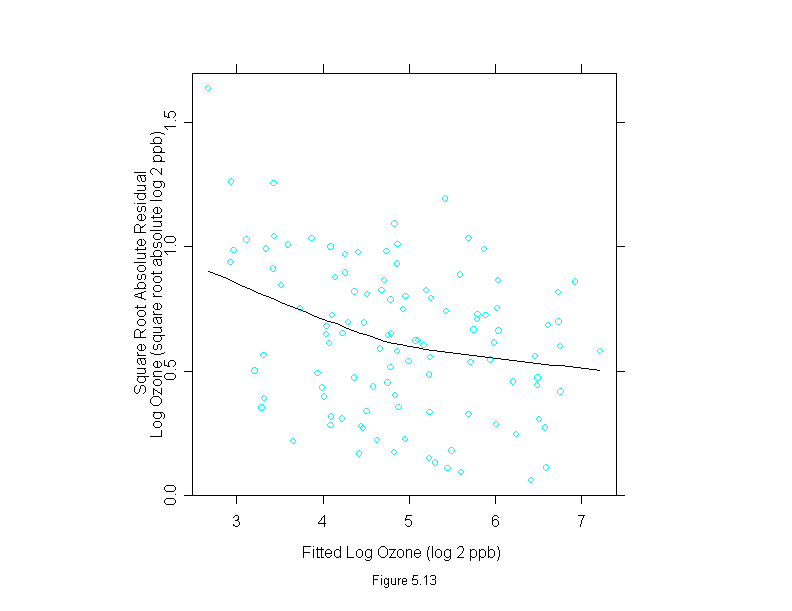
Figure 5.14
attach(environmental)
env.m <- loess((environmental$ozone^(1/3)) ~ radiation * temperature * wind,
  parametric = c("radiation", "wind"), span = 1, degree = 2, surface = "d")
ans <- xyplot(sqrt(abs(residuals(env.m))) ~ fitted.values(env.m),
  panel = function(x, y){
    panel.xyplot(x, y)
    panel.loess(x, y, span = 1, family = "g")
  },
  aspect = 1,
  las = 0, # tick labels parallel to axis
  ylim = c(0, 1.2),
  sub = list("Figure 5.14",cex=.8),
  xlab = "Fitted Cube Root Ozone (cube root ppb)",
  ylab = "Square Root Absolute ResidualnCube Root Ozone (sixth root ppb)")
detach()
ans
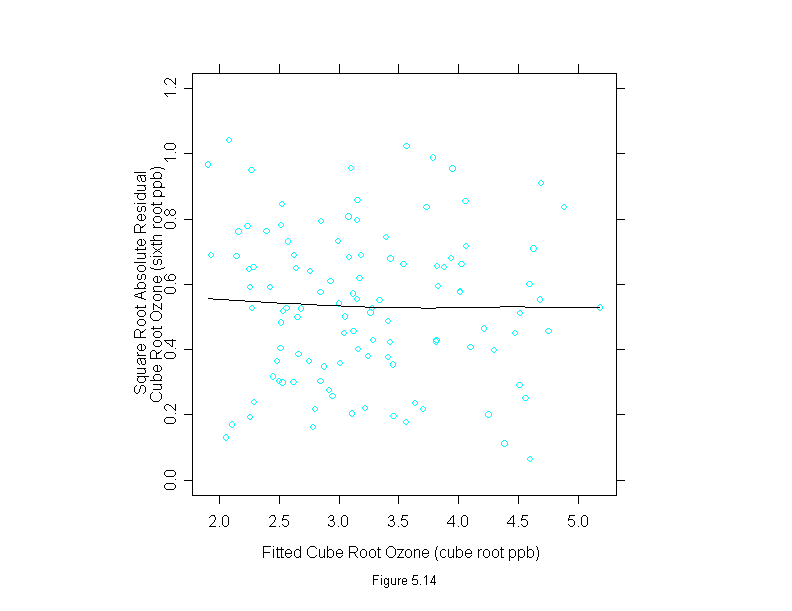
Figure 5.15
qqmath(~loess((ozone^(1/3))~radiation*temperature*wind,
    data=environmental, parametric=c("radiation","wind"),
    span = 1, degree = 2)$residuals,
  prepanel = prepanel.qqmathline,
  panel = function(x, y){
    panel.xyplot(x,y)
    panel.qqmathline(y, distribution = qnorm)
  },
  aspect=1,
  sub = list("Figure 5.15",cex=.8),
  xlab = "Unit Normal Quantile",
  ylab = "Cube Root Ozone (cube root ppb)")
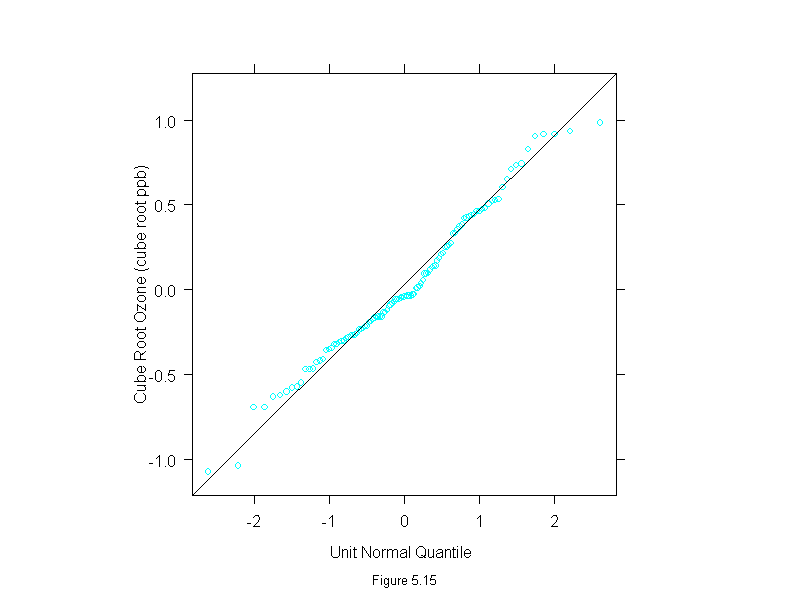
Figure 5.16
rfs(loess((ozone^(1/3))~radiation*temperature*wind,
    data = environmental, parametric=c("radiation","wind"),
    span=1, degree=2),
  panel = function(x, y){
    panel.grid()
    panel.xyplot(x,y)
  },
  sub = list("Figure 5.16",cex=.8),
  aspect=1.5,
  ylab="Cube Root Ozone (cube root ppb)")
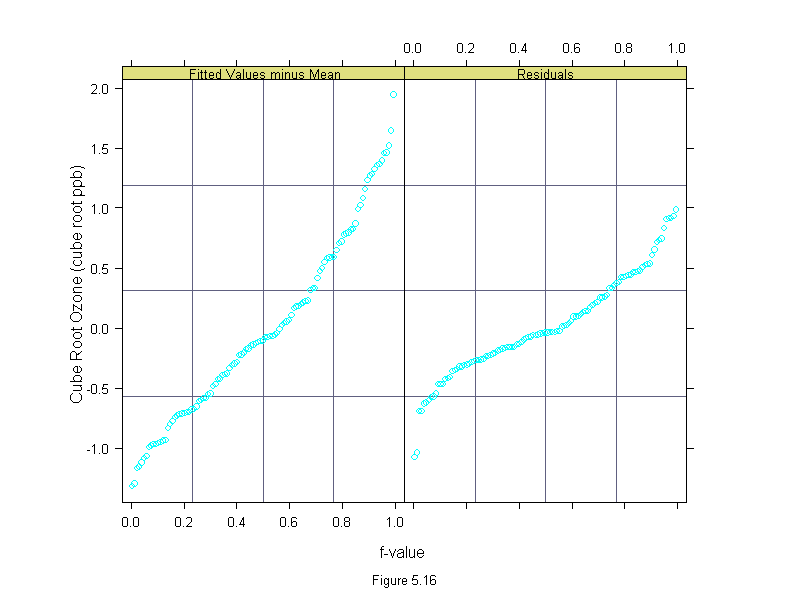
Figure 5.17
weight <- unlist(logb(hamster,2))
organ <- factor(unlist(col(hamster)),labels=names(hamster))
organ <- reorder.factor(organ,weight,median)
bwplot(organ ~ weight,
  aspect = 0.3,
  sub = list("Figure 5.17",cex=.8),
  xlab="Log Organ Weight (Log 2 grams)")
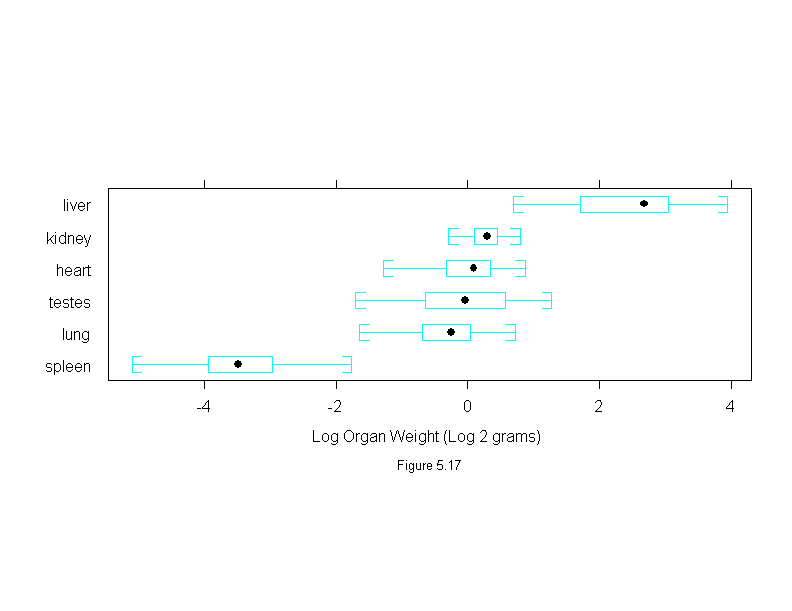
Figure 5.18
splom(~logb(hamster,2),
sub = list("Figure 5.18",cex=.8), varnames = names(hamster))
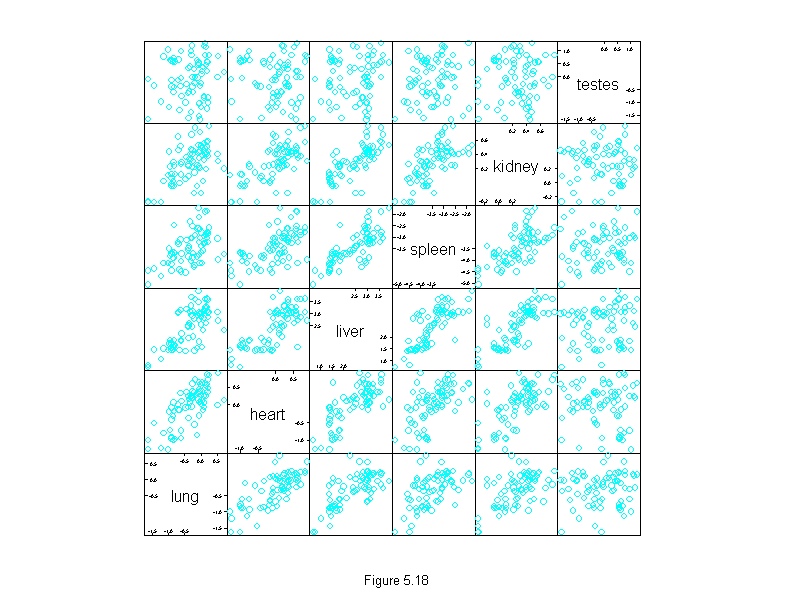
Figure 5.19
splom(~logb(hamster, 2),
  varnames = names(hamster),
  sub = list("Figure 5.19",cex=.8),
  panel = function(x, y){
    plot.symbol <- trellis.par.get("plot.symbol")
    panel.xyplot(x[-38], y[-38])
    points(x[38], y[38], pch = "+", cex = 1.5,
      font = plot.symbol$font, col = plot.symbol$col)
  })
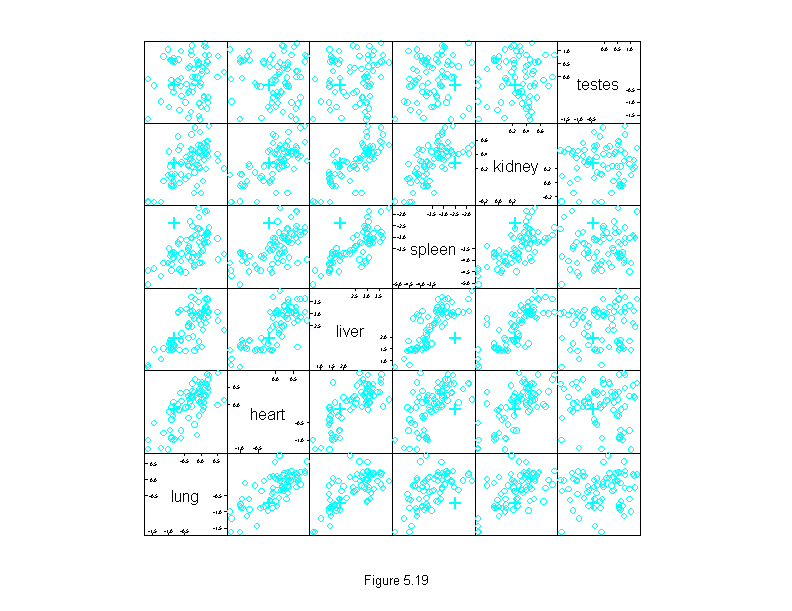
Figure 5.20
new.iris <- array(aperm(iris,c(1,3,2)),c(150,4))
set.seed(19)
for(i in 1:4)
  new.iris[,i] <- jitter(new.iris[,i])
variety <- factor(rep(dimnames(iris)[[3]],rep(50,3)))
n <- length(levels(variety))
splom(~new.iris,
  varnames = c("Sepal Lengthn(cm)", "Sepal Widthn(cm)",
         "Petal Lengthn(cm)", "Petal Widthn(cm)"),
  panel = panel.superpose,
  groups = variety,
  sub = list("Figure 5.20",cex=.8),
  key = list(points = Rows(trellis.par.get("superpose.symbol"), 1:n),
    text = list(paste("Iris", levels(variety))),
    columns = n))
Image omitted
Figure 5.21
set.seed(19)
petal.length <- iris[,3,]
petal.width <- iris[,4,]
variety <- factor(rep(dimnames(iris)[[3]],rep(50,3)))
n <- length(levels(variety))
mea <- (logb(petal.length,2)+logb(petal.width,2))/2
dif <- jitter(logb(petal.length,2)-logb(petal.width,2), 2)
xyplot(dif ~ mea,
  panel = function(...){
    panel.superpose(...)
    panel.abline(v = c(0.4, 1.46))
  },
  groups = variety,
  aspect = 1,
  sub = list("Figure 5.21",cex=.8),
  xlab = "Size (log 2 cm)",
  ylab = "Jittered Elongation (log 2 ratio)",
  key = list(points = Rows(trellis.par.get("superpose.symbol"), 1:n),
    text = list(paste("Iris", levels(variety))),
    columns = n))
Image omitted
