Figure 6.1
attach(livestock)
logcount <- log10(count)
new.country <- reorder.factor(country, logcount, median)
new.livestock <- reorder.factor(livestock.type, logcount, median)
ans <- dotplot(new.country ~ logcount | new.livestock,
  sub = list("Figure 6.1",cex=.8),
  xlab = "Log 10 Number of Livestock",
  layout=c(3,2))
detach()
ans
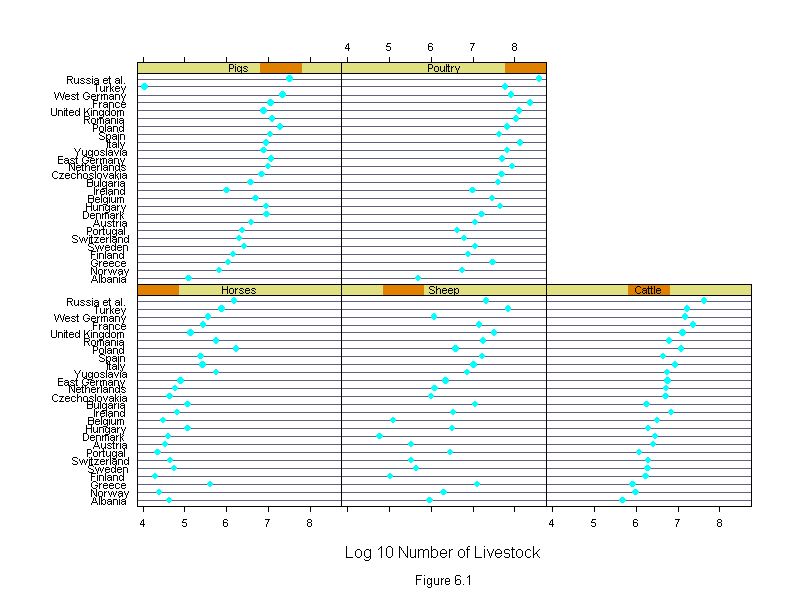
Figure 6.2
attach(livestock)
logcount <- log10(count)
new.country <- reorder.factor(country, logcount, median)
new.livestock <- reorder.factor(livestock.type, logcount, median)
ans <- dotplot(new.livestock ~ logcount | new.country,
  sub = list("Figure 6.2",cex=.8),
  xlab = "Log 10 Number of Livestock",
  layout=c(4,7),
  aspect=1/2)
detach()
ans
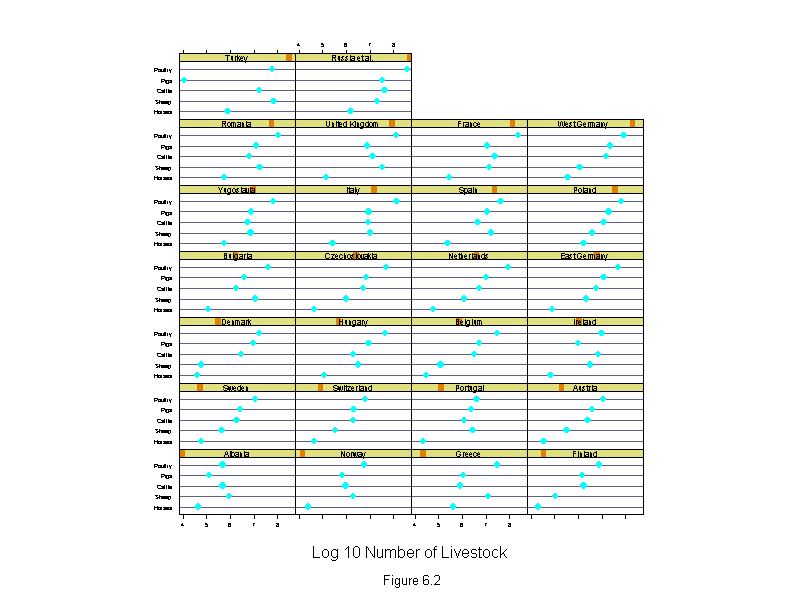
Figure 6.3
attach(livestock)
logcount <- log10(count)
new.country <- ordered(country, rev(sort(levels(country))))
new.livestock <- ordered(livestock.type,
    c("Sheep","Poultry","Pigs","Horses","Cattle"))
ans <- dotplot(new.country ~ logcount | new.livestock,
  sub = list("Figure 6.3",cex=.8),
  xlab = "Log 10 Number of Livestock",
  layout=c(3,2))
detach()
ans

Figure 6.4
attach(livestock)
logcount <- log10(count)
wt <- rep(1,length(logcount))
for(i in 1:10){
  liv.lm <- lm(logcount~livestock.type+country,weights=wt)
  wt <- wt.bisquare(liv.lm$res/median(abs(liv.lm$res)),c=6)
liv.effects <- dummy.coef(liv.lm)
liv.effects <- sapply(liv.effects,sort)
all.effects <- c(liv.effects$livestock.type,NA,liv.effects$country)
ans <- dotplot(all.effects,
  aspect=1,
  sub = list("Figure 6.4",cex=.8),
  xlab = "Log Livestock Effects (log 10 count)")
detach()
ans

# no 6.4
Figure 6.5
attach(livestock)
logcount <- log10(count)
wt <- rep(1,length(logcount))
for(i in 1:10){
  liv.lm <- lm(logcount~livestock.type+country,weights=wt)
  wt <- wt.bisquare(liv.lm$res/median(abs(liv.lm$res)),c=6)
liv.effects <- dummy.coef(liv.lm)
liv.effects <- sapply(liv.effects,"sort")
new.country <- ordered(country,names(liv.effects$country))
new.livestock <- ordered(livestock.type,names(liv.effects$livestock.type))
ans <- dotplot(new.country ~ logcount | new.livestock,
  sub = list("Figure 6.5",cex=.8),
  xlab = "Log 10 Number of Livestock",
  layout=c(3,2))
detach()
ans
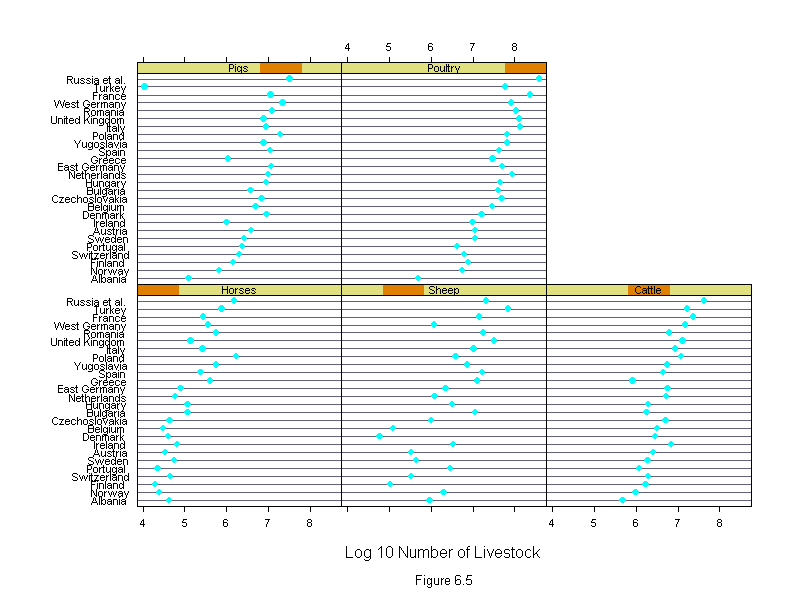
Figure 6.6
attach(livestock)
logcount <- log10(count)
wt <- rep(1,length(logcount))
for(i in 1:10){
  liv.lm <- lm(logcount~livestock.type+country,weights=wt)
  wt <- wt.bisquare(liv.lm$res/median(abs(liv.lm$res)),c=6)
liv.effects <- dummy.coef(liv.lm)
liv.effects <- sapply(liv.effects,"sort")
new.country <- ordered(country,names(liv.effects$country))
new.livestock <- ordered(livestock.type,names(liv.effects$livestock.type))
ans <- dotplot(new.livestock ~ logcount | new.country,
  sub = list("Figure 6.6",cex=.8),
  xlab = "Log 10 Number of Livestock",
  layout=c(4,7),
  aspect=1)
detach()
ans
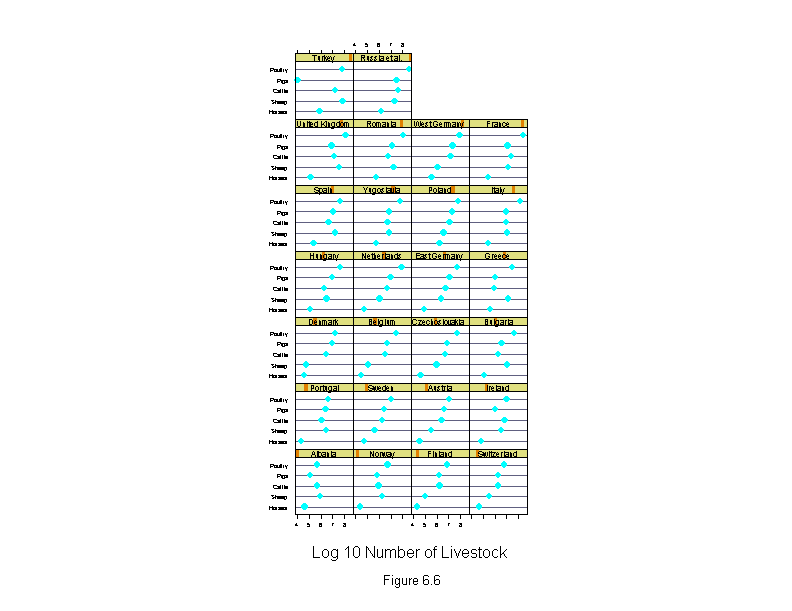
Figure 6.7
attach(livestock)
logcount <- log10(count)
wt <- rep(1,length(logcount))
for(i in 1:10){
  liv.lm <- lm(logcount~livestock.type+country,weights=wt)
  wt <- wt.bisquare(liv.lm$res/median(abs(liv.lm$res)),c=6)  }
liv.effects <- dummy.coef(liv.lm)
liv.effects <- sapply(liv.effects,"sort")
new.country <- ordered(country,names(liv.effects$country))
new.livestock <- ordered(livestock.type,names(liv.effects$livestock.type))
ans <- dotplot(new.country ~ fitted.values(liv.lm) | new.livestock,
  sub = list("Figure 6.7",cex=.8),
  xlab = "Fitted Log 10 Number of Livestock",
  layout=c(3,2))
detach()
ans
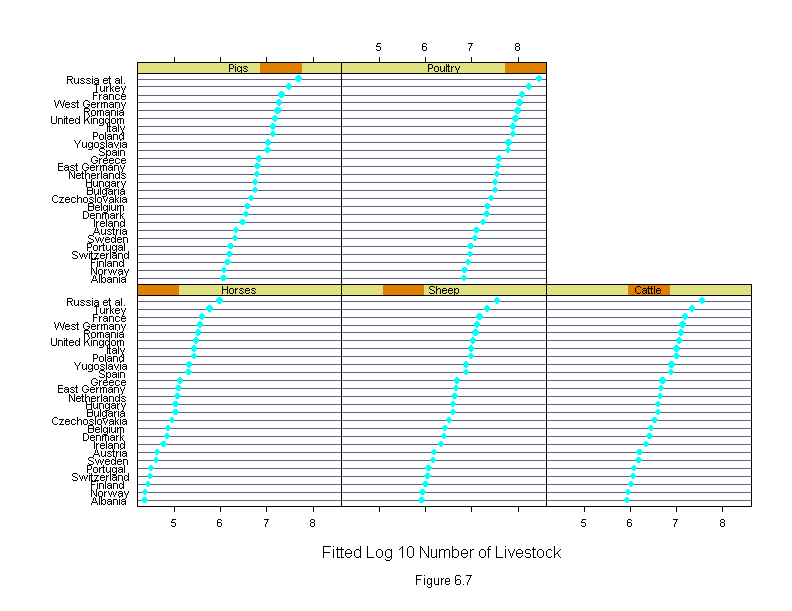
Figure 6.8
attach(livestock)
logcount <- log10(count)
wt <- rep(1,length(logcount))
for(i in 1:10){
  liv.lm <- lm(logcount~livestock.type+country,weights=wt)
  wt <- wt.bisquare(liv.lm$res/median(abs(liv.lm$res)),c=6)
liv.effects <- dummy.coef(liv.lm)
liv.effects <- sapply(liv.effects,"sort")
new.country <- ordered(country,names(liv.effects$country))
new.livestock <- ordered(livestock.type,names(liv.effects$livestock.type))
ans <- dotplot(new.livestock ~ fitted.values(liv.lm) | new.country,
  sub = list("Figure 6.8",cex=.8),
  xlab = "Fitted Log 10 Number of Livestock",
  layout=c(4,7),
  aspect=1)
detach()
ans
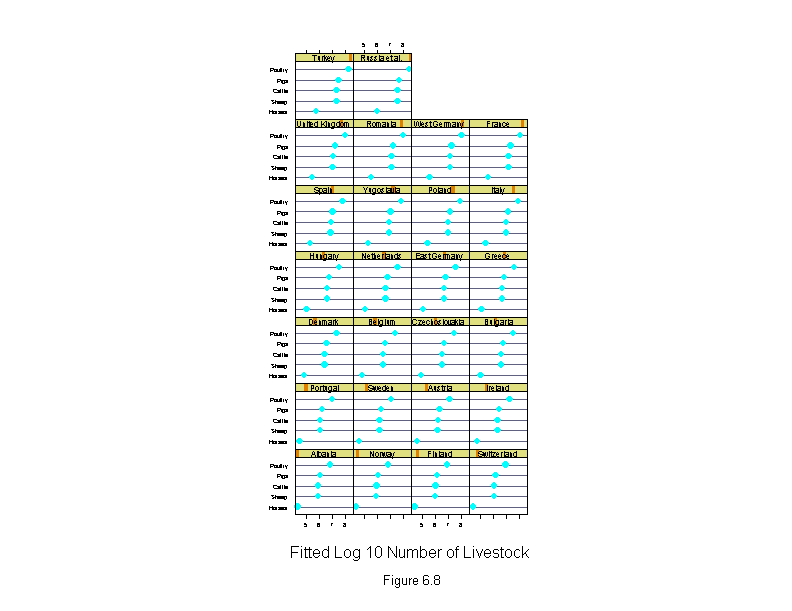
Figure 6.9
attach(livestock)
logcount <- logb(count,2)
wt <- rep(1,length(logcount))
for(i in 1:10){
  liv.lm <- lm(logcount~livestock.type+country,weights=wt)
  wt <- wt.bisquare(liv.lm$res/median(abs(liv.lm$res)),c=6)
liv.effects <- dummy.coef(liv.lm)
liv.effects <- sapply(liv.effects,"sort")
new.country <- ordered(country,names(liv.effects$country))
new.livestock <- ordered(livestock.type,names(liv.effects$livestock.type))
liv.res <- residuals(liv.lm)
liv.res[(livestock.type=="Pigs")&(country=="Turkey")] <- NA
ans <- dotplot(new.country ~ liv.res | new.livestock,
  panel = function(x, y) {
    panel.dotplot(x, y)
    panel.abline(v=0)
  },
  layout=c(3,2),
  sub = list("Figure 6.9",cex=.8),
  xlab = "Residual Log 2 Number of Livestock")
detach()
ans
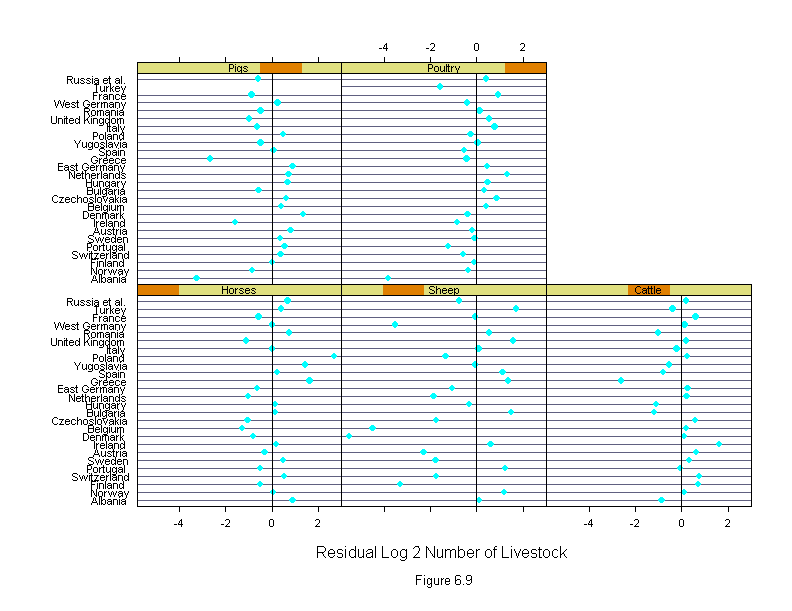
Figure 6.10
attach(livestock)
logcount <- logb(count,2)
wt <- rep(1,length(logcount))
for(i in 1:10){
  liv.lm <- lm(logcount~livestock.type+country,weights=wt)
  wt <- wt.bisquare(liv.lm$res/median(abs(liv.lm$res)),c=6)
liv.effects <- dummy.coef(liv.lm)
liv.effects <- sapply(liv.effects,"sort")
new.country <- ordered(country,names(liv.effects$country))
new.livestock <- ordered(livestock.type,names(liv.effects$livestock.type))
liv.res <- residuals(liv.lm)
liv.res[(livestock.type=="Pigs")&(country=="Turkey")] <- NA
ans <- dotplot(new.livestock ~ liv.res | new.country,
  panel = function(x, y) {
    panel.dotplot(x, y)
    panel.abline(v=0)
  },
  aspect=1,
  layout=c(4,7),
  sub = list("Figure 6.10",cex=.8),
  xlab = "Residual Log 2 Number of Livestock")
detach()
ans
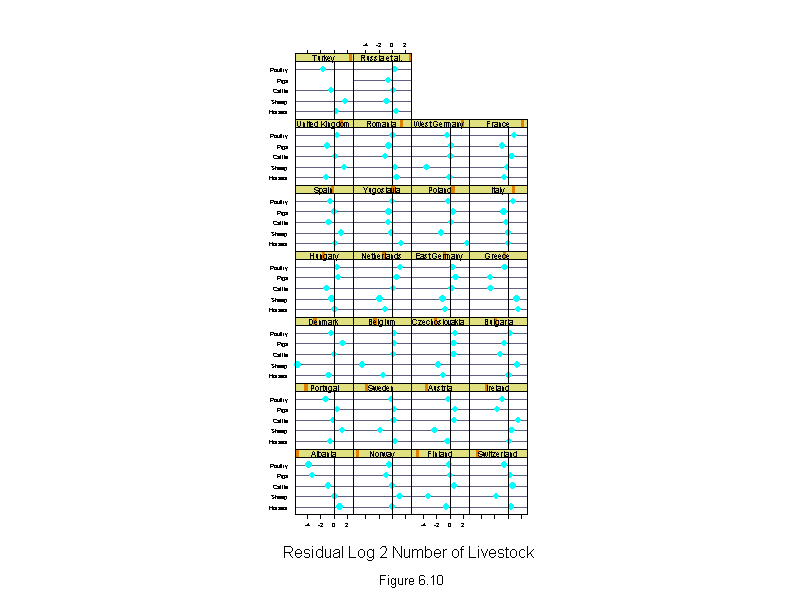
Figure 6.11
# requires map library -- with the world database (available from statlib)
attach(livestock)
library(maps)
xlim <- c(-10,32)
ylim <- c(35,70)
 map.ar <- diff(ylim)/(diff(xlim) * cos(abs(mean(ylim))*pi/180))
"map.xy"<-
list(x = c(20.0565758, 9.55326843, 21.5958538, 25.9420471, 14.9860134,
  8.19508266, -8.19369793, 14.7143764, 9.19108582, 19.241663,
  4.75434399, -7.74096918 , 25.0365906, 17.159111, 5.38816404,
  12.4507322, 19.241663, 12.5412788, -3.39477348
  , 19.0605717, 24.9460449, -1.67440414, 2.67179179, 8.28562832,
  29.835516, 28.2962379),
  y = c(40.9712944, 61.4110756, 39.8017159, 62.6363487,
  62.7477379, 46.9862709, 40.0801888, 47.7102966, 56.1758194,
  47.0419655, 50.7734795, 53.2797165, 42.7535095, 49.4368172,
  51.8873634, 52.4443054, 44.1458664, 42.8648987, 40.1358795,
  52.1101379, 45.9280815, 52.6113892, 46.8748817, 50.439312,
  38.799221, 54.4492989))
country.names <- levels(country)
names(map.xy$y) <- names(map.xy$x) <-country.names
europe <- map("world.thin", xlim = xlim, ylim = ylim, plot = F)
logcount <- logb(count,2)
wt <- rep(1,length(logcount))
for(i in 1:10){
  liv.lm <- lm(logcount~livestock.type+country,weights=wt)
  wt <- wt.bisquare(liv.lm$res/median(abs(liv.lm$res)),c=6)
residual.sheep <- residuals(liv.lm)[livestock.type=="Sheep"]
names(residual.sheep) <- as.character(country[livestock.type=="Sheep"])
residual.sheep <- residual.sheep[country.names]
residual.sheep <- equal.count(residual.sheep, number = 3, overlap = 1/4)
ans <- xyplot(map.xy$y ~ map.xy$x | residual.sheep,
  panel = substitute(function(x, y){
    do.call("lines", c(list(x = europe),
    trellis.par.get("reference.line")))
    do.call("panel.xyplot", c(list(x = x, y = y),
    trellis.par.get("dot.symbol")))
  }),
  layout = c(3, 1),
  aspect = map.ar,
  xlim = c(-10, 32),
  ylim = c(35, 70),
  xlab = "",
  ylab = "")
print(ans, position=c(0,.375,1,1), more=T)

logcount <- logb(count,2)
wt <- rep(1,length(logcount))
for(i in 1:10){
  liv.lm <- lm(logcount~livestock.type+country,weights=wt)
  wt <- wt.bisquare(liv.lm$res/median(abs(liv.lm$res)),c=6)
residual.sheep <- residuals(liv.lm)[livestock.type=="Sheep"]
ans <- plot(equal.count(residual.sheep, number = 3, overlap = 1/4),
  xlab = "Residual Log 2 Sheep CountnnFigure 6.11")
print(ans, position=c(0,.2,1,.5))

detach()
invisible()
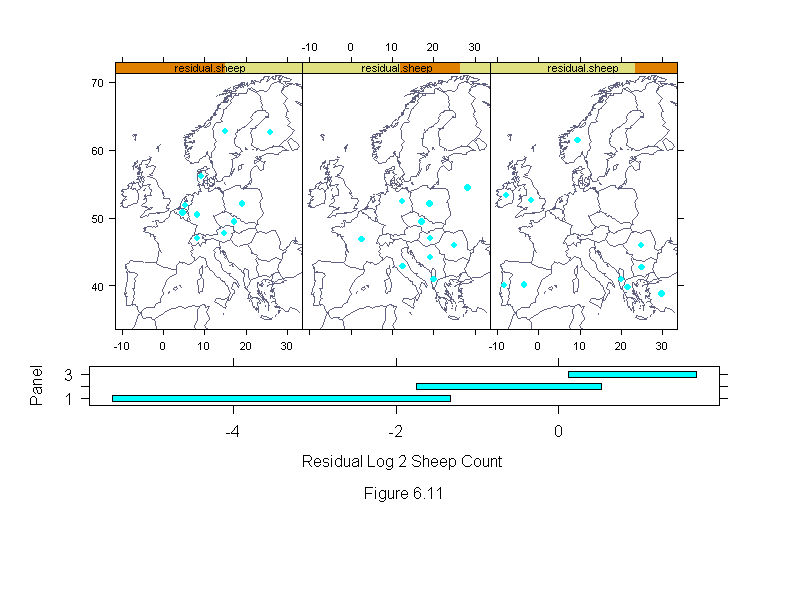
Figure 6.12
dotplot(algorithm ~ logb(time,2) | machine * input,
  data = run.time,
  aspect = "xy",
  sub = list("Figure 6.12",cex=.8),
  xlab = "Log Run Time (log 2 seconds)")
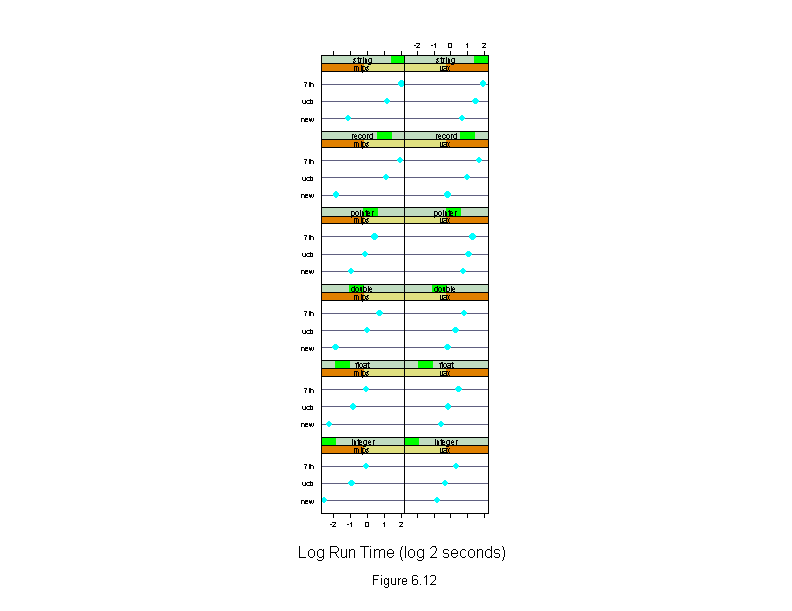
Figure 6.13
Machine <- levels(run.time$machine)
dotplot(algorithm ~ logb(time, 2) | input,
  data = run.time,
  panel = function(x, y, subscripts, ...) {
    do.call("abline", c(list(h = y), trellis.par.get("dot.line")))
    panel.superpose(x, y, subscripts, ...)
  },
  groups = machine,
  aspect = "xy",
  layout = c(2, 3),
  sub = list("Figure 6.13",cex=.8),
  xlab = "Log Run Time (log 2 seconds)",
  key = list(points = Rows(trellis.par.get("superpose.symbol"), 1:length(Machine)),
    text = list(Machine),
    columns = length(Machine)))
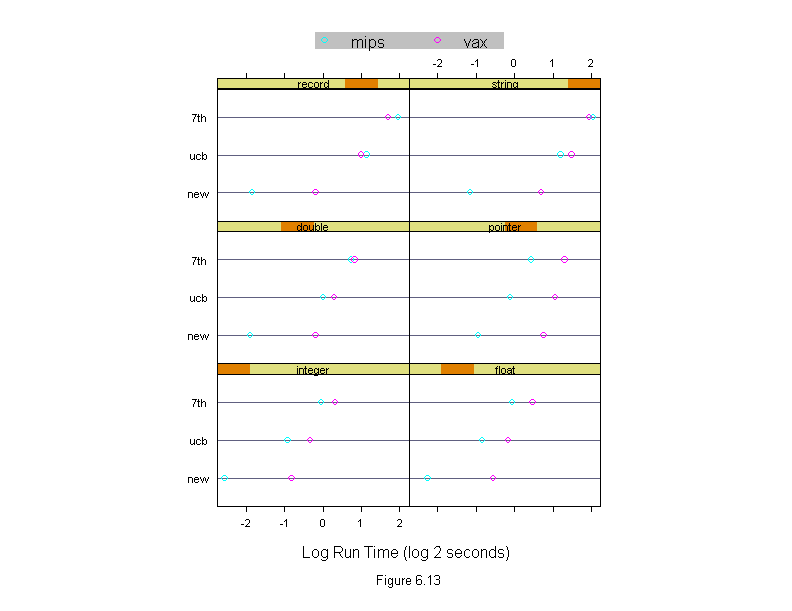
Figure 6.14
Machine <- levels(run.time$machine)
dotplot(input ~ logb(time, 2) | algorithm,
  data = run.time,
  panel = function(x, y, subscripts, ...) {
    do.call("abline", c(list(h = y), trellis.par.get("dot.line")))
    panel.superpose(x, y, subscripts, ...)
  },
  groups = machine,
  aspect = .5,
  layout = c(1,3),
  sub = list("Figure 6.14",cex=.8),
  xlab = "Log Run Time (log 2 seconds)",
  key = list(points = Rows(trellis.par.get("superpose.symbol"), 1:length(Machine)),
    text = list(Machine),
    columns = length(Machine)))
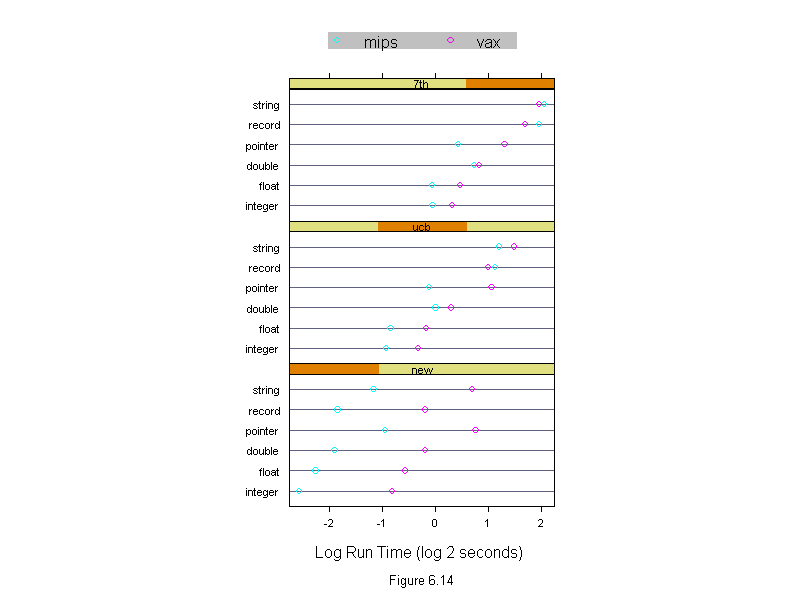
Figure 6.15
differences <- run.time
differences$time <- logb(differences$time,2)
new.vax <- differences$time[(differences$algorithm=="new")&
  (differences$machine=="vax")]
new.mips <- differences$time[(differences$algorithm=="new")&
  (differences$machine=="mips")]
differences$time <- differences$time - c(rep(new.vax,3),rep(new.mips,3))
differences <- differences[differences$algorithm!="new",]
differences$algorithm <- ordered(differences$algorithm,    names(sort(tapply(differences$time,differences$algorithm,mean))))
differences$machine <- ordered(differences$machine,
  names(sort(tapply(differences$time,differences$machine,mean))))
differences$input <- ordered(differences$input,
  names(sort(tapply(differences$time,differences$input,mean))))
Algorithm <- levels(differences$algorithm)
dotplot(input ~ time | machine,
  data = differences,
  panel = function(x, y, subscripts, ...){
    do.call("abline", c(list(h = y), trellis.par.get("dot.line")))
    panel.superpose(x, y, subscripts, ...)
  },
  groups = algorithm,
  aspect = .5,
  layout = c(2, 1),
  xlim = c(0, 4),
  sub = list("Figure 6.15",cex=.8),
  xlab = "Improvement (log 2 seconds)",
  key = list(y = 1.3,
    points = Rows(trellis.par.get("superpose.symbol"), 1:length(Algorithm)),
    text = list(Algorithm),
    columns = length(Algorithm)))
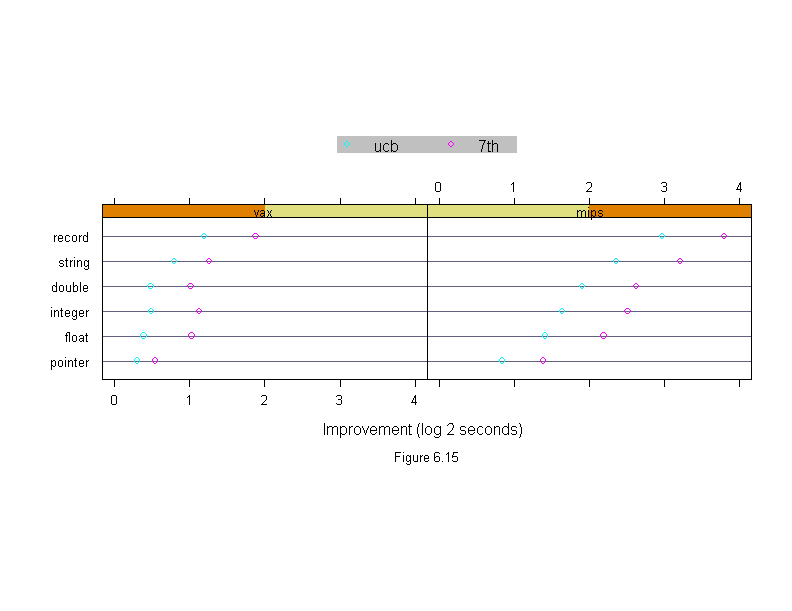
Figure 6.16
differences <- run.time
differences$time <- logb(differences$time,2)
new.vax <- differences$time[(differences$algorithm=="new")&
  (differences$machine=="vax")]
new.mips <- differences$time[(differences$algorithm=="new")&
  (differences$machine=="mips")]
differences$time <- differences$time - c(rep(new.vax,3),rep(new.mips,3))
differences <- differences[differences$algorithm!="new",]
differences$algorithm <- ordered(differences$algorithm,
  names(sort(tapply(differences$time,differences$algorithm,mean))))
differences$machine <- ordered(differences$machine,
  names(sort(tapply(differences$time,differences$machine,mean))))
differences$input <- ordered(differences$input,
  names(sort(tapply(differences$time,differences$input,mean))))
attach(differences)
runtime.lm <- lm(time~(input+algorithm)*machine)
ans <- dotplot(input ~ residuals(runtime.lm) | machine * algorithm,
  panel = function(x, y) {
    panel.dotplot(x, y)
    panel.abline(v = 0)
  },
  aspect = 2/3,
  layout = c(2, 2),
  sub = list("Figure 6.16",cex=.8),
  xlab = "Residual Improvement (log 2 seconds)")
detach()
ans
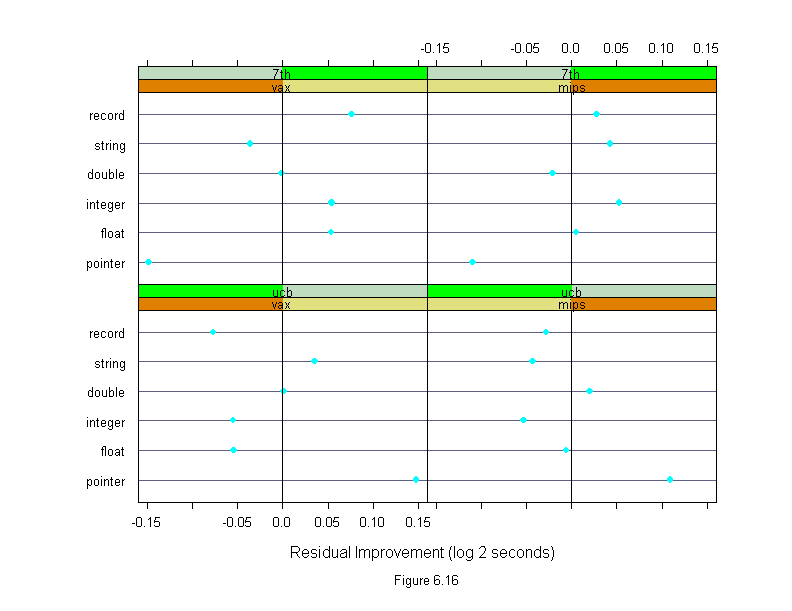
Figure 6.17
differences <- run.time
differences$time <- logb(differences$time,2)
new.vax <- differences$time[(differences$algorithm=="new")&
  (differences$machine=="vax")]
new.mips <- differences$time[(differences$algorithm=="new")&
  (differences$machine=="mips")]
differences$time <- differences$time - c(rep(new.vax,3),rep(new.mips,3))
differences <- differences[differences$algorithm!="new",]
differences$algorithm <- ordered(differences$algorithm,
  names(sort(tapply(differences$time,differences$algorithm,mean))))
differences$machine <- ordered(differences$machine,
  names(sort(tapply(differences$time,differences$machine,mean))))
differences$input <- ordered(differences$input,
  names(sort(tapply(differences$time,differences$input,mean))))
rfs(lm(time~(input+algorithm)*machine, data = differences),
  sub = list("Figure 6.17",cex=.8),
  aspect = 2,
  ylab = "Log Run Time (log 2 seconds)")
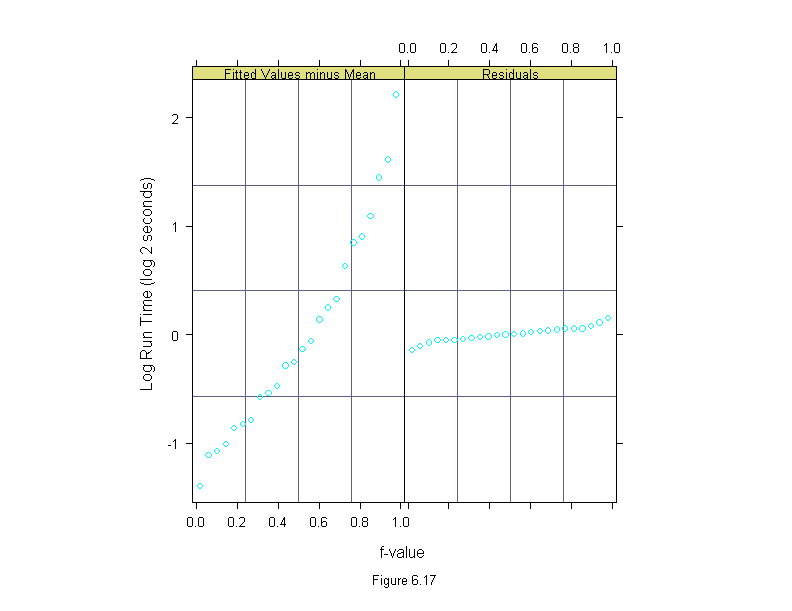
Figure 6.18
differences <- run.time
differences$time <- logb(differences$time,2)
new.vax <- differences$time[(differences$algorithm=="new")&
  (differences$machine=="vax")]
new.mips <- differences$time[(differences$algorithm=="new")&
  (differences$machine=="mips")]
differences$time <- differences$time - c(rep(new.vax,3),rep(new.mips,3))
differences <- differences[differences$algorithm!="new",]
differences$algorithm <- ordered(differences$algorithm,
  names(sort(tapply(differences$time,differences$algorithm,mean))))
differences$machine <- ordered(differences$machine,
  names(sort(tapply(differences$time,differences$machine,mean))))
differences$input <- ordered(differences$input,
  names(sort(tapply(differences$time,differences$input,mean))))
attach(differences)  runtime.lm <- lm(time~(input+algorithm)*machine)
which <- algorithm == "7th"
ans <- dotplot(input[which] ~ fitted(runtime.lm)[which] | machine[which],
  aspect = 1/4,
  layout = c(1, 2),
  sub = list("Figure 6.18",cex=.8),
  xlab = "Fitted Improvement (log 2 seconds)")
detach()
ans
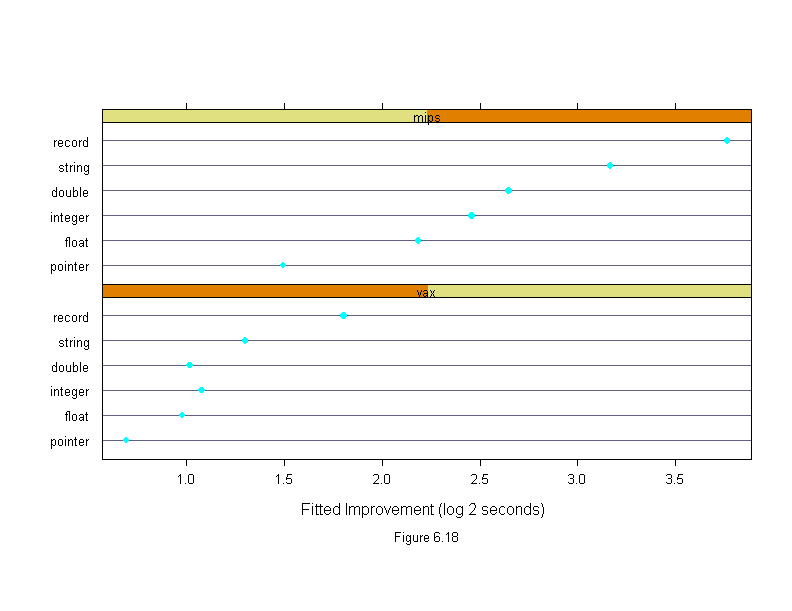
Figure 6.19
differences <- run.time
differences$time <- logb(differences$time,2)
new.vax <- differences$time[(differences$algorithm=="new")&
  (differences$machine=="vax")]
new.mips <- differences$time[(differences$algorithm=="new")&
  (differences$machine=="mips")]
differences$time <- differences$time - c(rep(new.vax,3),rep(new.mips,3))
differences <- differences[differences$algorithm!="new",]
differences$algorithm <- ordered(differences$algorithm,
  names(sort(tapply(differences$time,differences$algorithm,mean))))
differences$machine <- ordered(differences$machine,
  names(sort(tapply(differences$time,differences$machine,mean))))
differences$input <- ordered(differences$input,
  names(sort(tapply(differences$time,differences$input,mean))))
attach(differences)
runtime.lm.fitted <- 2^fitted(lm(time~(input+algorithm)*machine))
which <- algorithm == "7th"
ans <- dotplot(input ~ runtime.lm.fitted | machine,
  subset = algorithm == "7th",
  aspect = 1/4,
  layout = c(1, 2),
  sub = list("Figure 6.19",cex=.8),
  xlab = "Fitted Improvement Factor")
detach()
ans
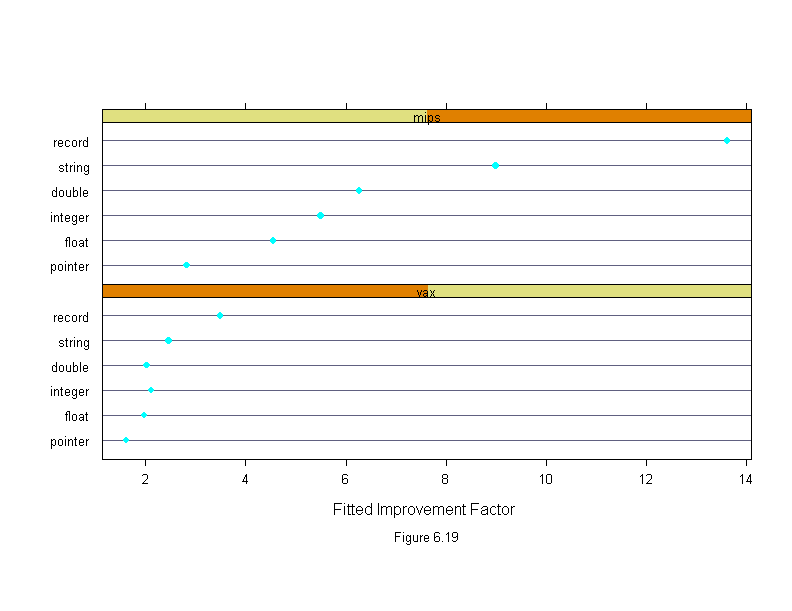
Figure 6.20
dotplot(variety ~ yield | year * site,
  data = barley,
  aspect=.4,
  sub = list("Figure 6.20",cex=.8),
  xlab = "Barley Yield (bushels/acre)")
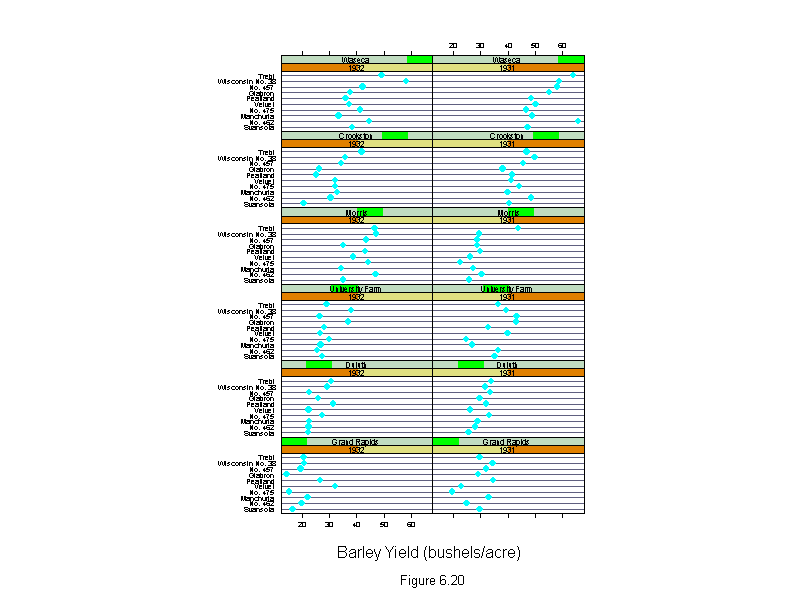
Figure 6.21
attach(barley)
morris31 <- yield[(site=="Morris")&(year=="1931")]
morris32 <- yield[(site=="Morris")&(year=="1932")]
new.yield <- yield
new.yield[(site=="Morris")&(year=="1931")] <- morris32
new.yield[(site=="Morris")&(year=="1932")] <- morris31
ans <- dotplot(variety ~ new.yield | year * site,
  sub = list("Figure 6.21",cex=.8),
  xlab = "Barley Yield (bushels/acre)",
  aspect=.4)
detach()
ans
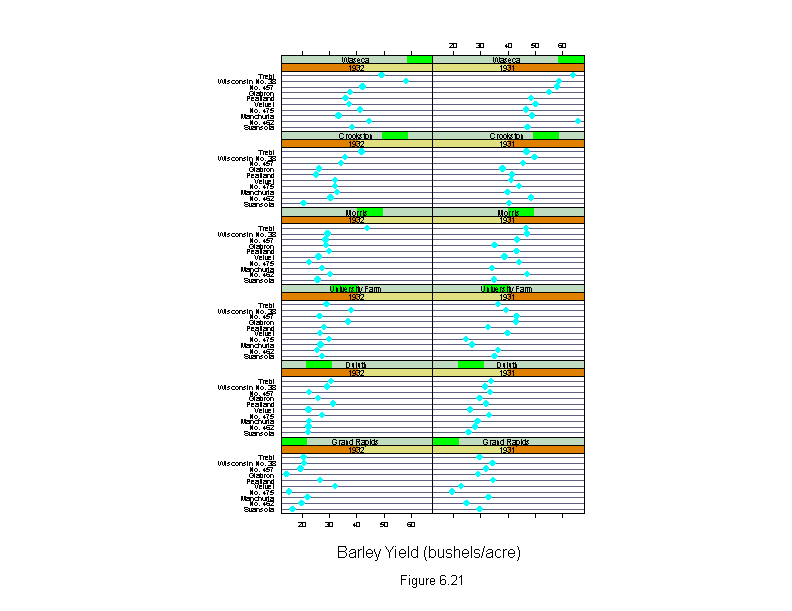
Figure 6.22
attach(barley)
morris31 <- yield[(site=="Morris")&(year=="1931")]
morris32 <- yield[(site=="Morris")&(year=="1932")]
new.yield <- yield
new.yield[(site=="Morris")&(year=="1931")] <- morris32
new.yield[(site=="Morris")&(year=="1932")] <- morris31
which <- year=="1931"
new.yield.diff <- new.yield[which]-new.yield[!which]
ans <- dotplot(variety[which] ~ new.yield.diff | site[which],
  sub = list("Figure 6.22",cex=.8),
  xlab = "Differences of Barley Yield (bushels/acre)",
  layout = c(1,6),
  aspect=.4)
detach()
ans
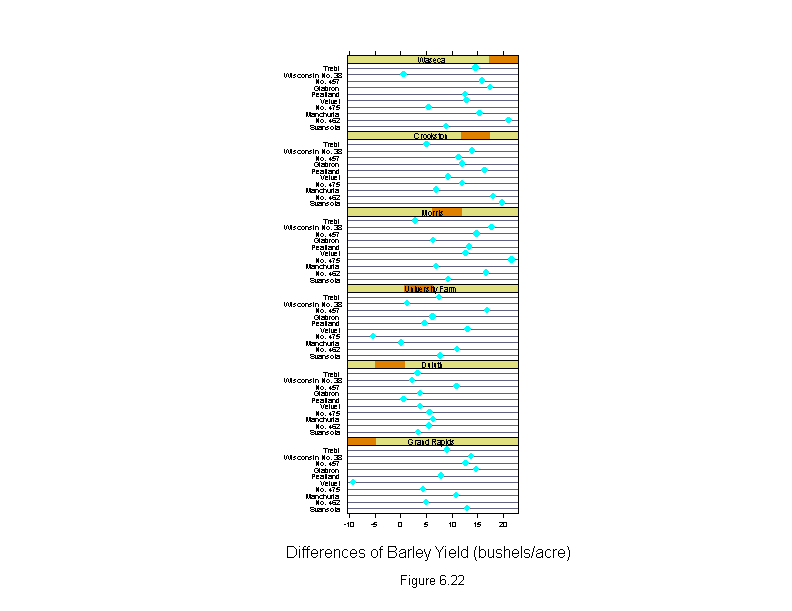
Figure 6.23
attach(barley)
morris31 <- yield[(site=="Morris")&(year=="1931")]
morris32 <- yield[(site=="Morris")&(year=="1932")]
new.yield <- yield
new.yield[(site=="Morris")&(year=="1931")] <- morris32
new.yield[(site=="Morris")&(year=="1932")] <- morris31
wt <- rep(1,length(yield))
for(i in 1:10){
  barley.lm <- lm(new.yield~variety+year*site,weights=wt)
  wt <- wt.bisquare(barley.lm$res/median(abs(barley.lm$res)),c=6)
ans <- rfs(barley.lm,
  sub = list("Figure 6.23",cex=.8),
  aspect=2,
  ylab = "Yield (bushels/acre)")
detach()
ans
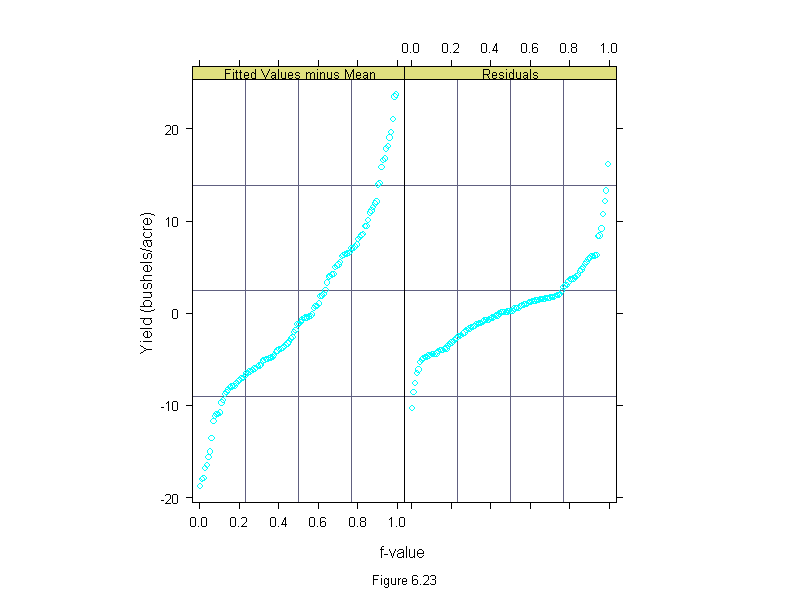
Figure 6.24
attach(barley)
morris31 <- yield[(site=="Morris")&(year=="1931")]
morris32 <- yield[(site=="Morris")&(year=="1932")]
new.yield <- yield
new.yield[(site=="Morris")&(year=="1931")] <- morris32
new.yield[(site=="Morris")&(year=="1932")] <- morris31
wt <- rep(1,length(yield))
for(i in 1:10){
  barley.lm <- lm(new.yield~variety+year*site,weights=wt)
  wt <- wt.bisquare(barley.lm$res/median(abs(barley.lm$res)),c=6)
barley.effects <- dummy.coef(barley.lm)
ys.effects <- c(barley.effects$"year:site" + outer(
  barley.effects$year,barley.effects$site,"+"))
ys.year <- ordered(rep(levels(year),6),levels(year))
ys.site <- ordered(rep(levels(site),rep(2,6)),levels(site))
n <- length(levels(ys.year))
ans <- dotplot(ys.site ~ ys.effects,
  panel = function(x, y, subscripts, ...) {
    do.call("abline", c(list(h = y), trellis.par.get("dot.line")))
    panel.superpose(x, y, subscripts, ...)
  },
  groups = ys.year,
  aspect = 2/3,
  sub = list("Figure 6.24",cex=.8),
  xlab = "Site by Year Effects (bushels/acre)",
  key = list(
    points = Rows(trellis.par.get("superpose.symbol"), 1:n),
    text = list(levels(ys.year)),
    columns = n))
detach()
ans
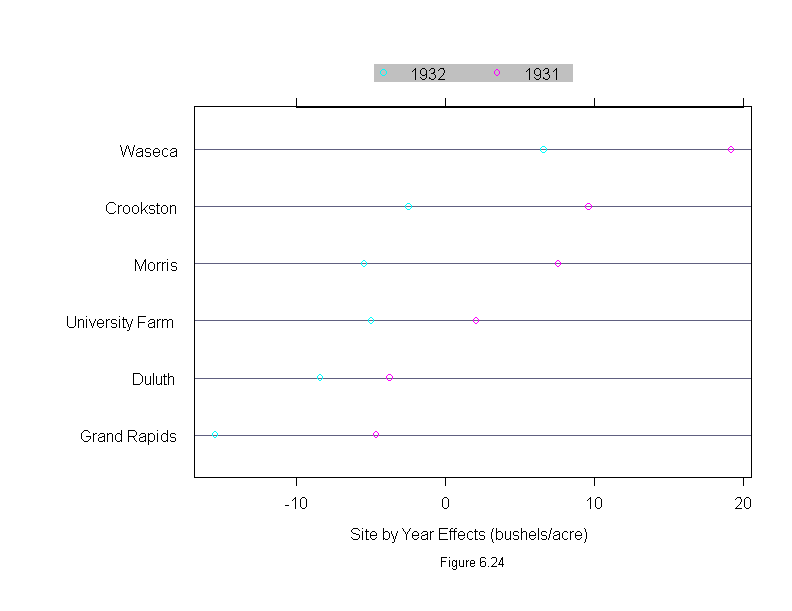
Figure 6.25
attach(barley)
morris31 <- yield[(site=="Morris")&(year=="1931")]
morris32 <- yield[(site=="Morris")&(year=="1932")]
new.yield <- yield
new.yield[(site=="Morris")&(year=="1931")] <- morris32
new.yield[(site=="Morris")&(year=="1932")] <- morris31
wt <- rep(1,length(yield))
for(i in 1:10){
  barley.lm <- lm(new.yield~variety+year*site,weights=wt)
  wt <- wt.bisquare(barley.lm$res/median(abs(barley.lm$res)),c=6)
barley.effects <- dummy.coef(barley.lm)
ans <- dotplot(sort(barley.effects$variety),
  sub = list("Figure 6.25",cex=.8),
  xlab = "Variety Effects (bushels/acre)",
  aspect=2/3)
detach()
ans
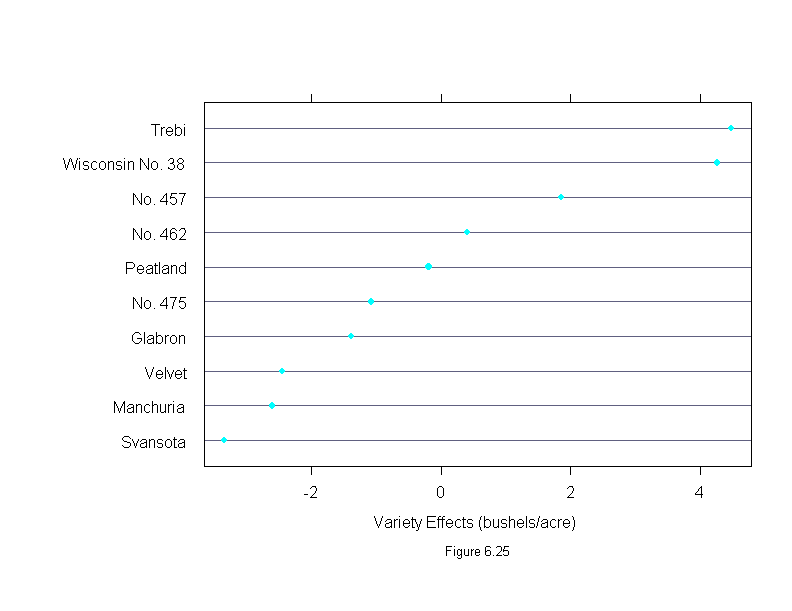
Figure 6.26
attach(barley)
morris31 <- yield[(site=="Morris")&(year=="1931")]
morris32 <- yield[(site=="Morris")&(year=="1932")]
new.yield <- yield
new.yield[(site=="Morris")&(year=="1931")] <- morris32
new.yield[(site=="Morris")&(year=="1932")] <- morris31
wt <- rep(1,length(yield))
for(i in 1:10){
  barley.lm <- lm(new.yield~variety+year*site,weights=wt)
  wt <- wt.bisquare(barley.lm$res/median(abs(barley.lm$res)),c=6)
ans <- dotplot(site ~ residuals(barley.lm) | year * variety,
  layout=c(4,5),
  aspect=2/3,
  panel = function(x, y) {
    panel.dotplot(x, y)
    panel.abline(v=0)
  },
  sub = list("Figure 6.26",cex=.8),
  xlab = "Residual Barley Yield (bushels/acre)")
detach()
ans
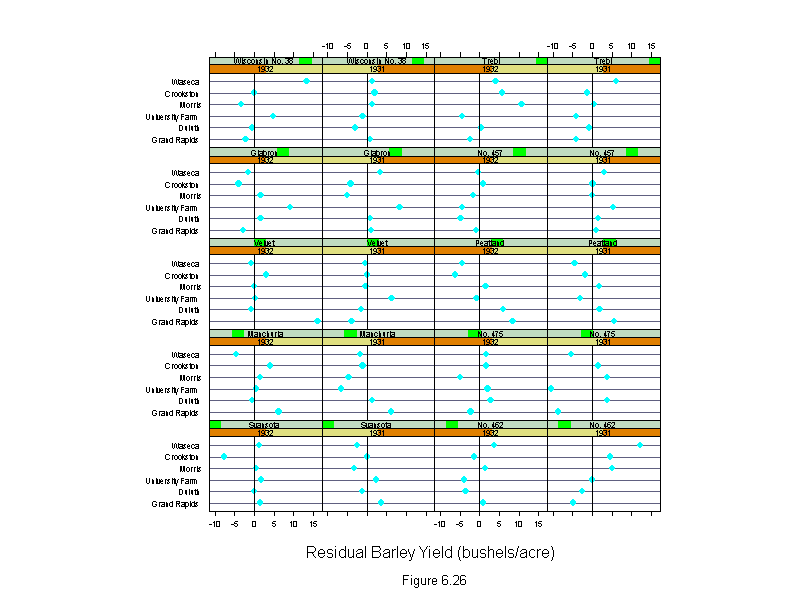
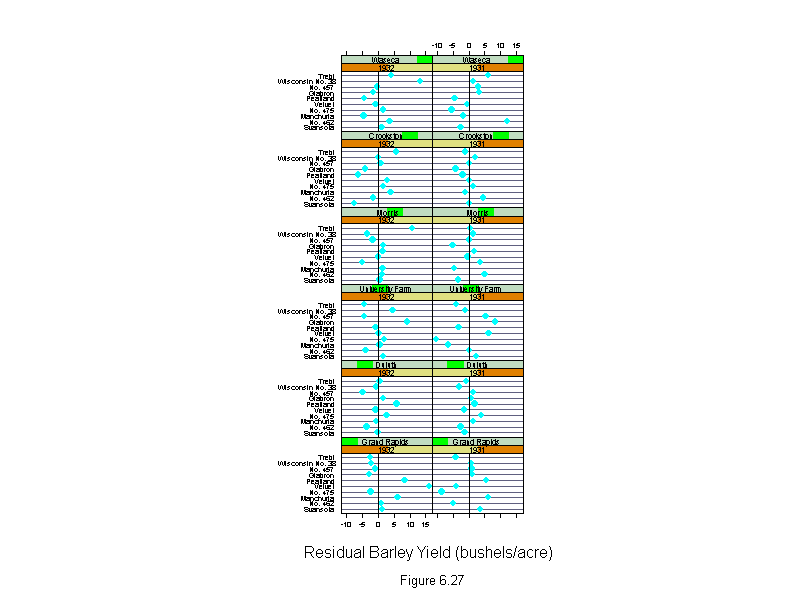
Figure 6.27
attach(barley)
morris31 <- yield[(site=="Morris")&(year=="1931")]
morris32 <- yield[(site=="Morris")&(year=="1932")]
new.yield <- yield
new.yield[(site=="Morris")&(year=="1931")] <- morris32
new.yield[(site=="Morris")&(year=="1932")] <- morris31
wt <- rep(1,length(yield))
for(i in 1:10){
  barley.lm <- lm(new.yield~variety+year*site,weights=wt)
  wt <- wt.bisquare(barley.lm$res/median(abs(barley.lm$res)),c=6)
ans <- dotplot(variety ~ residuals(barley.lm) | year * site,
  layout = c(2,6),
  aspect=2/3,
  panel = function(x, y) {
    panel.dotplot(x, y)
    panel.abline(v=0)
  },
  sub = list("Figure 6.27",cex=.8),
  xlab = "Residual Barley Yield (bushels/acre)")
detach()
ans
