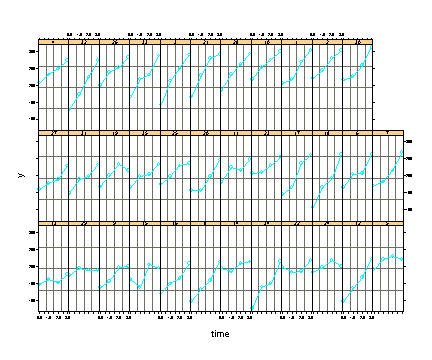
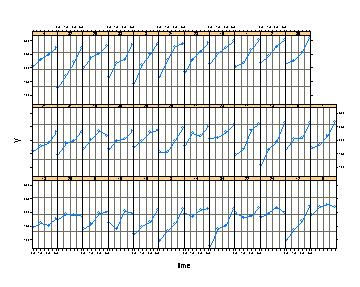
If the default color scheme for the lines and the symbol are not to your liking it is possible to change them using the following code. We are using the willet data from Singer’s article in this example.
We have a great trellis graph of the data in the Willet data from the Singer article. Unfortunately, the color of the lines and the symbols used in the graph are very hard to see and we would really like to change them.
#grouping the data so that we can graph it
willettg
#plotting using default color scheme
plot(willettg)
The parameter specifications for the line in the trellis plot are contained in the object plot.line. We access these parameters by using the trellis.par.get function and store the parameter specifications of plot.line in the object line Note: The name line was chosen arbitrarily.
line
Then we display the current parameters for plot.line by looking at the contents of the object line.
line

> line
$col:
[1] 2

$lty:
[1] 1

$lwd:
[1] 1
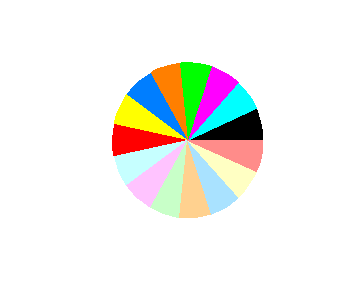
We see that the object line contains the parameter specifications for the color (line$col), the line type (line$lty) and line width (line$lwd). We wish to change the color of the lines from cyanna (color=2) to dark blue (color=6) and thus we assign line$col to be 6 and use the trellis.par.set function to specify that the parameters in plot.line should use the specifications contained in the object line. Note: To see which color correspond to which number please refer to the color wheel at the bottom of the page. The colors are numbered in a counter-clock wise order starting with the black slice which is number 1.
line$col
We verify that the line color has changed by applying the trellis.par.get function to the new (and now current) plot.line object which will list all the parameters and their specifications.
trellis.par.get("plot.line")

> trellis.par.get("plot.line")
$col:
[1] 6

$lty:
[1] 1

$lwd:
[1] 1
We now wish to make a similar change for the plotting symbol used in the trellis graph. We first use the trellis.par.get function to assign the parameters specifications contained in plot.symbol to the object new.symbol. We look at the current parameters for the plotting symbol and find that the current color parameter is cyanna (color=2) and we want to change this to dark blue (color=6). So, we assign new.symbol$col to be 6 and use the trellis.par.set function to specify that the parameters in plot.symbol should use the parameters specified in the object new.symbol. Finally, we verify that the color change has taken place.
new.symbol

> new.symbol
$cex:
[1] 0.8

$col:
[1] 2

$font:
[1] 1

$pch:
[1] 1

new.symbol$col

> trellis.par.get("plot.symbol")
$cex:
[1] 0.8

$col:
[1] 6

$font:
[1] 1

$pch:
[1] 1

#Plotting the trellis graph of the data with the new color scheme:
plot(willettg)
pie(rep(1, 15), col=1:15)


