You can download the https://stats.idre.ucla.edu/wp-content/uploads/2016/02/hsb2-1.csv data frame that will be used in these examples.
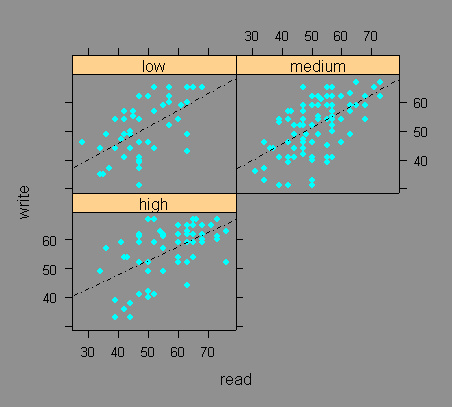
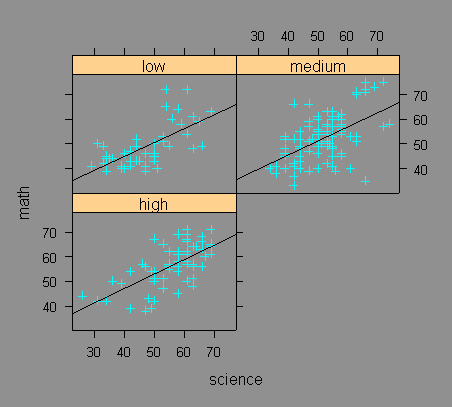
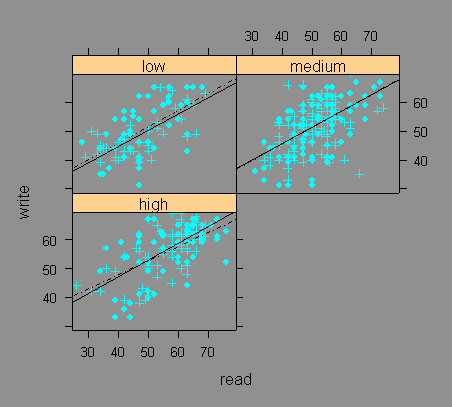
Suppose that we would like to overlay two different plots in one single trellis graph. For example, we would like to overlay two plots consisting of a scatter plot with a regression line, but in each graph we would like to have a different dependent and independent variable. In one trellis graph we would like to have a scatter plot and regression line of read regressed on write, and a scatter plot and regression line of science regression on math both conditional on the variable ses.
Reading in the hsb2 data frame.
hsb2 <- read.table('https://stats.idre.ucla.edu/wp-content/uploads/2016/02/hsb2-1.csv', header=T, sep=",")
Also, you will need to load the package lattice before you start. You can download lattice from the CRAN website from within R by clicking on “Packages” and then “Install package(s) from CRAN”.
library(lattice)
Let’s first look at how we would generate each trellis graph individually.
#creating a factor variable ses.f from the variable ses
hsb2$ses.f <- factor(hsb2$ses, label=c("low", "medium", "high"))

xyplot(write~read | ses.f, hsb2,
  panel=function(x, y){
	panel.xyplot(x, y, pch=16)
	panel.lmline(x, y, lty=4)
}, as.table=T)
xyplot(math~science | ses.f, hsb2,
  panel=function(x, y){
	panel.xyplot(x, y, pch=3)
	panel.lmline(x, y)
}, as.table=T)
In order to combine the two graphs we will make use of the subscript parameter, which is a parameter in every panel function. The subscript parameter is an indicator of which indices corresponds to which panel in the trellis graph. Thus, we include the subscript parameter in the function we create for the panel argument in the trellis graph. Since we want to have two scatter plots overlaid, we must have two panel.xyplot functions; likewise, we want to have two regression lines in each plot, and therefore we must include two panel.lmline functions. One of the panel.xyplot function will use the variables specified in the formula argument (write~read | ses.f) of the xyplot function which indicates which observation will be used in each of the panels. In the other panel.xyplot function we need to use the subscript parameter to indicate which observations will be used in each of the panels because we are no longer using the variables in the formula given in the formula argument in the xyplot function.
xyplot(write~read | ses.f, hsb2,
  panel=function(x, y, subscripts){
	panel.xyplot(x, y, pch=16)
	panel.lmline(x, y, lty=4)
	panel.xyplot(hsb2$science[subscripts], hsb2$math[subscripts], pch=3)
	panel.lmline(hsb2$science[subscripts], hsb2$math[subscripts])
}, as.table=T, subscripts=T)


