The posterior is just the prior times the likelihood.
\[ p(theta | X) = frac{p(theta)p(X|theta)}{p(X)} \]
Example Prior Distributions
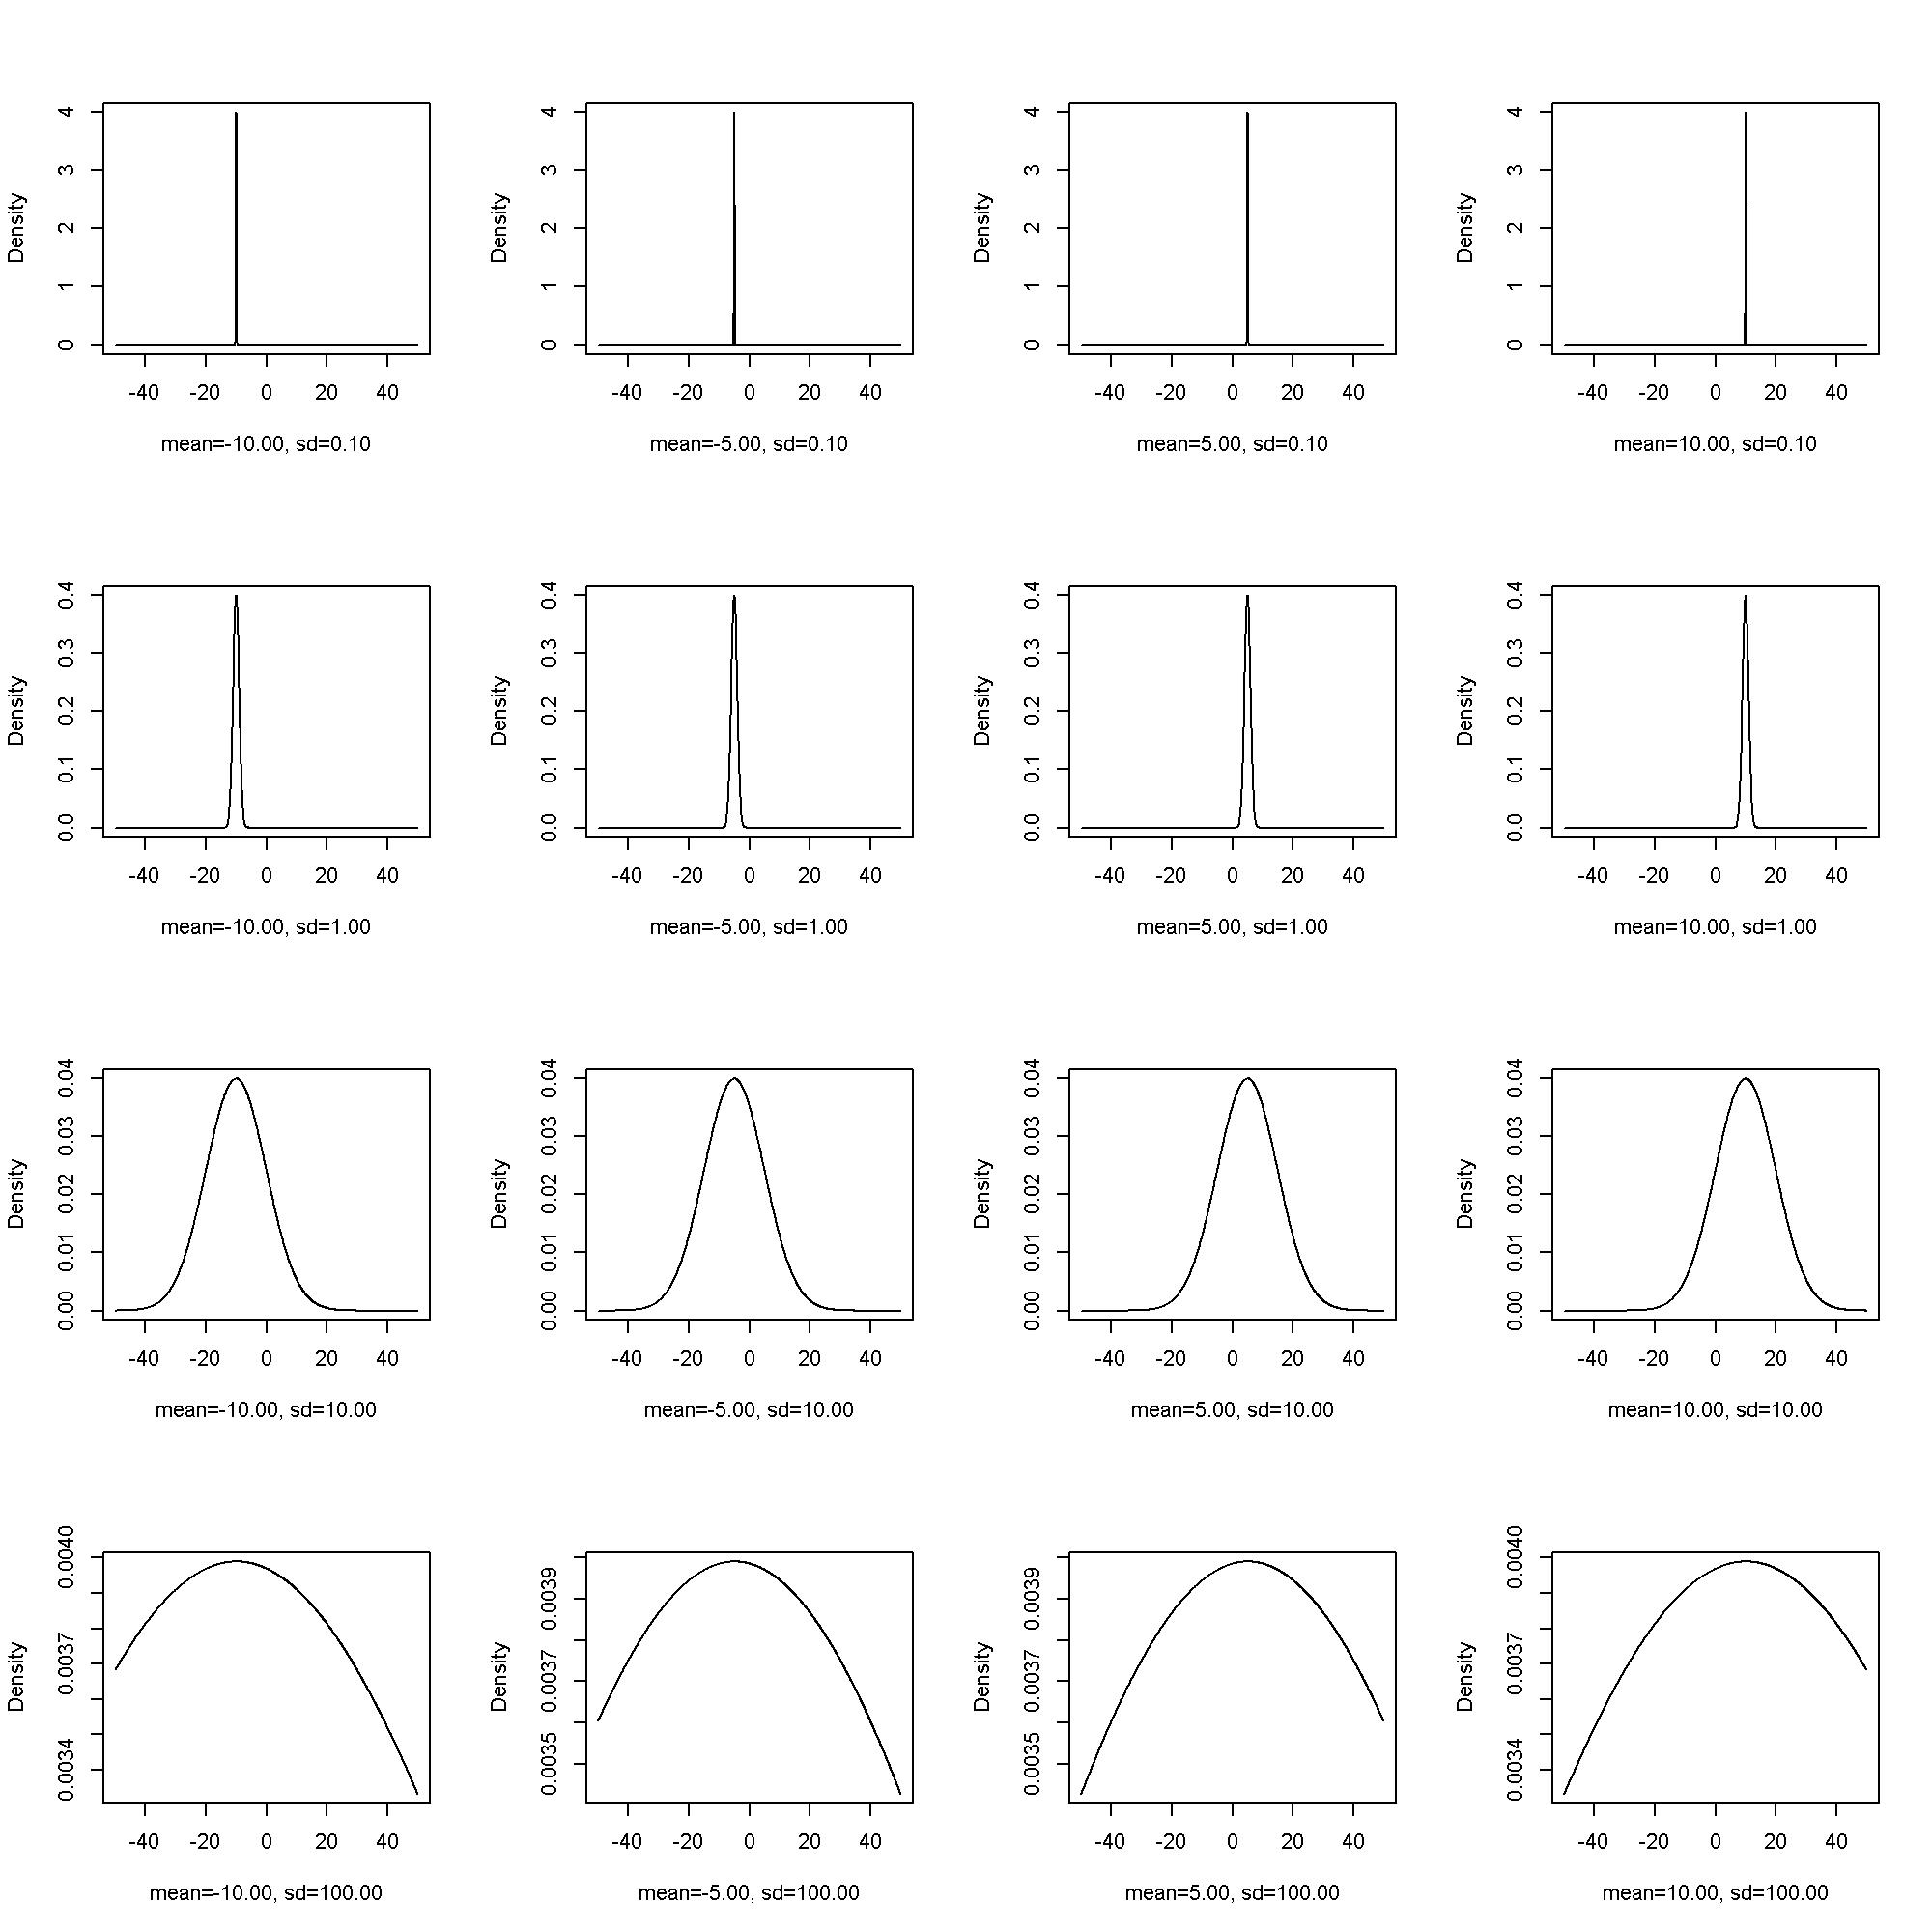
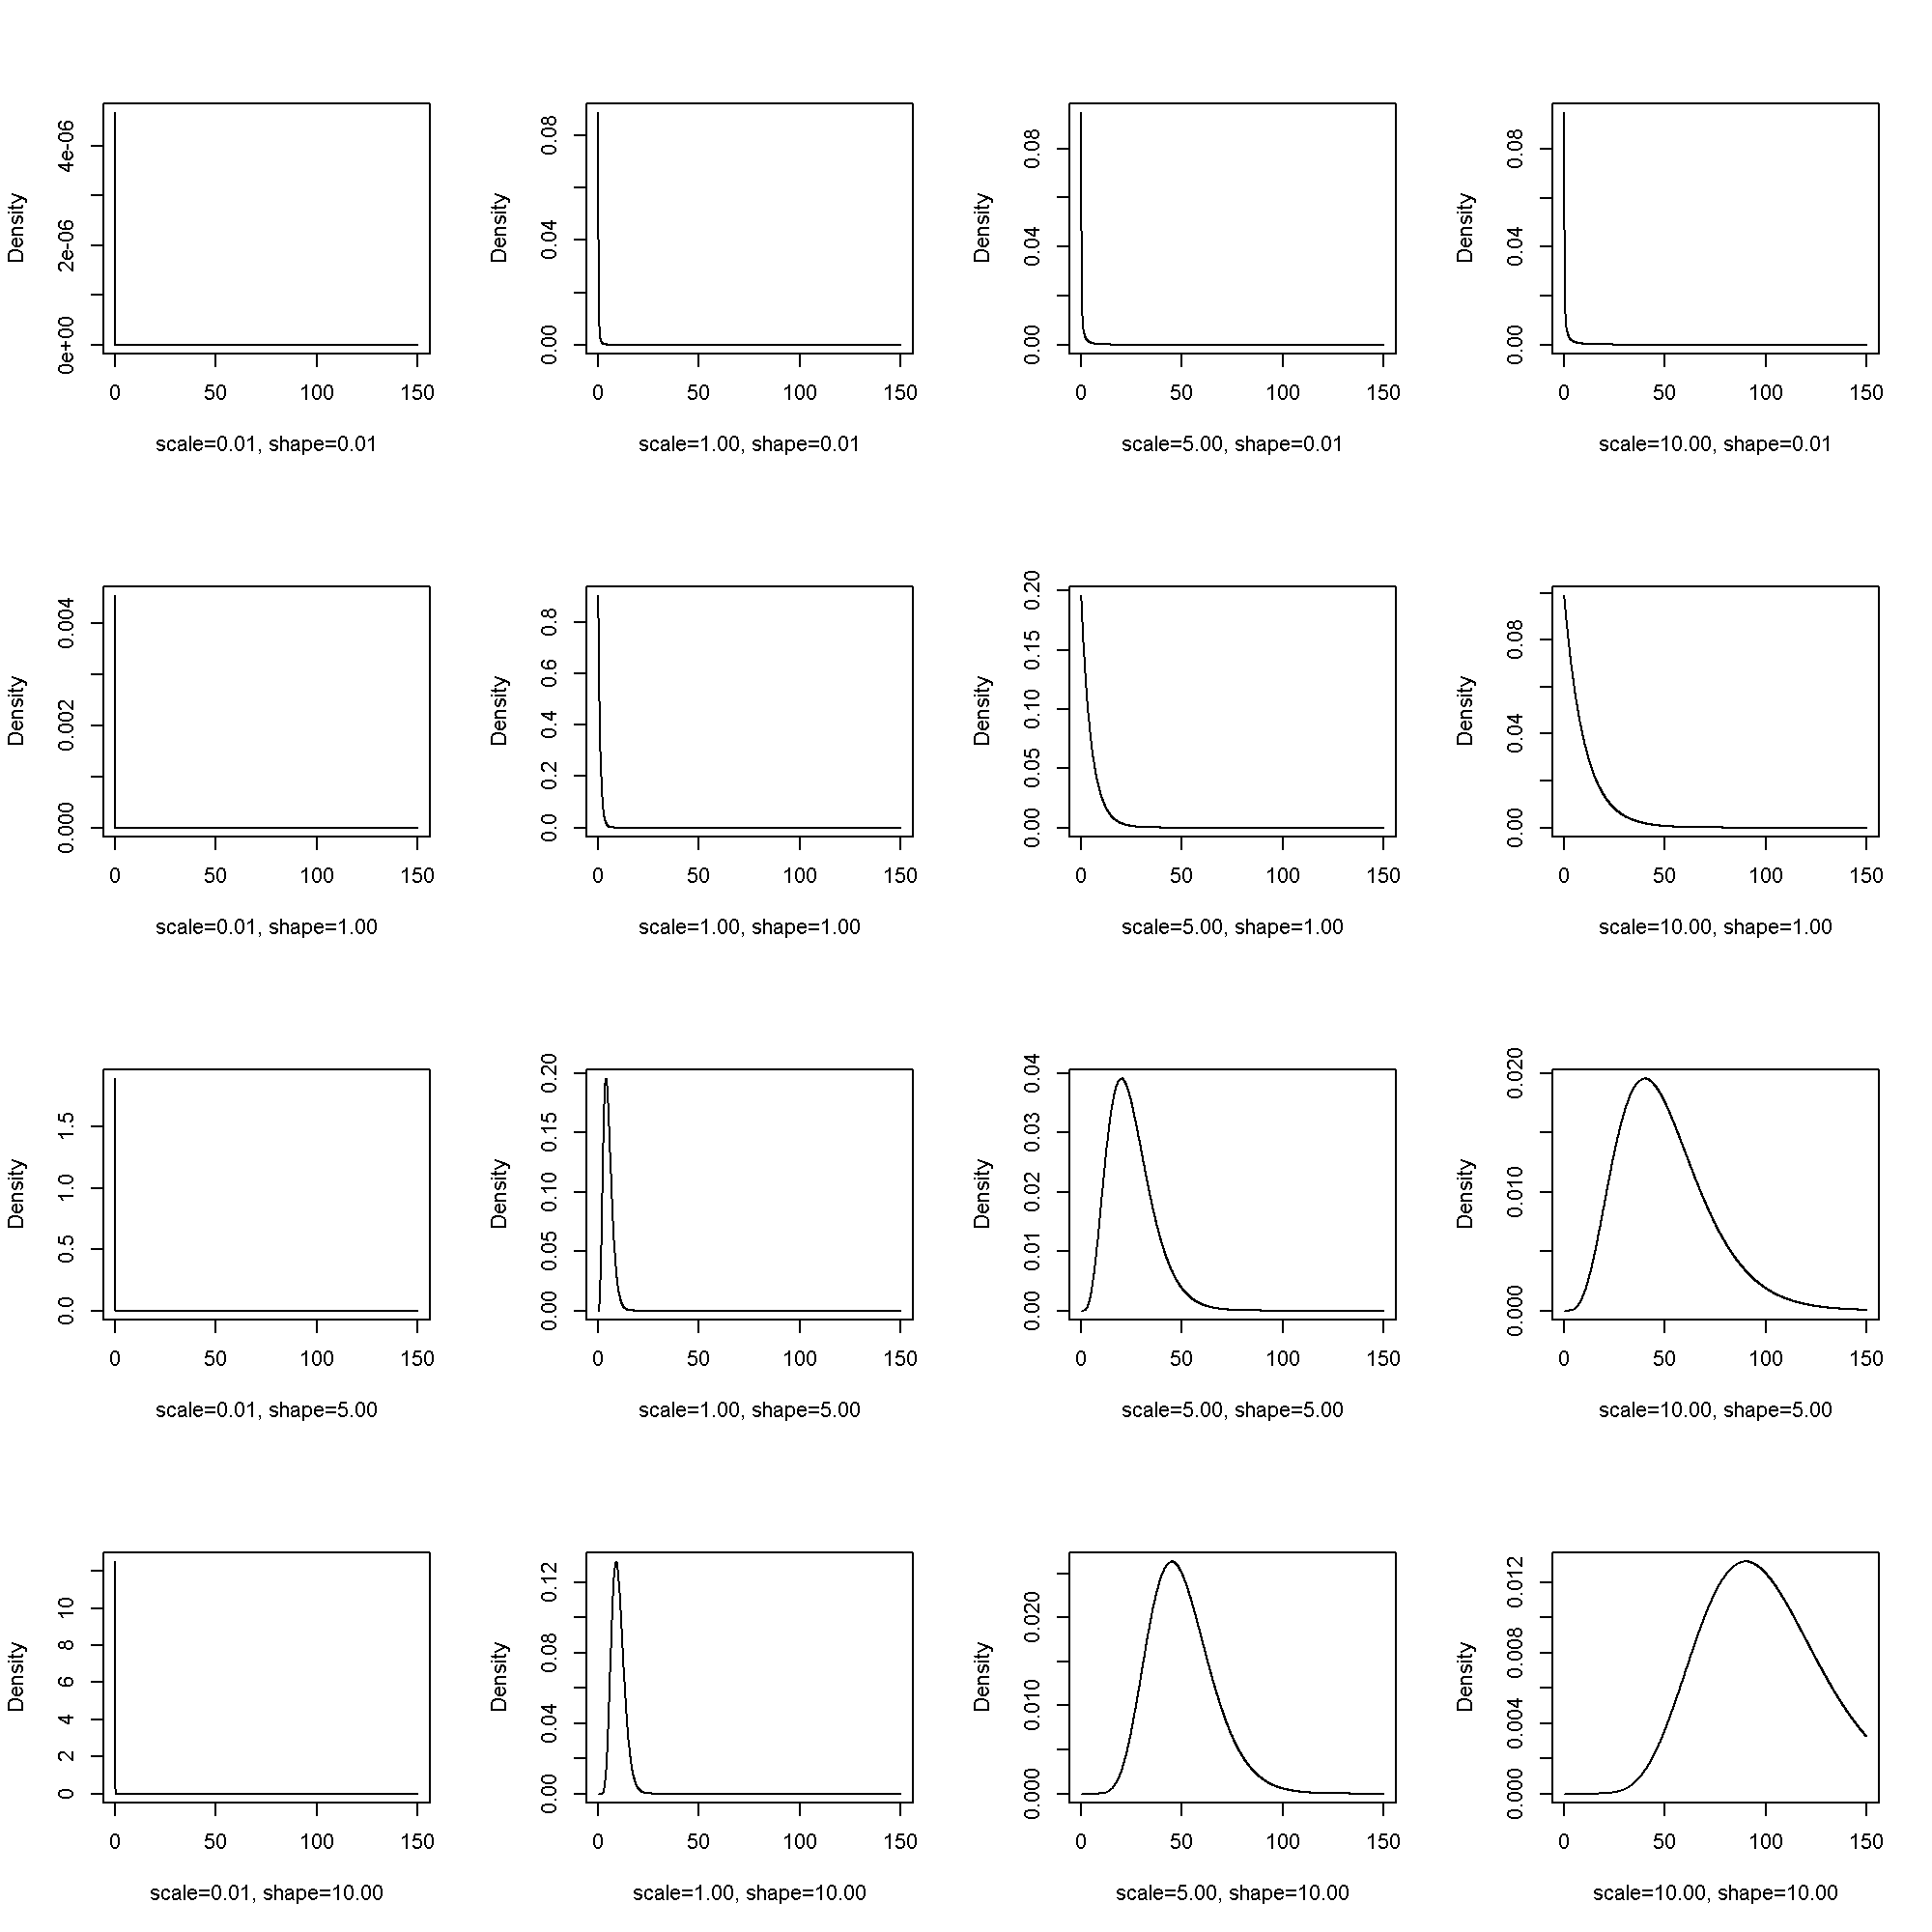
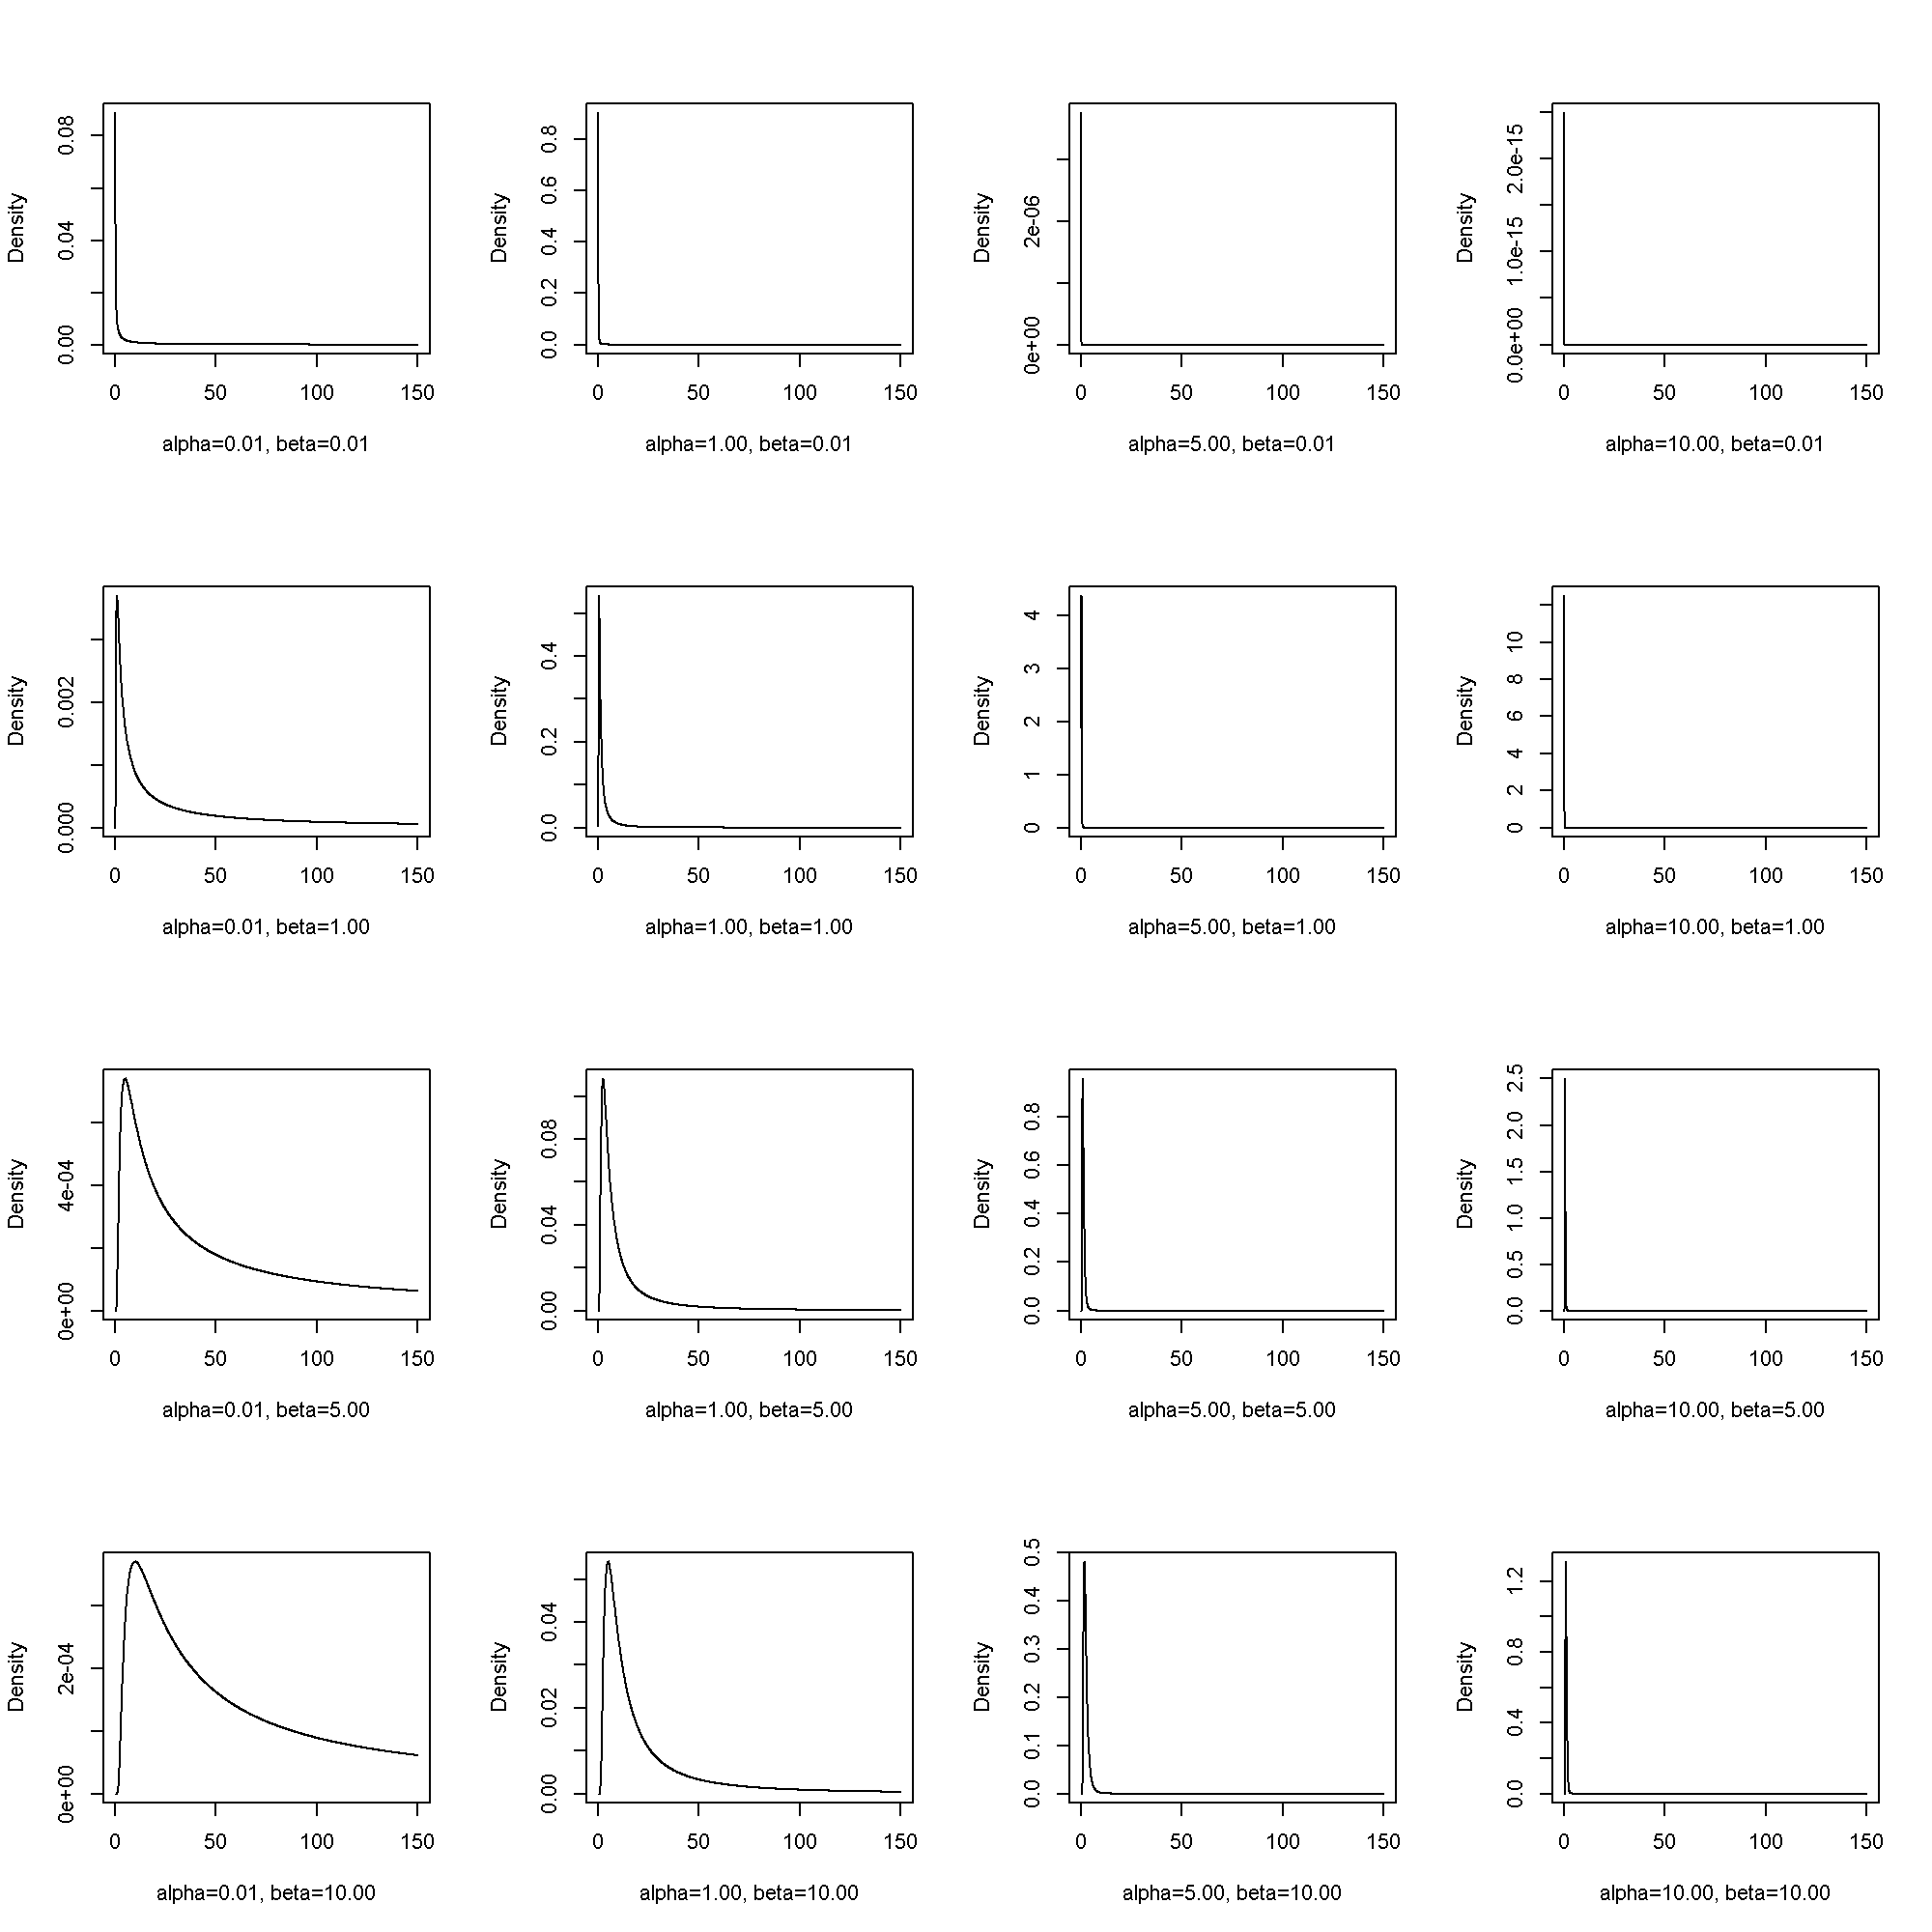
Here we briefly cover some example common prior distributions. Distributions are based on a probability density function or PDF for continuous distributions and a probability mass function for discrete distributions. We also try to show what the distributions look like for different values of their parameters.
To make viewing these distributions easier, here is a little function to plot and label them.
fplot <- function(x, params, pdf) {
  params <- do.call(expand.grid, params)

  k <- nrow(params)

  nc <- ceiling(sqrt(k))
  nr <- ceiling(k / nc)
  stopifnot(k <= nc * nr)

  labeller <- function(params) {
    style <- paste(paste0(names(params), "=%2.2f"), collapse = ", ")
    do.call(sprintf, c(fmt = style, params))
  }

  par(mfrow = c(nr, nc))
  lapply(1:k, function(i) {
    y <- do.call(pdf, c(list(x), params[i, ]))
    plot(x = x, y = y, ylab = "Density", xlab = labeller(params[i, ]), type = "l")
  })
  return(invisible(NULL))
}
The normal distribution has two parameters, (mu) or the location parameter, and (sigma) or the scale parameter.
\[ PDF(x; mu, sigma^2) = frac{1}{sigmasqrt{2pi}}e^{-frac{1}{2}left(frac{x – mu}{sigma}right)^{2}} \]
fplot(
  x = seq(from = -50, to = 50, by = .1),
  params = list(mean = c(-10, -5, 5, 10), sd = c(.1, 1, 10, 100)),
  pdf = dnorm)
Gamma
The gamma distribution has two parameters, (theta), scale, and (k), shape.
[ PDF(x; theta, k) = frac{1}{Gamma(k)theta^{k}}x^{k – 1}e^{-frac{x}{theta}} ]
Equivalently, the model can be parameterized with (alpha) and (beta).
\[ PDF(x; alpha, beta) = frac{beta^{alpha}}{Gamma(alpha)}x^{alpha – 1}e^{-beta x} \]
fplot(
  x = seq(from = .1, to = 150, by = .1),
  params = list(scale = c(.01, 1, 5, 10), shape = c(.01, 1, 5, 10)),
  pdf = dgamma)
Inverse Gamma
The inverse gamma distribution has two parameters, (alpha) and (beta). [ PDF(x; alpha, beta) = frac{beta^{alpha}}{Gamma(alpha)} x^{-alpha – 1} e^{-frac{beta}{x}} ]
require(pscl)
fplot(
  x = seq(from = .1, to = 150, by = .1),
  params = list(alpha = c(.01, 1, 5, 10), beta = c(.01, 1, 5, 10)),
  pdf = densigamma)
Beta
Coming soon
Inverse Wishart
Coming soon
Continuous Outcomes
The first type of models we will look at have continuous outcomes that are normally distributed. That is our basic model is:
\[ hat{y} sim mathcal{N}(hat{mu}, hat{sigma^2_e}) \]
where
\[ hat{mu} = g(Xhat{beta}) \]
and (g(cdot)) is just the identity function.
Single Level Model
We use MCMCglmm to estimate
the model, which is a sort of canned Bayesian approach. It is in a Bayesian framework,
although you have relatively little control over the priors. All fixed effects use normal priors,
but you can set the mean, mu and variance, V. Here we show a relatively
uninformative prior using a normal with large variance. Thus there is low density across a large
parameter space reflecting our uncertainty or lack of prior specification of plausible parameter
values. Note that we specify the mean and variance for every fixed effect, including the intercept,
if included.
Next, we specify the prior for the residual variance, which is always inverse Wishart.
The small nu parameter again leads to a relatively uninformative prior.
require(foreign)
dat <- read.spss("http://statistics.ats.ucla.edu/stat/data/hsbdemo.sav",
  to.data.frame=TRUE)
## Warning: C:UsersjwileyAppDataLocalTempRtmpc53SO9filebec68002005:
## Unrecognized record type 7, subtype 18 encountered in system file
dat$cid <- factor(dat$cid)
head(dat)
##    id female    ses schtyp     prog read write math science socst
## 1  45 female    low public vocation   34    35   41      29    26
## 2 108   male middle public  general   34    33   41      36    36
## 3  15   male   high public vocation   39    39   44      26    42
## 4  67   male    low public vocation   37    37   42      33    32
## 5 153   male middle public vocation   39    31   40      39    51
## 6  51 female   high public  general   42    36   42      31    39
##         honors awards cid
## 1 not enrolled      0   1
## 2 not enrolled      0   1
## 3 not enrolled      0   1
## 4 not enrolled      0   1
## 5 not enrolled      0   1
## 6 not enrolled      0   1
require(MCMCglmm)
m1 <- MCMCglmm(write ~ read, data = dat,
  prior = list(
    B = list(mu = c(0, 0), V = diag(2) * 1e5),
    R = list(V = 1, nu = .002)),
  nitt = 11000, thin = 1, burnin = 1000, verbose=FALSE)

autocorr(m1$VCV)
## , , units
##
##           units
## Lag 0  1.000000
## Lag 1  0.003919
## Lag 5  0.014092
## Lag 10 0.000891
## Lag 50 0.008904
autocorr(m1$Sol)
## , , (Intercept)
##
##        (Intercept)     read
## Lag 0      1.00000 -0.98124
## Lag 1      0.01039 -0.00793
## Lag 5     -0.00963  0.00857
## Lag 10    -0.00484  0.00512
## Lag 50    -0.00615  0.00405
##
## , , read
##
##        (Intercept)     read
## Lag 0     -0.98124  1.00000
## Lag 1     -0.01100  0.00846
## Lag 5      0.00931 -0.00846
## Lag 10     0.00583 -0.00620
## Lag 50     0.00538 -0.00365
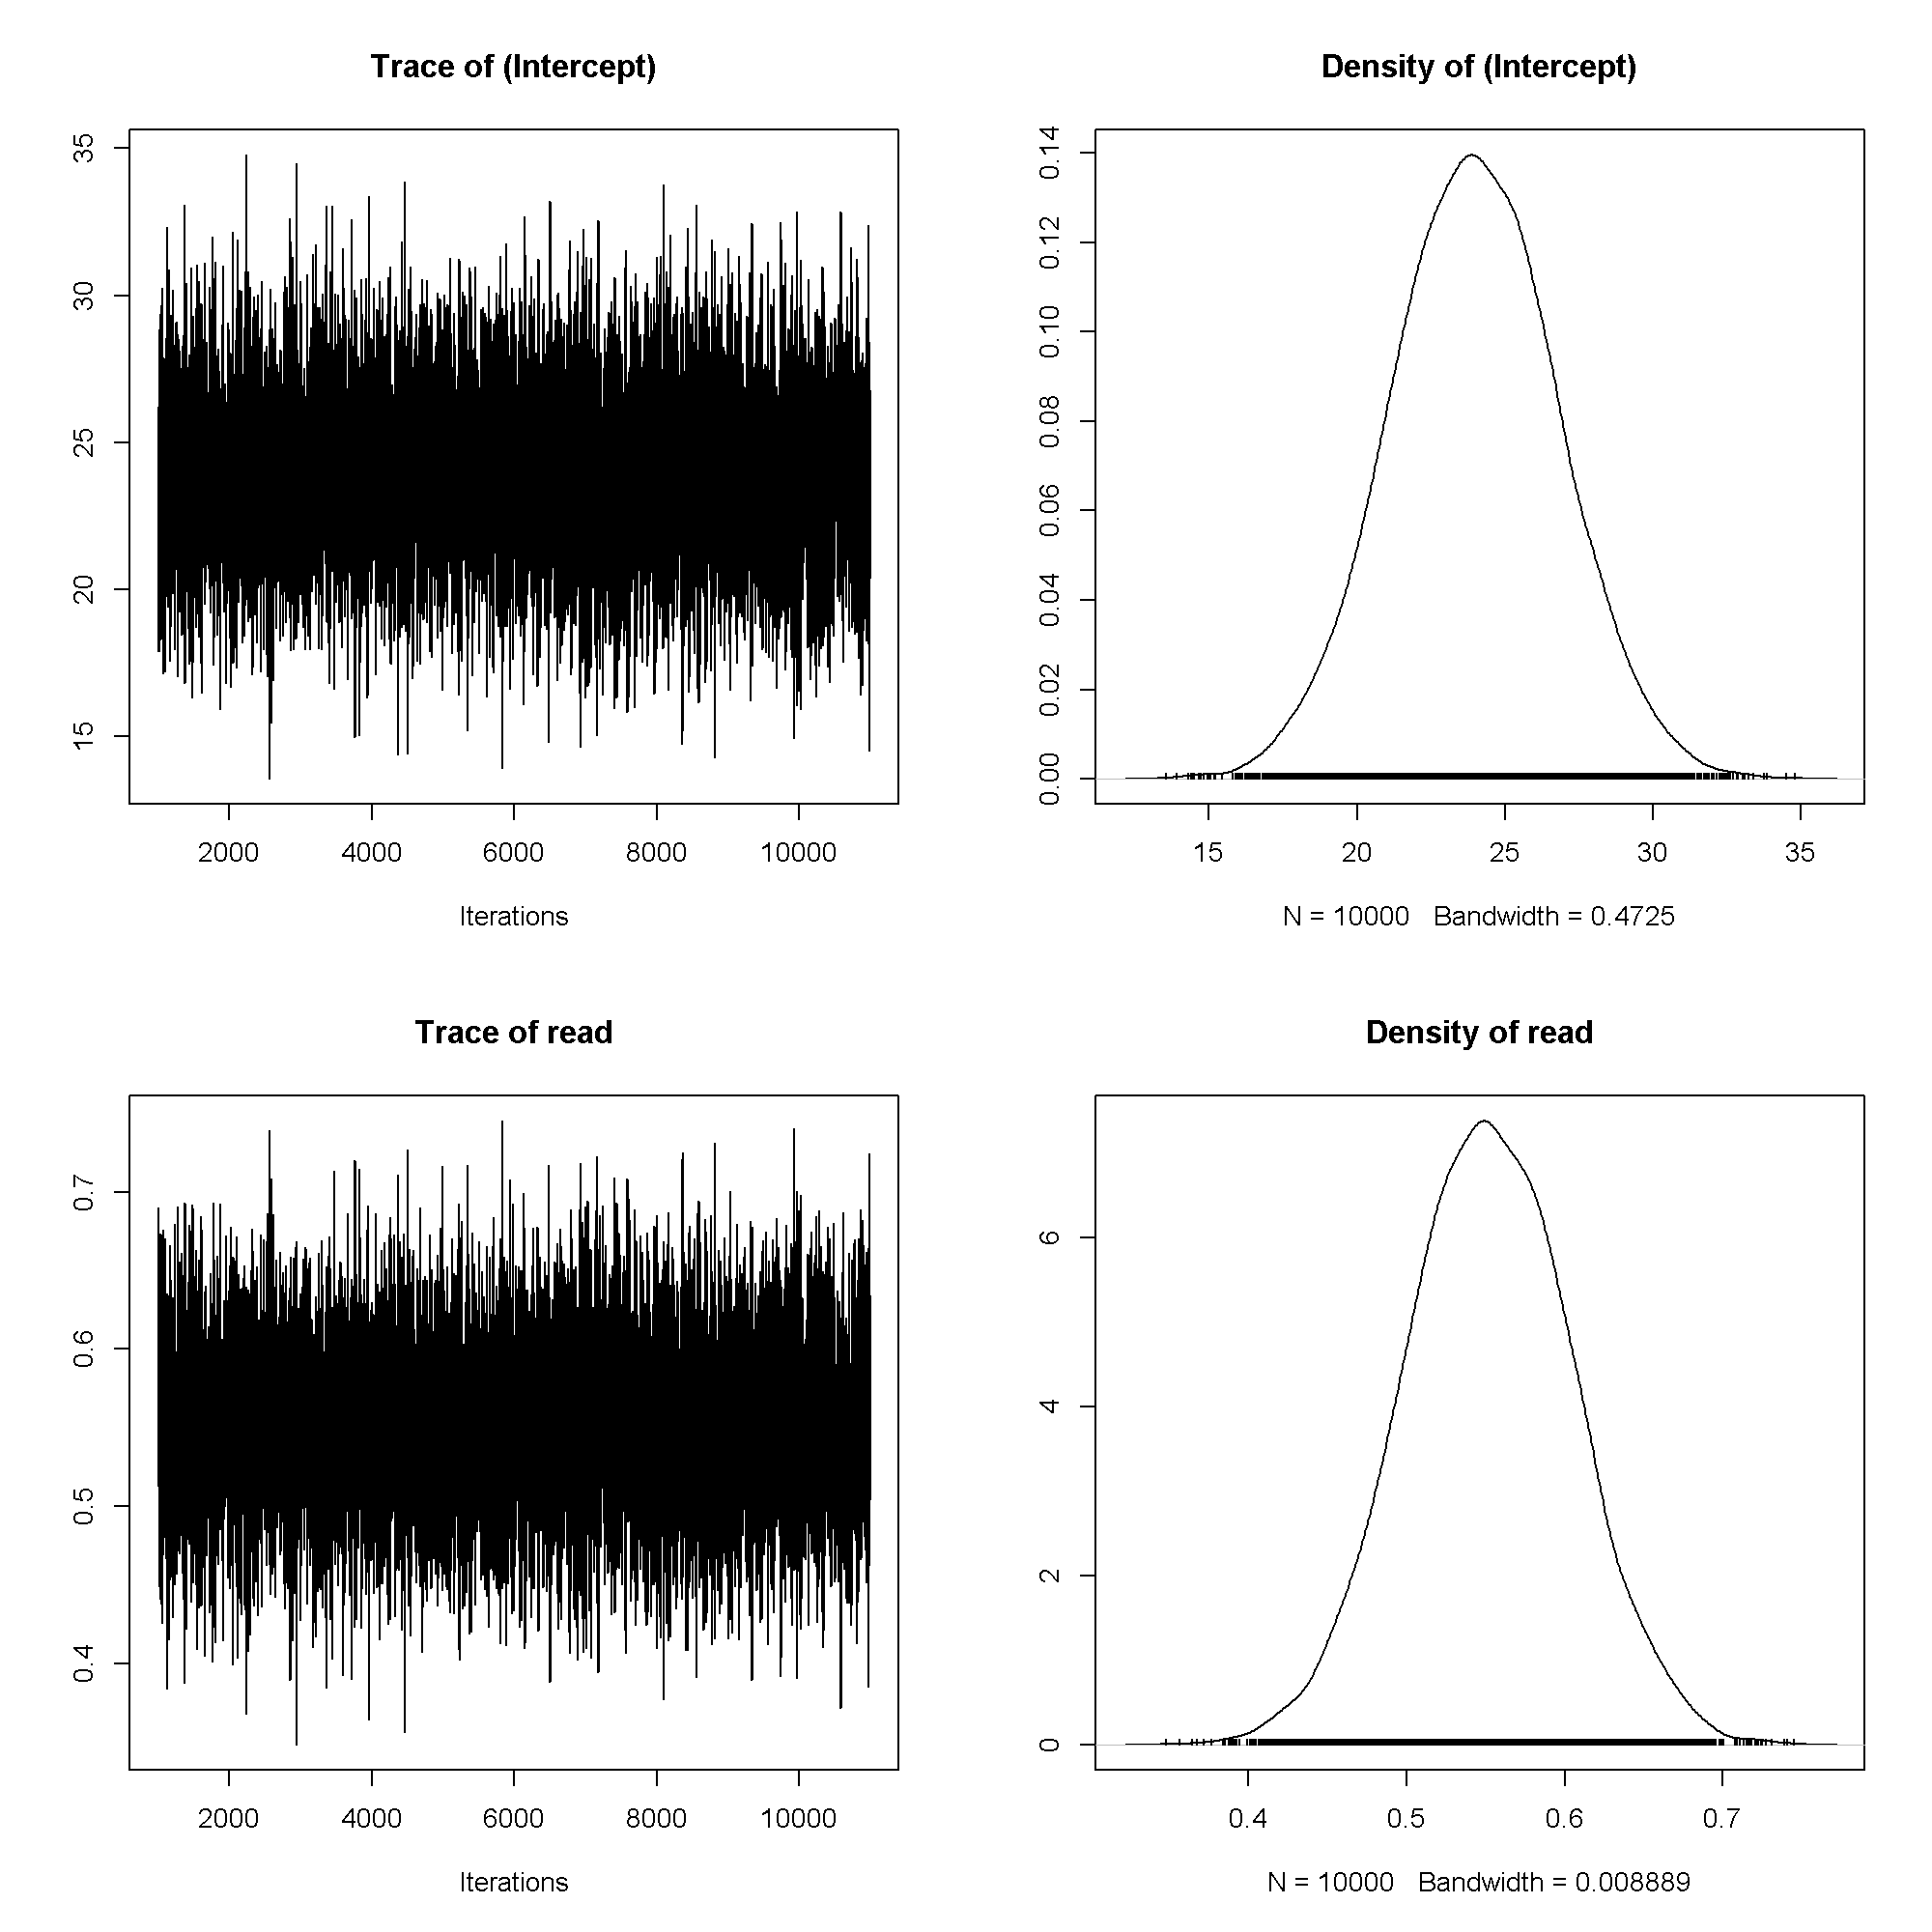
plot(m1$Sol)
plot(m1$VCV)
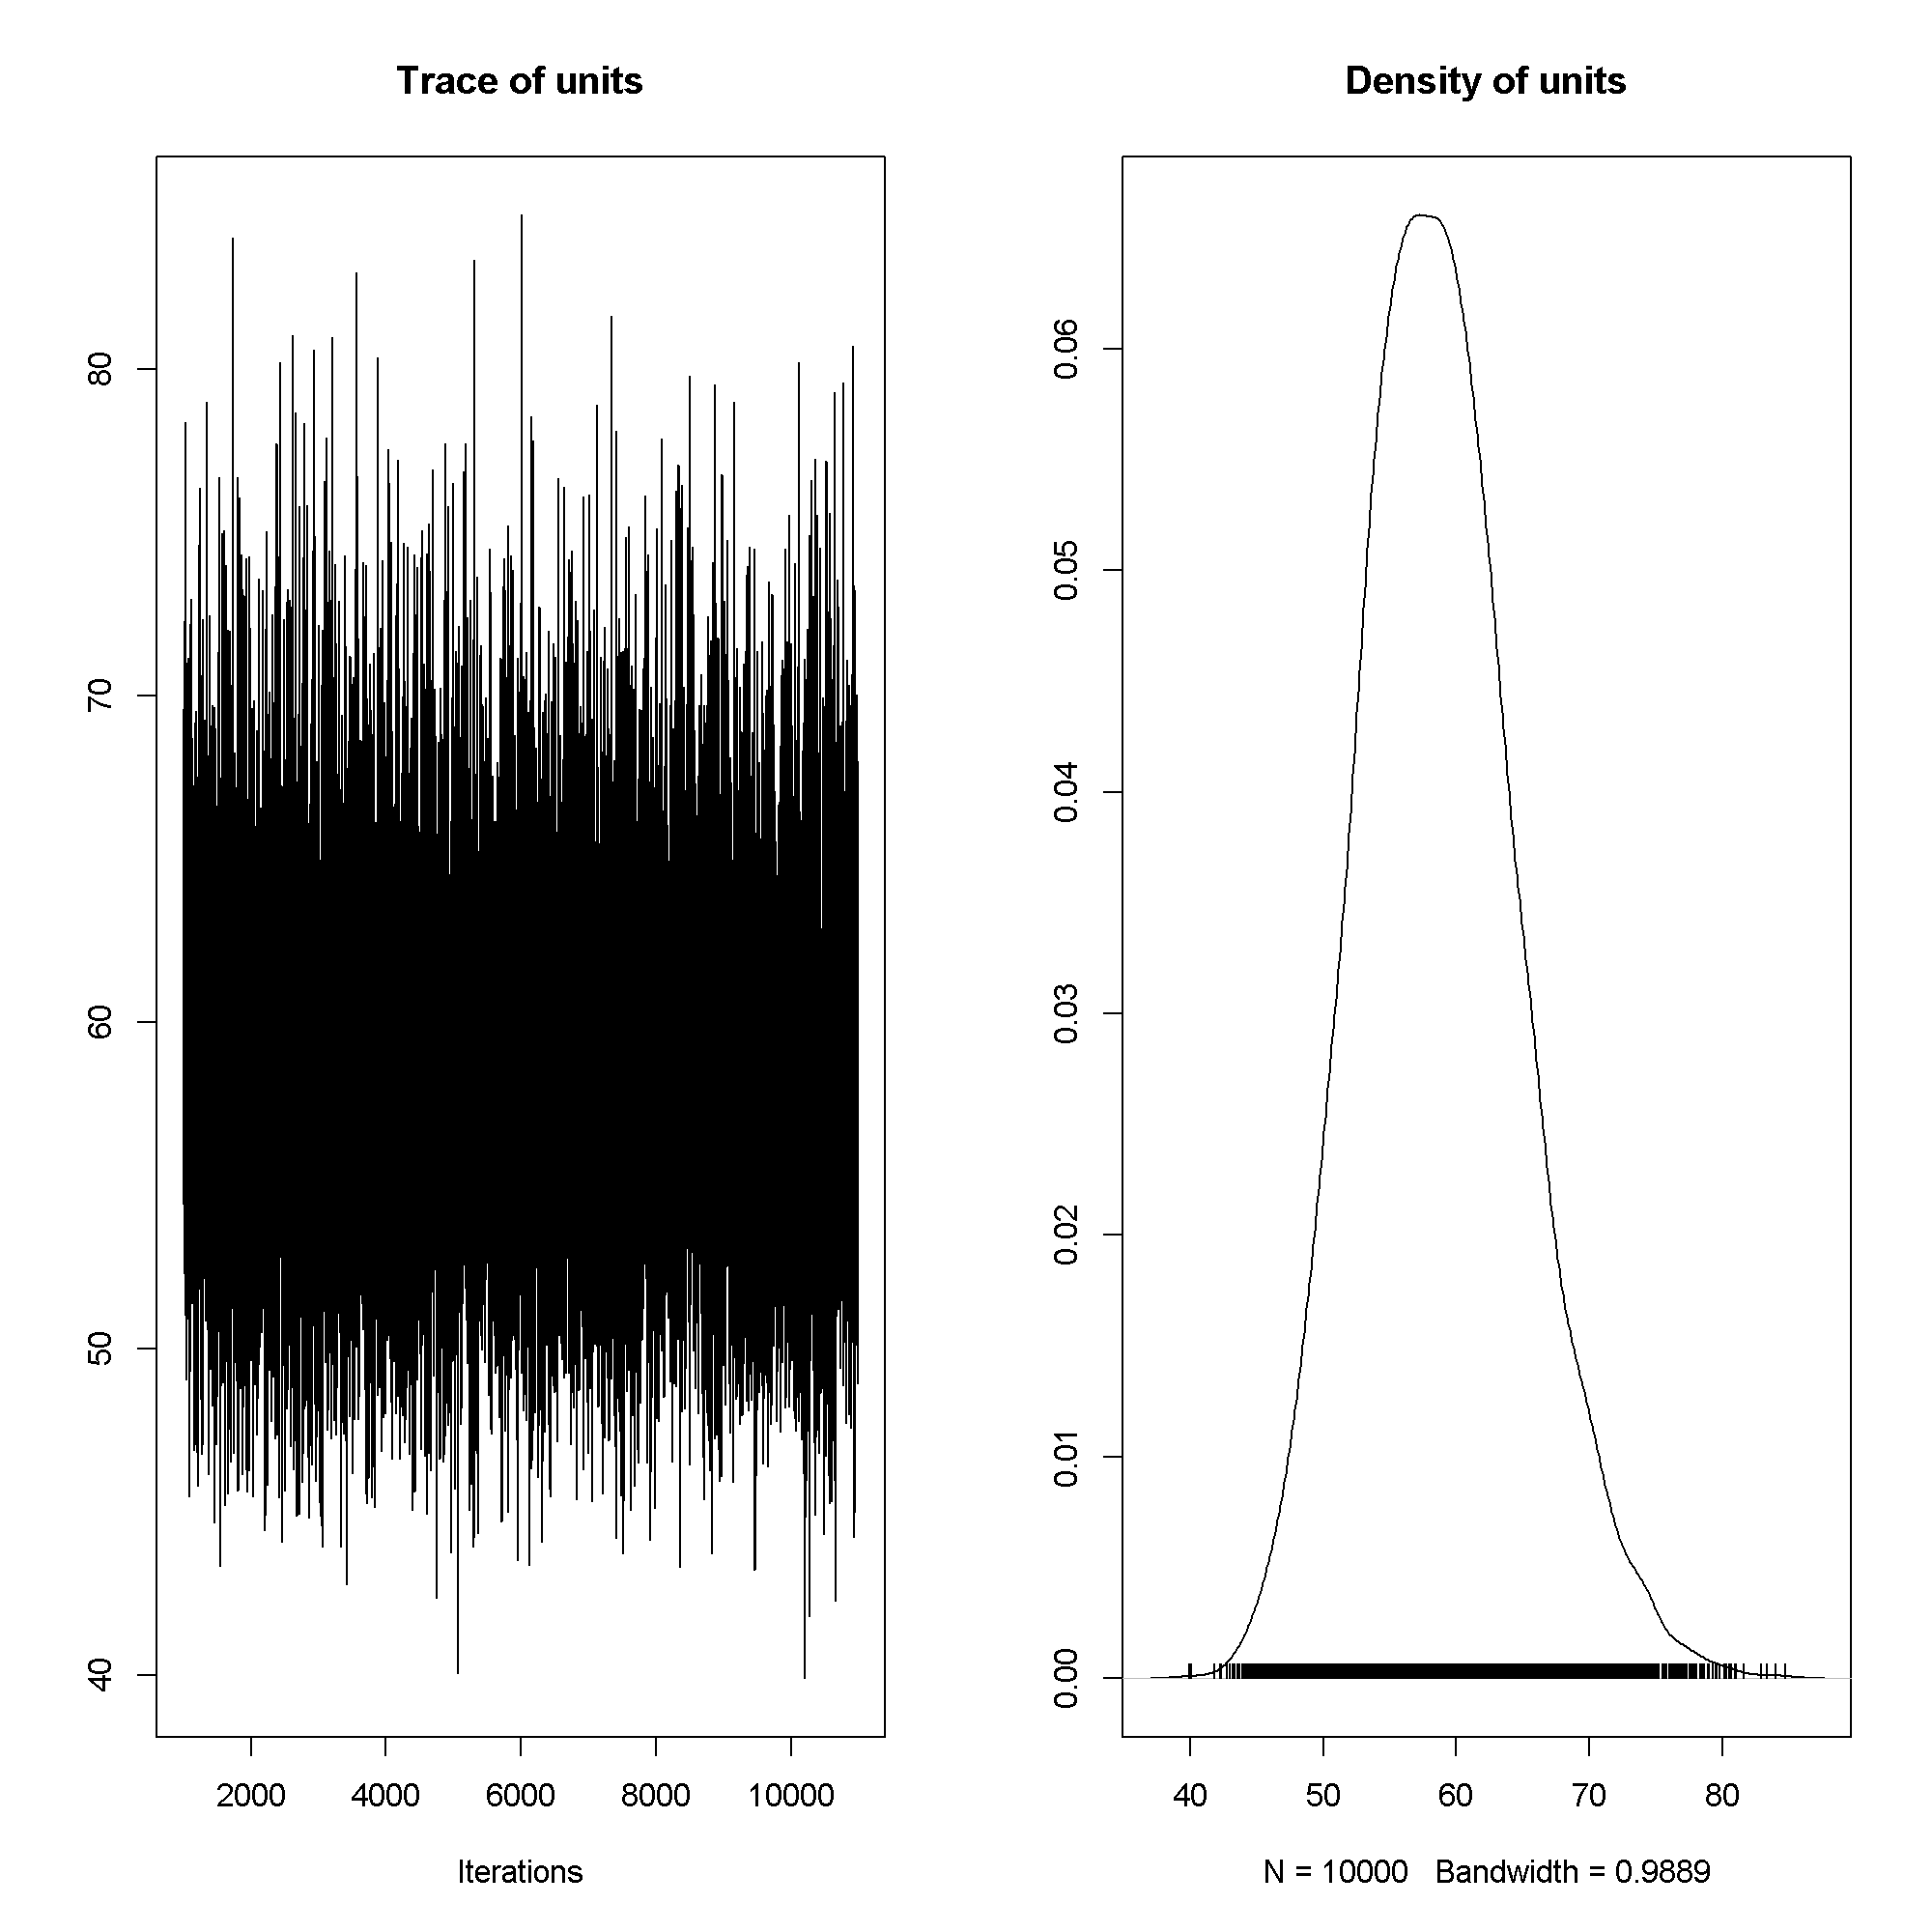
summary(m1)
##
##  Iterations = 1001:11000
##  Thinning interval  = 1
##  Sample size  = 10000
##
##  DIC: 1384
##
##  R-structure:  ~units
##
##       post.mean l-95% CI u-95% CI eff.samp
## units      58.7     47.4     70.7    10000
##
##  Location effects: write ~ read
##
##             post.mean l-95% CI u-95% CI eff.samp  pMCMC
## (Intercept)    23.963   18.677   29.709    10000
Now we will fit a model with another predictor. Note that female
is a categorical variable. R takes care of dummy coding for us.
m2 <- MCMCglmm(write ~ read + female, data = dat,
  prior = list(
    B = list(mu = c(0, 0, 0), V = diag(3) * 1e5),
    R = list(V = 1, nu = .002)),
  nitt = 11000, thin = 1, burnin = 1000, verbose=FALSE)

autocorr(m2$VCV)
## , , units
##
##           units
## Lag 0   1.00000
## Lag 1   0.01502
## Lag 5   0.00916
## Lag 10 -0.00259
## Lag 50 -0.00375
autocorr(m2$Sol)
## , , (Intercept)
##
##        (Intercept)     read femalefemale
## Lag 0     1.000000 -0.96224     -0.26010
## Lag 1     0.003370 -0.00131     -0.00726
## Lag 5     0.005625 -0.00953      0.01063
## Lag 10   -0.002035  0.00145      0.01574
## Lag 50   -0.000812  0.00434     -0.01057
##
## , , read
##
##        (Intercept)     read femalefemale
## Lag 0     -0.96224  1.00000      0.06209
## Lag 1     -0.00622  0.00432      0.00915
## Lag 5     -0.00822  0.01068     -0.00794
## Lag 10     0.00220 -0.00217     -0.01475
## Lag 50     0.00283 -0.00524      0.00605
##
## , , femalefemale
##
##        (Intercept)      read femalefemale
## Lag 0    -0.260098  0.062087     1.000000
## Lag 1     0.010272 -0.011330    -0.000191
## Lag 5     0.000731  0.003762    -0.015958
## Lag 10    0.003838 -0.000396    -0.011112
## Lag 50   -0.001492  0.000743     0.009723
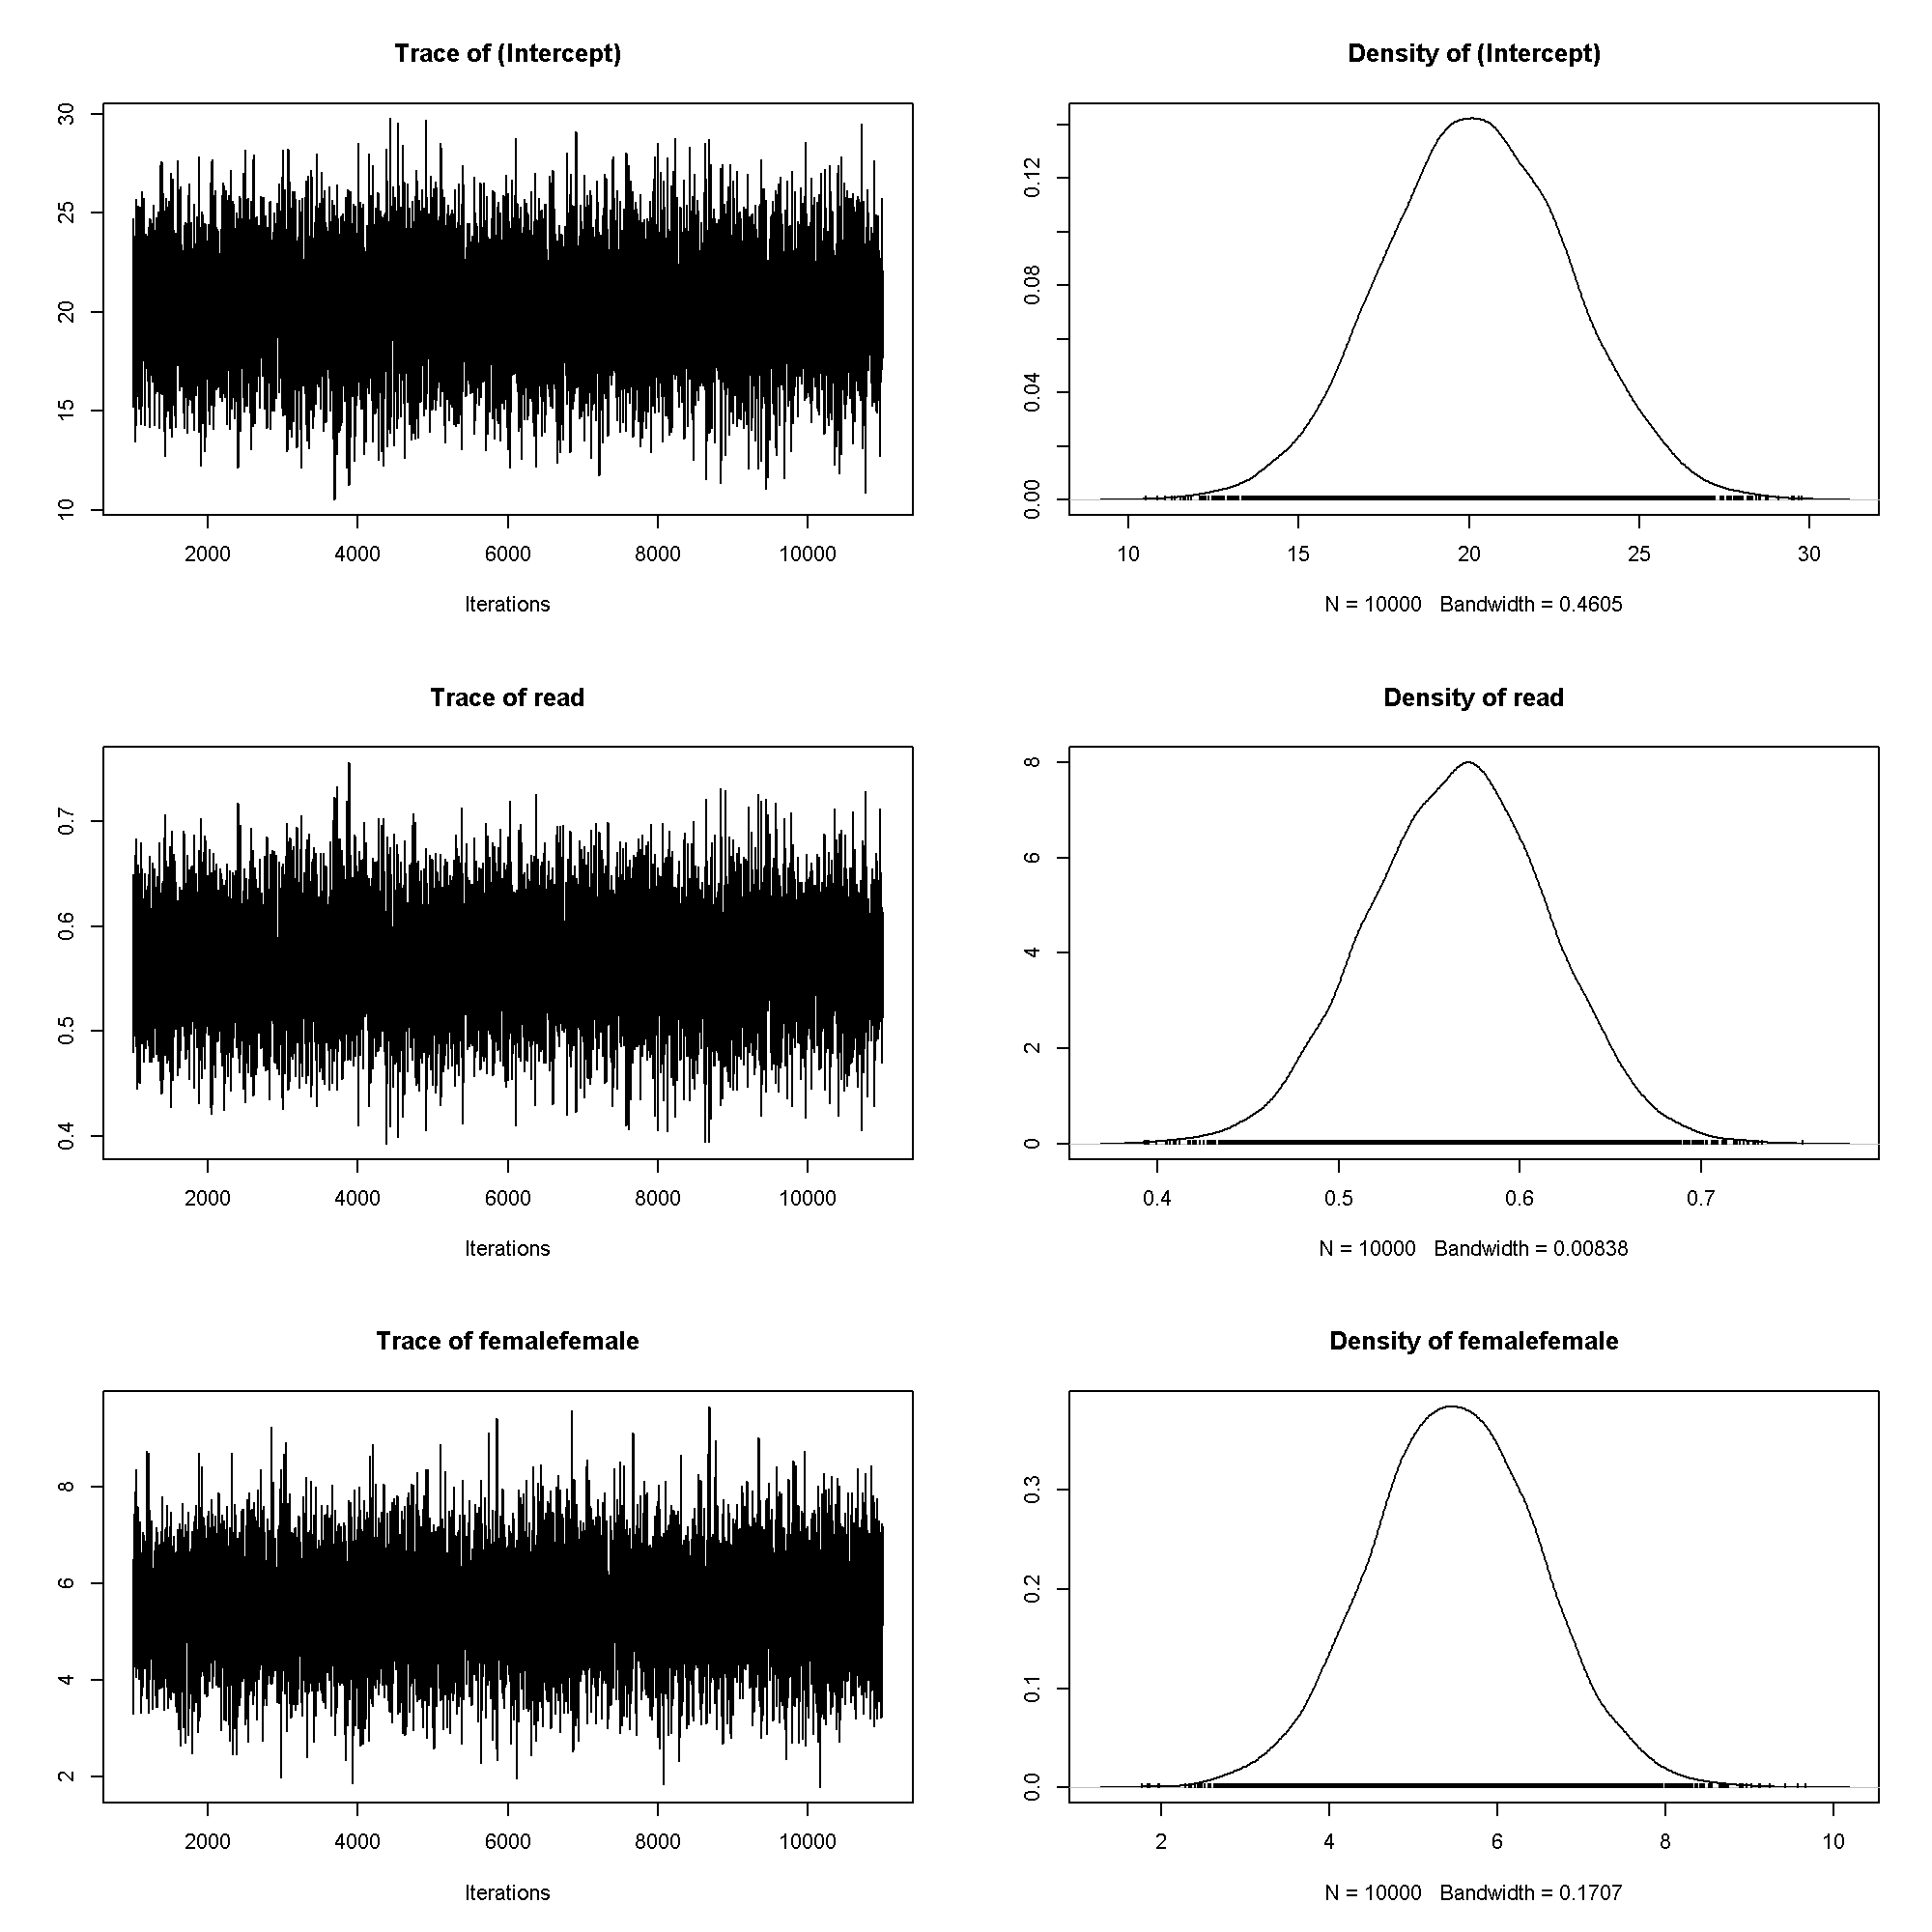
plot(m2$Sol)
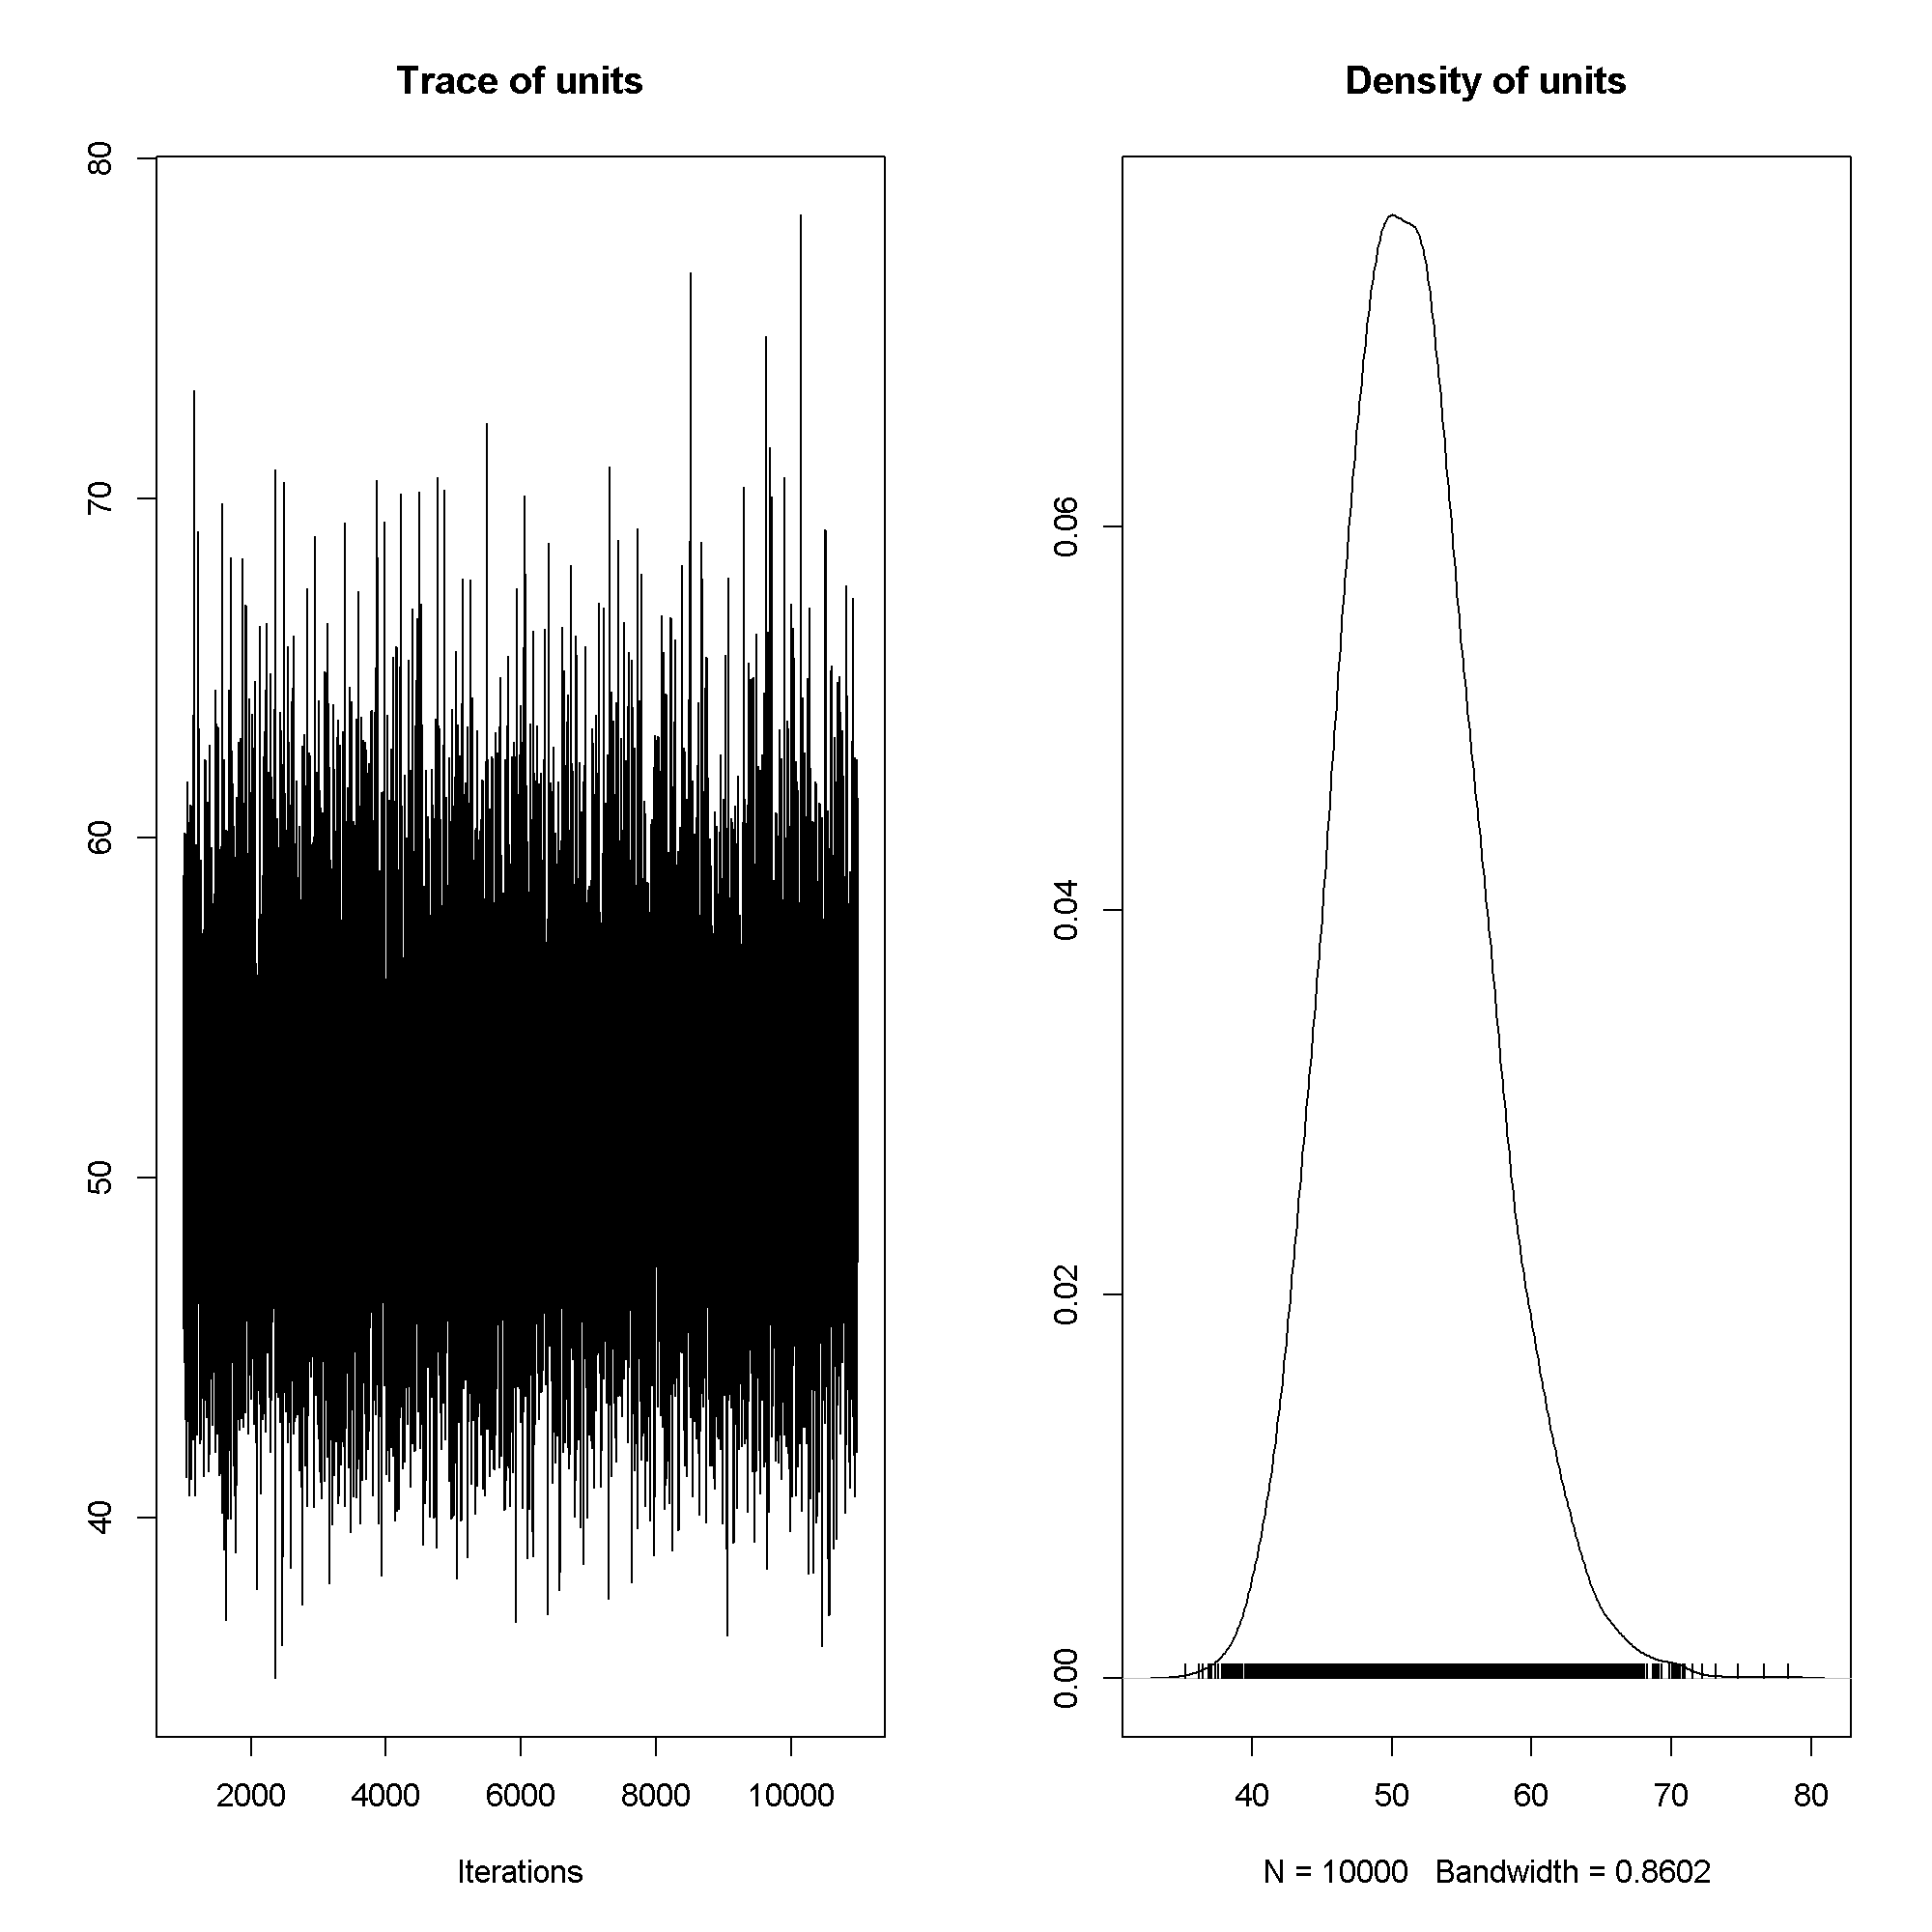
plot(m2$VCV)
summary(m2)
##
##  Iterations = 1001:11000
##  Thinning interval  = 1
##  Sample size  = 10000
##
##  DIC: 1358
##
##  R-structure:  ~units
##
##       post.mean l-95% CI u-95% CI eff.samp
## units      51.4     41.8       62     9703
##
##  Location effects: write ~ read + female
##
##              post.mean l-95% CI u-95% CI eff.samp  pMCMC
## (Intercept)     20.210   14.895   25.598    10000
Hierarchical Models
Now we are going to fit another normal model, but this one is hierarchical. The model is simple, including only a random intercept. We use more iterations because of the random effects.
m3 <- MCMCglmm(write ~ read + female, data = dat,
  random = ~ cid,
  prior = list(
    B = list(mu = c(0, 0, 0), V = diag(3) * 1e5),
    R = list(V = 1, nu = .002),
    G = list(
      G1 = list(V = 1, nu = .002)
    )),
  nitt = 110000, thin = 10, burnin = 10000, verbose=FALSE)

autocorr(m3$Sol)
## , , (Intercept)
##
##         (Intercept)     read femalefemale
## Lag 0       1.00000 -0.85081     -0.20234
## Lag 10      0.00935 -0.01571      0.00811
## Lag 50      0.01055 -0.00564     -0.01228
## Lag 100    -0.00584  0.00133      0.00705
## Lag 500    -0.01037  0.01408     -0.00635
##
## , , read
##
##         (Intercept)      read femalefemale
## Lag 0      -0.85081  1.000000     0.135299
## Lag 10     -0.00884  0.011146    -0.010516
## Lag 50     -0.01576  0.013617     0.021852
## Lag 100     0.00243  0.000506     0.000422
## Lag 500     0.01300 -0.017286     0.000991
##
## , , femalefemale
##
##         (Intercept)     read femalefemale
## Lag 0      -0.20234  0.13530      1.00000
## Lag 10      0.01182 -0.00835     -0.00980
## Lag 50      0.00131 -0.00405      0.00439
## Lag 100     0.01855 -0.01393     -0.01954
## Lag 500    -0.01508  0.00689      0.00945
autocorr(m3$VCV)
## , , cid
##
##              cid     units
## Lag 0    1.00000 -0.060213
## Lag 10   0.00158 -0.004068
## Lag 50   0.01345 -0.013582
## Lag 100 -0.00257 -0.000831
## Lag 500  0.00507  0.014808
##
## , , units
##
##              cid     units
## Lag 0   -0.06021  1.000000
## Lag 10  -0.00166  0.004646
## Lag 50  -0.00989 -0.000598
## Lag 100  0.00585  0.002254
## Lag 500  0.00235  0.013729
plot(m3$Sol)
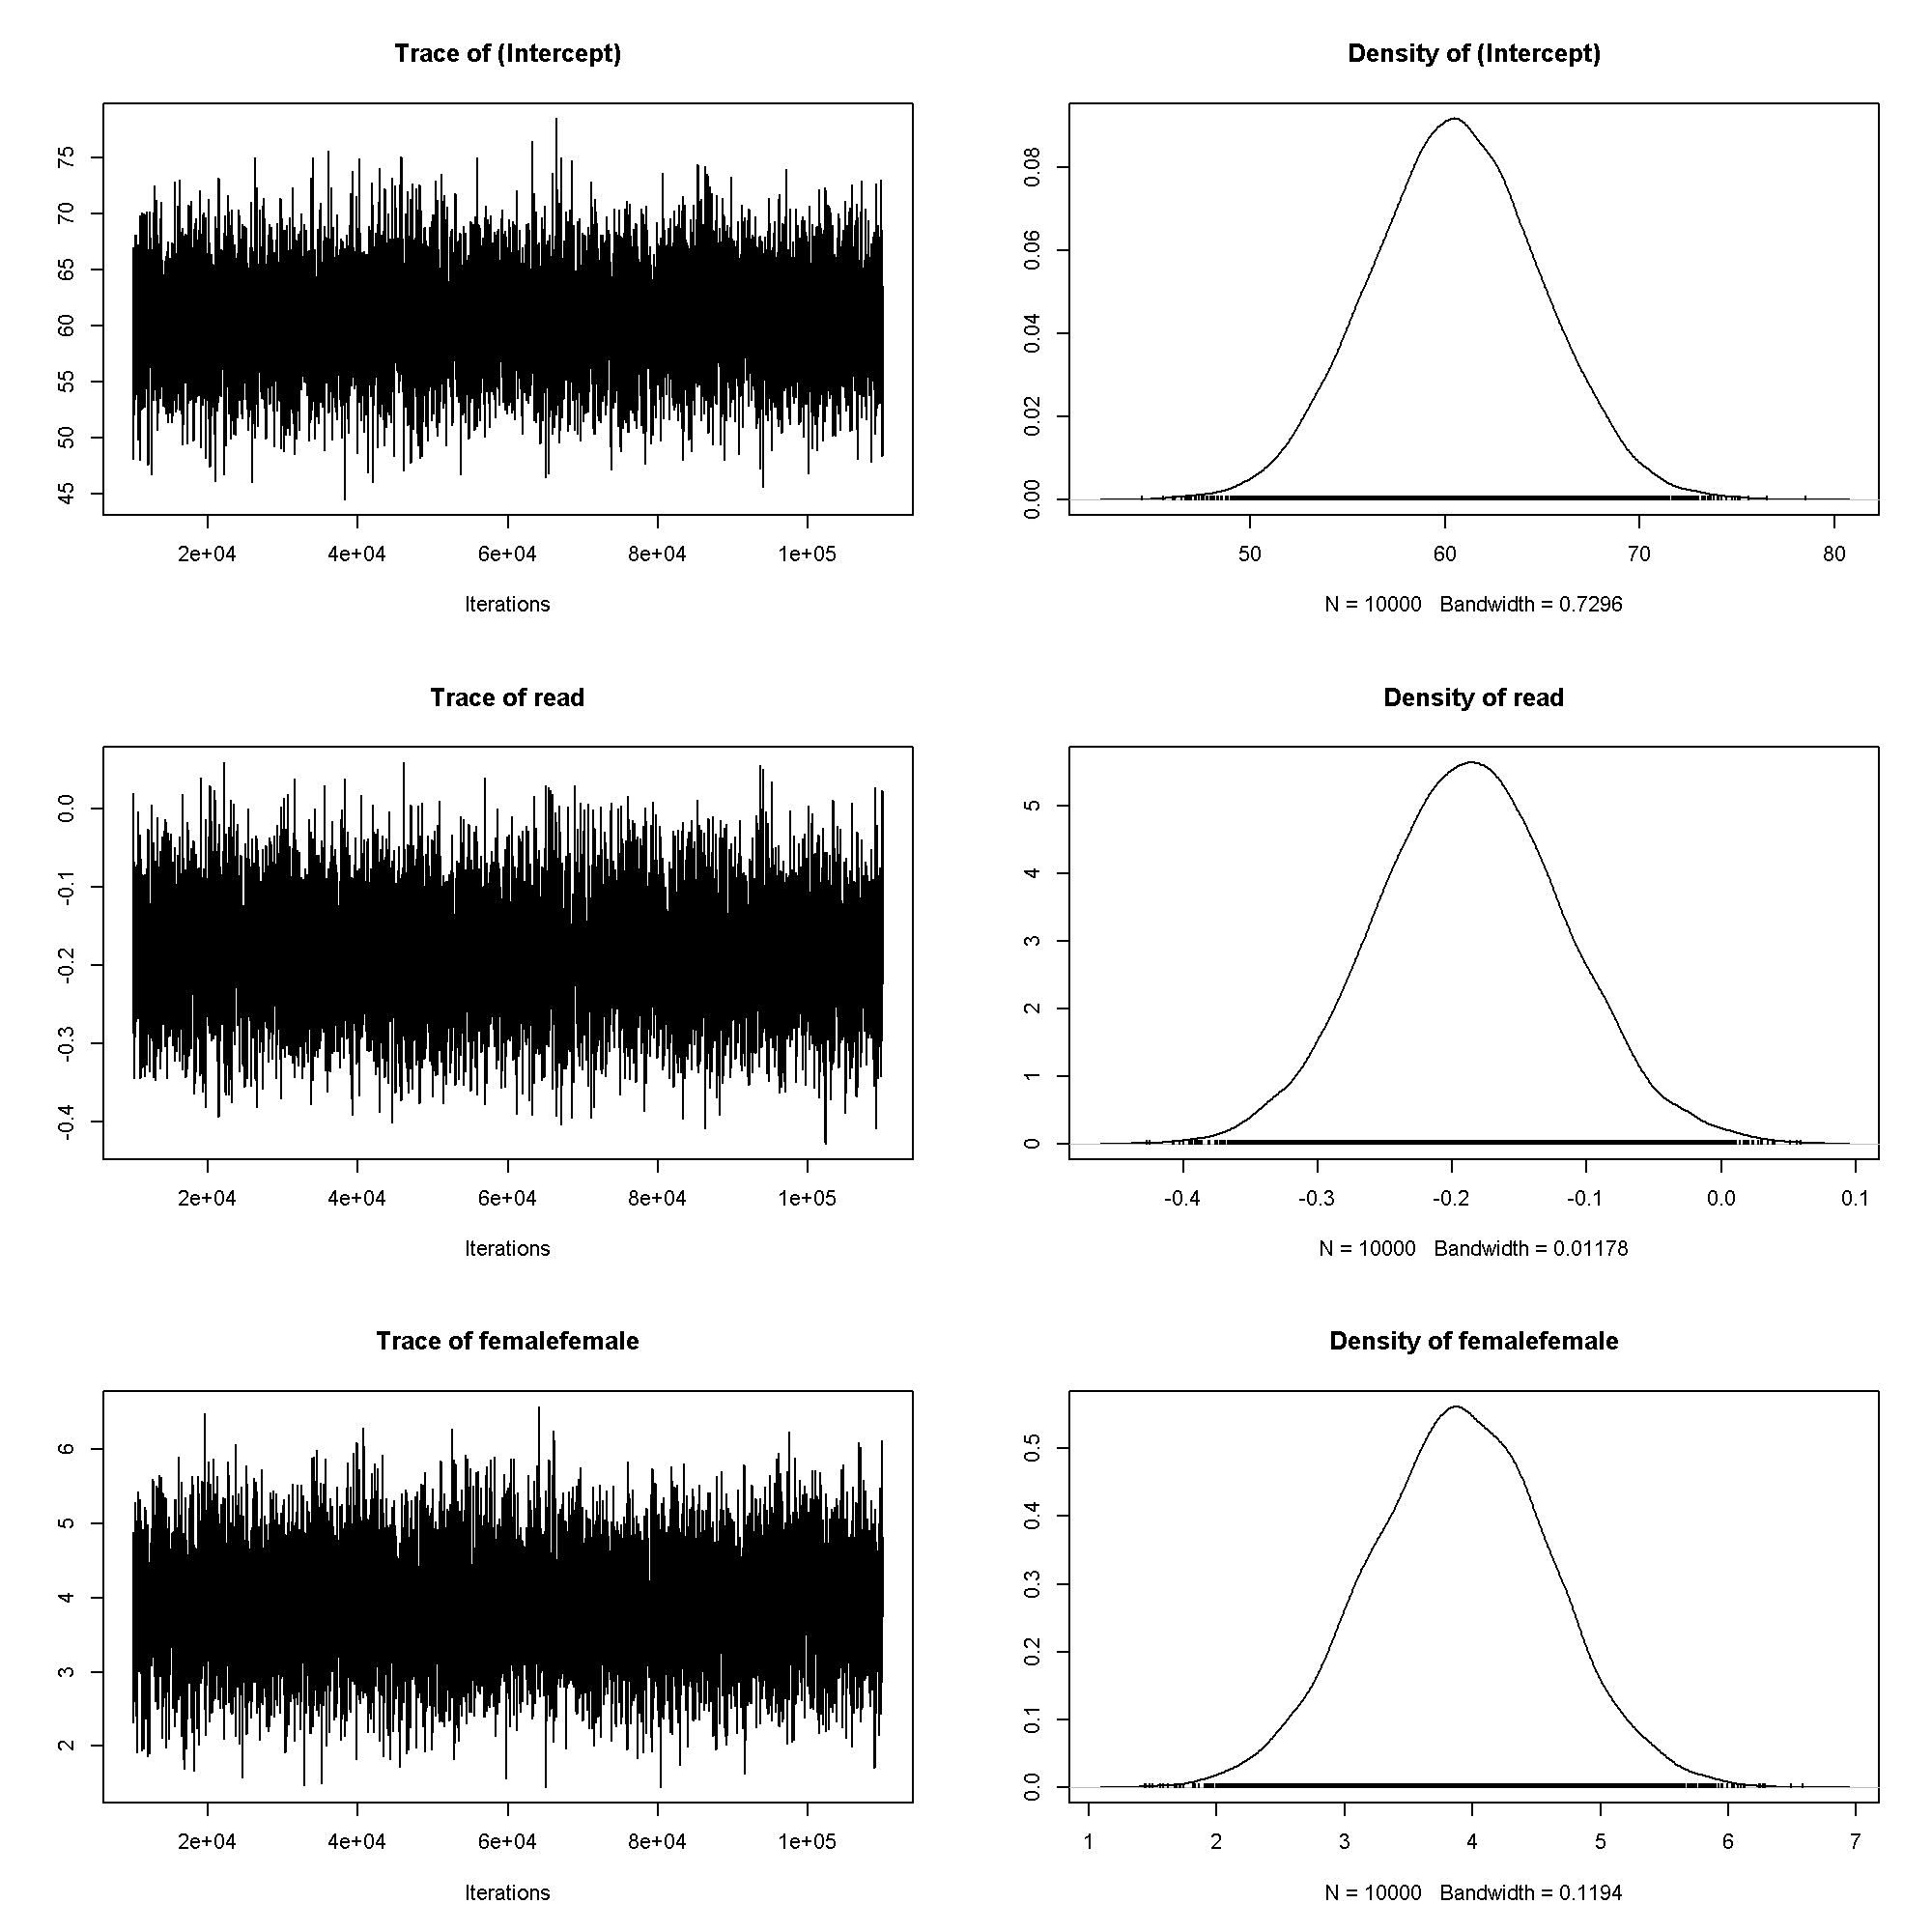
plot(m3$VCV)
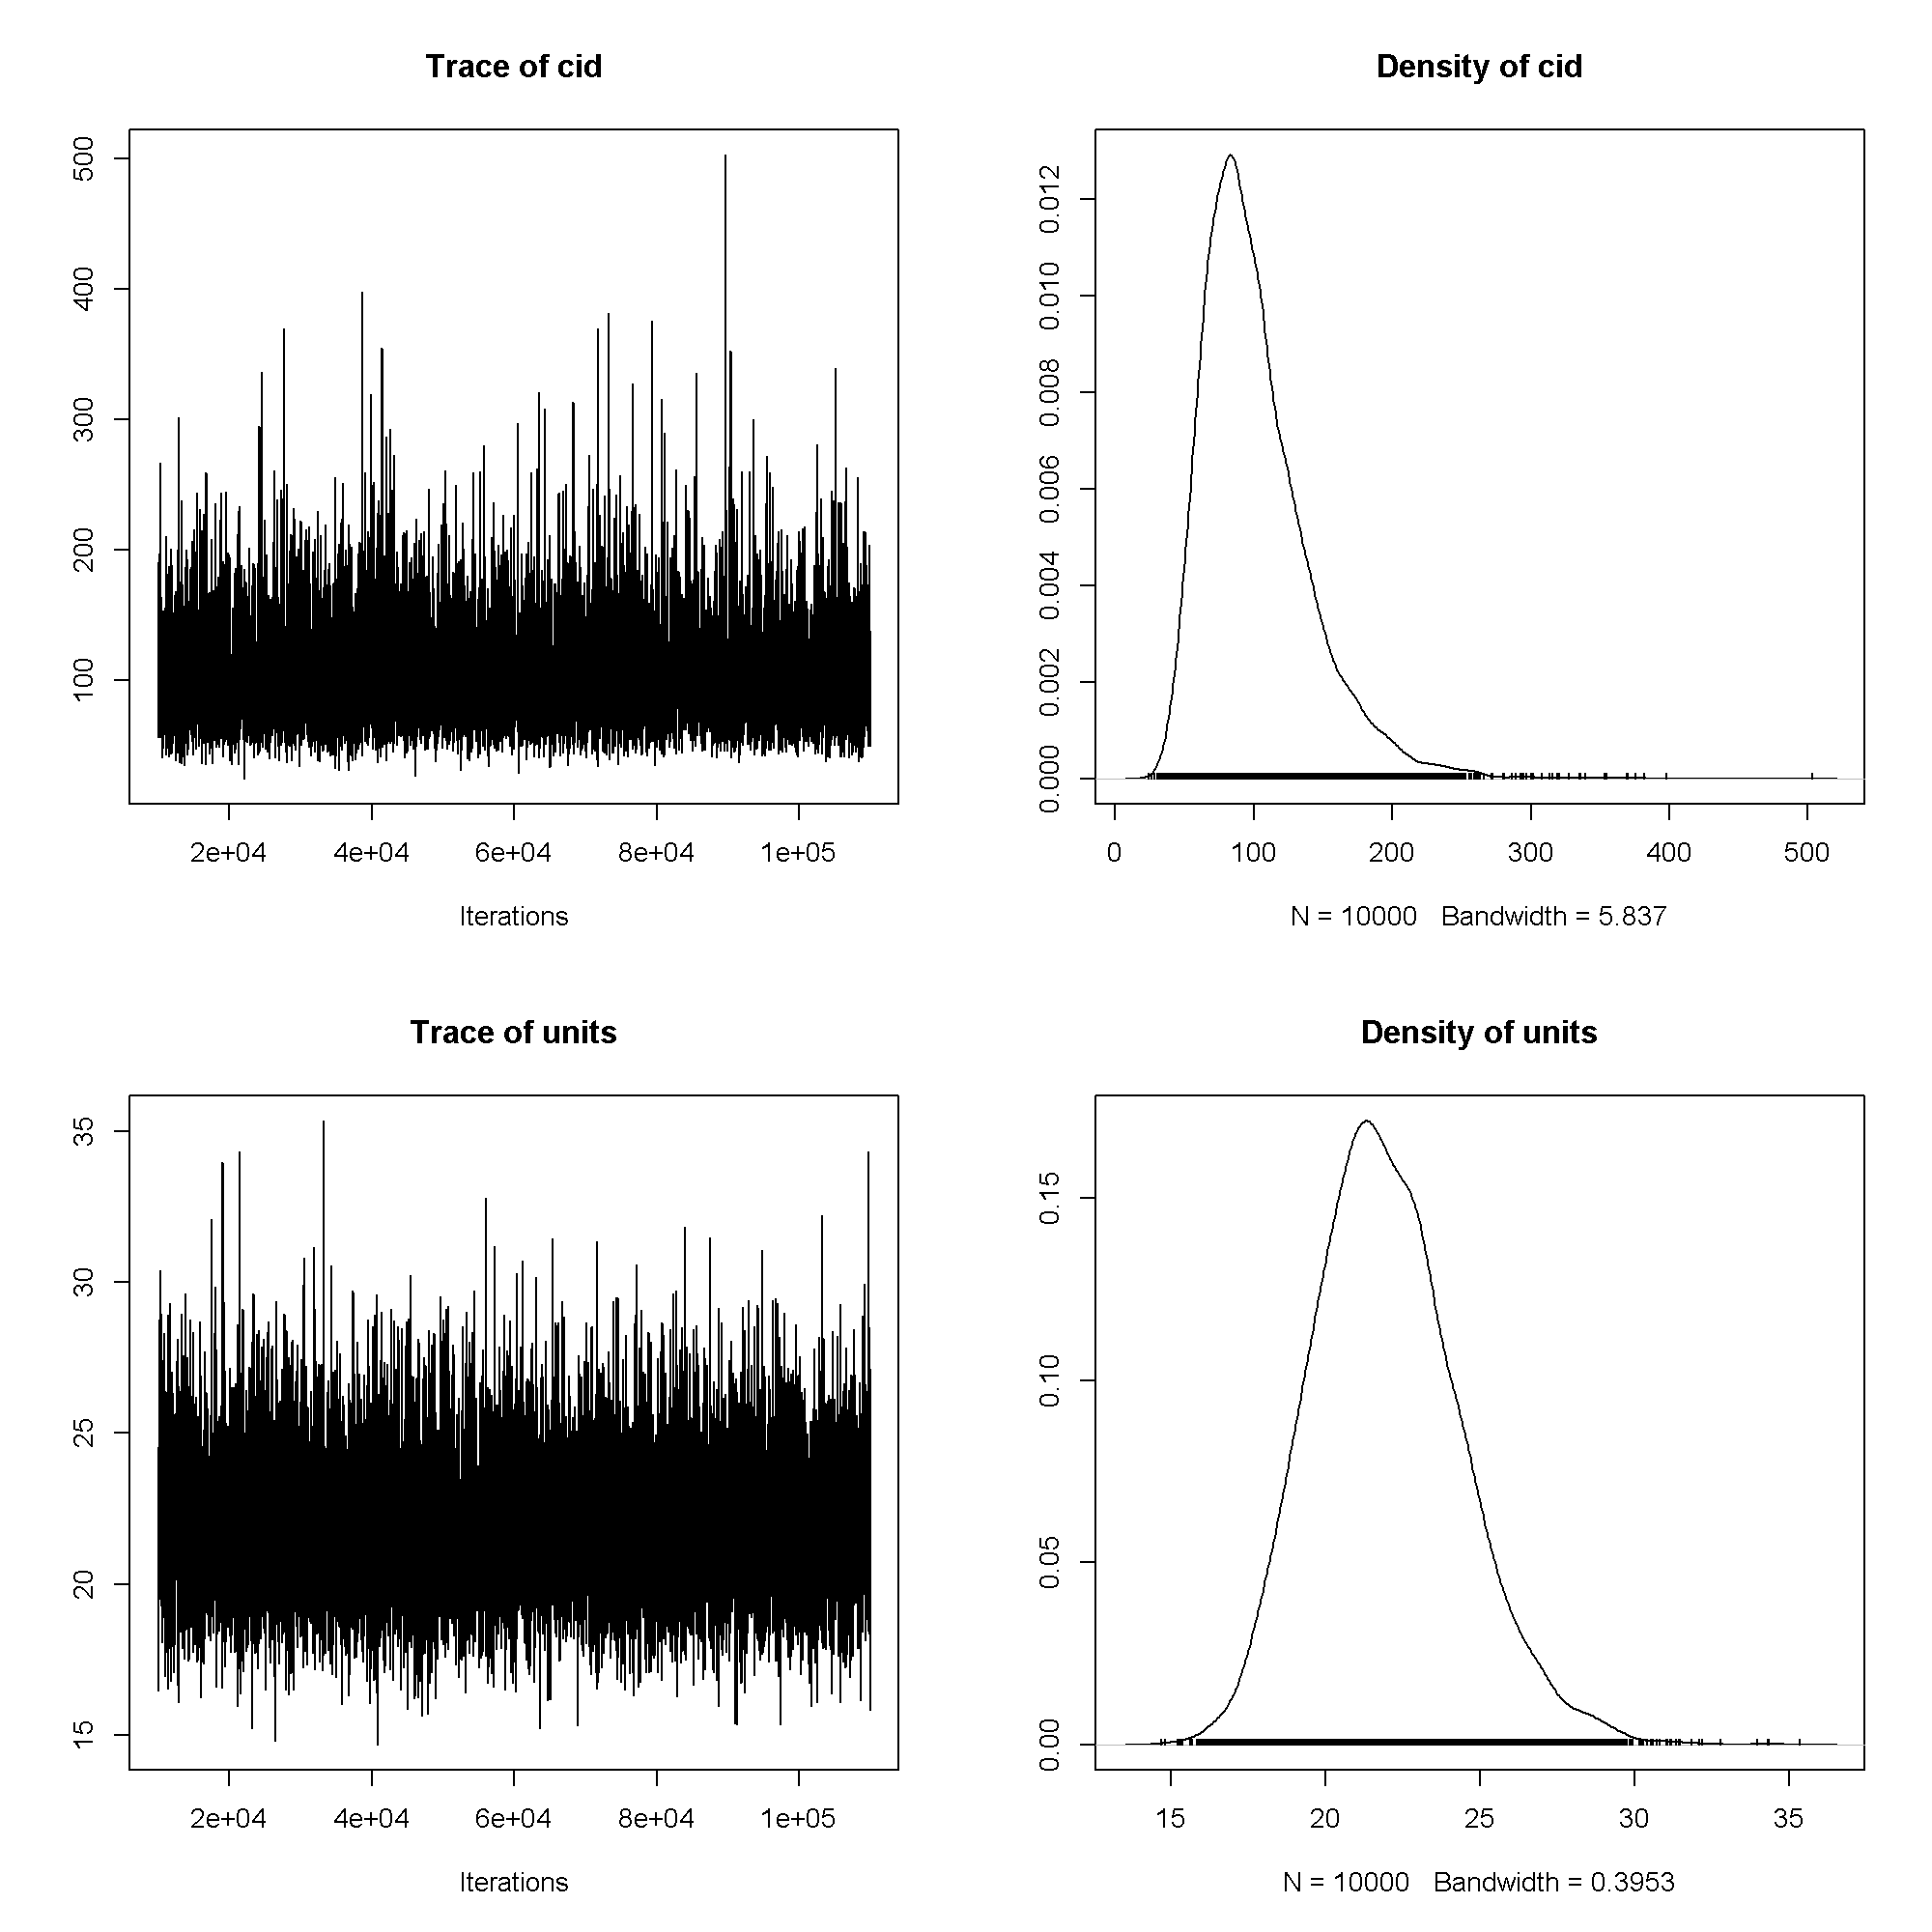
summary(m3)
##
##  Iterations = 10001:109991
##  Thinning interval  = 10
##  Sample size  = 10000
##
##  DIC: 1207
##
##  G-structure:  ~cid
##
##     post.mean l-95% CI u-95% CI eff.samp
## cid       102       40      179    10000
##
##  R-structure:  ~units
##
##       post.mean l-95% CI u-95% CI eff.samp
## units        22     17.6     26.8    10000
##
##  Location effects: write ~ read + female
##
##              post.mean l-95% CI u-95% CI eff.samp  pMCMC
## (Intercept)    60.5278  52.1184  69.1116    10000
Binary Outcomes
For these we fit essentially the same model, but the family is different (binomial) and the link funciton is the logit.
Single Level Model
Because MCMCglmm does not allow you to set zero residual variance
because it makes the MCMC sampling easier. However, to put this on the scale of
typical logistic regressions, we need to use a scaling factor.
# residual variance
sigma2 <- 1
# scaling factor
k <- sqrt(1 + (((16 * sqrt(3))/(15 * pi))^2) * sigma2)

# fit the model
m4 <- MCMCglmm(honors ~ read + female, data = dat, family = "categorical",
  prior = list(
    B = list(mu = c(0, 0, 0), V = diag(3) * c(1e6, 10, 10)),
    R = list(V = sigma2, fix = 1)),
  nitt = 500*2500 + 5000, thin = 500, burnin = 5000, verbose=FALSE)

m4$Sol <- m4$Sol/k
m4$VCV <- m4$VCV/(k^2)

autocorr(m4$Sol)
## , , (Intercept)
##
##           (Intercept)      read femalefemale
## Lag 0         1.00000 -0.973809      -0.3887
## Lag 500       0.01087 -0.017710       0.0322
## Lag 2500     -0.00361  0.000725       0.0122
## Lag 5000      0.00927 -0.003536      -0.0470
## Lag 25000    -0.00171  0.009756      -0.0233
##
## , , read
##
##           (Intercept)     read femalefemale
## Lag 0       -0.973809  1.00000      0.22484
## Lag 500     -0.014289  0.02214     -0.03361
## Lag 2500    -0.000844  0.00160     -0.00286
## Lag 5000    -0.010716  0.00649      0.04143
## Lag 25000    0.009233 -0.01377      0.01403
##
## , , femalefemale
##
##           (Intercept)      read femalefemale
## Lag 0       -0.388652  0.224845       1.0000
## Lag 500      0.016230 -0.019627      -0.0152
## Lag 2500     0.000133  0.004723      -0.0166
## Lag 5000    -0.000486 -0.005471       0.0312
## Lag 25000   -0.013980  0.000951       0.0355
plot(m4$Sol)
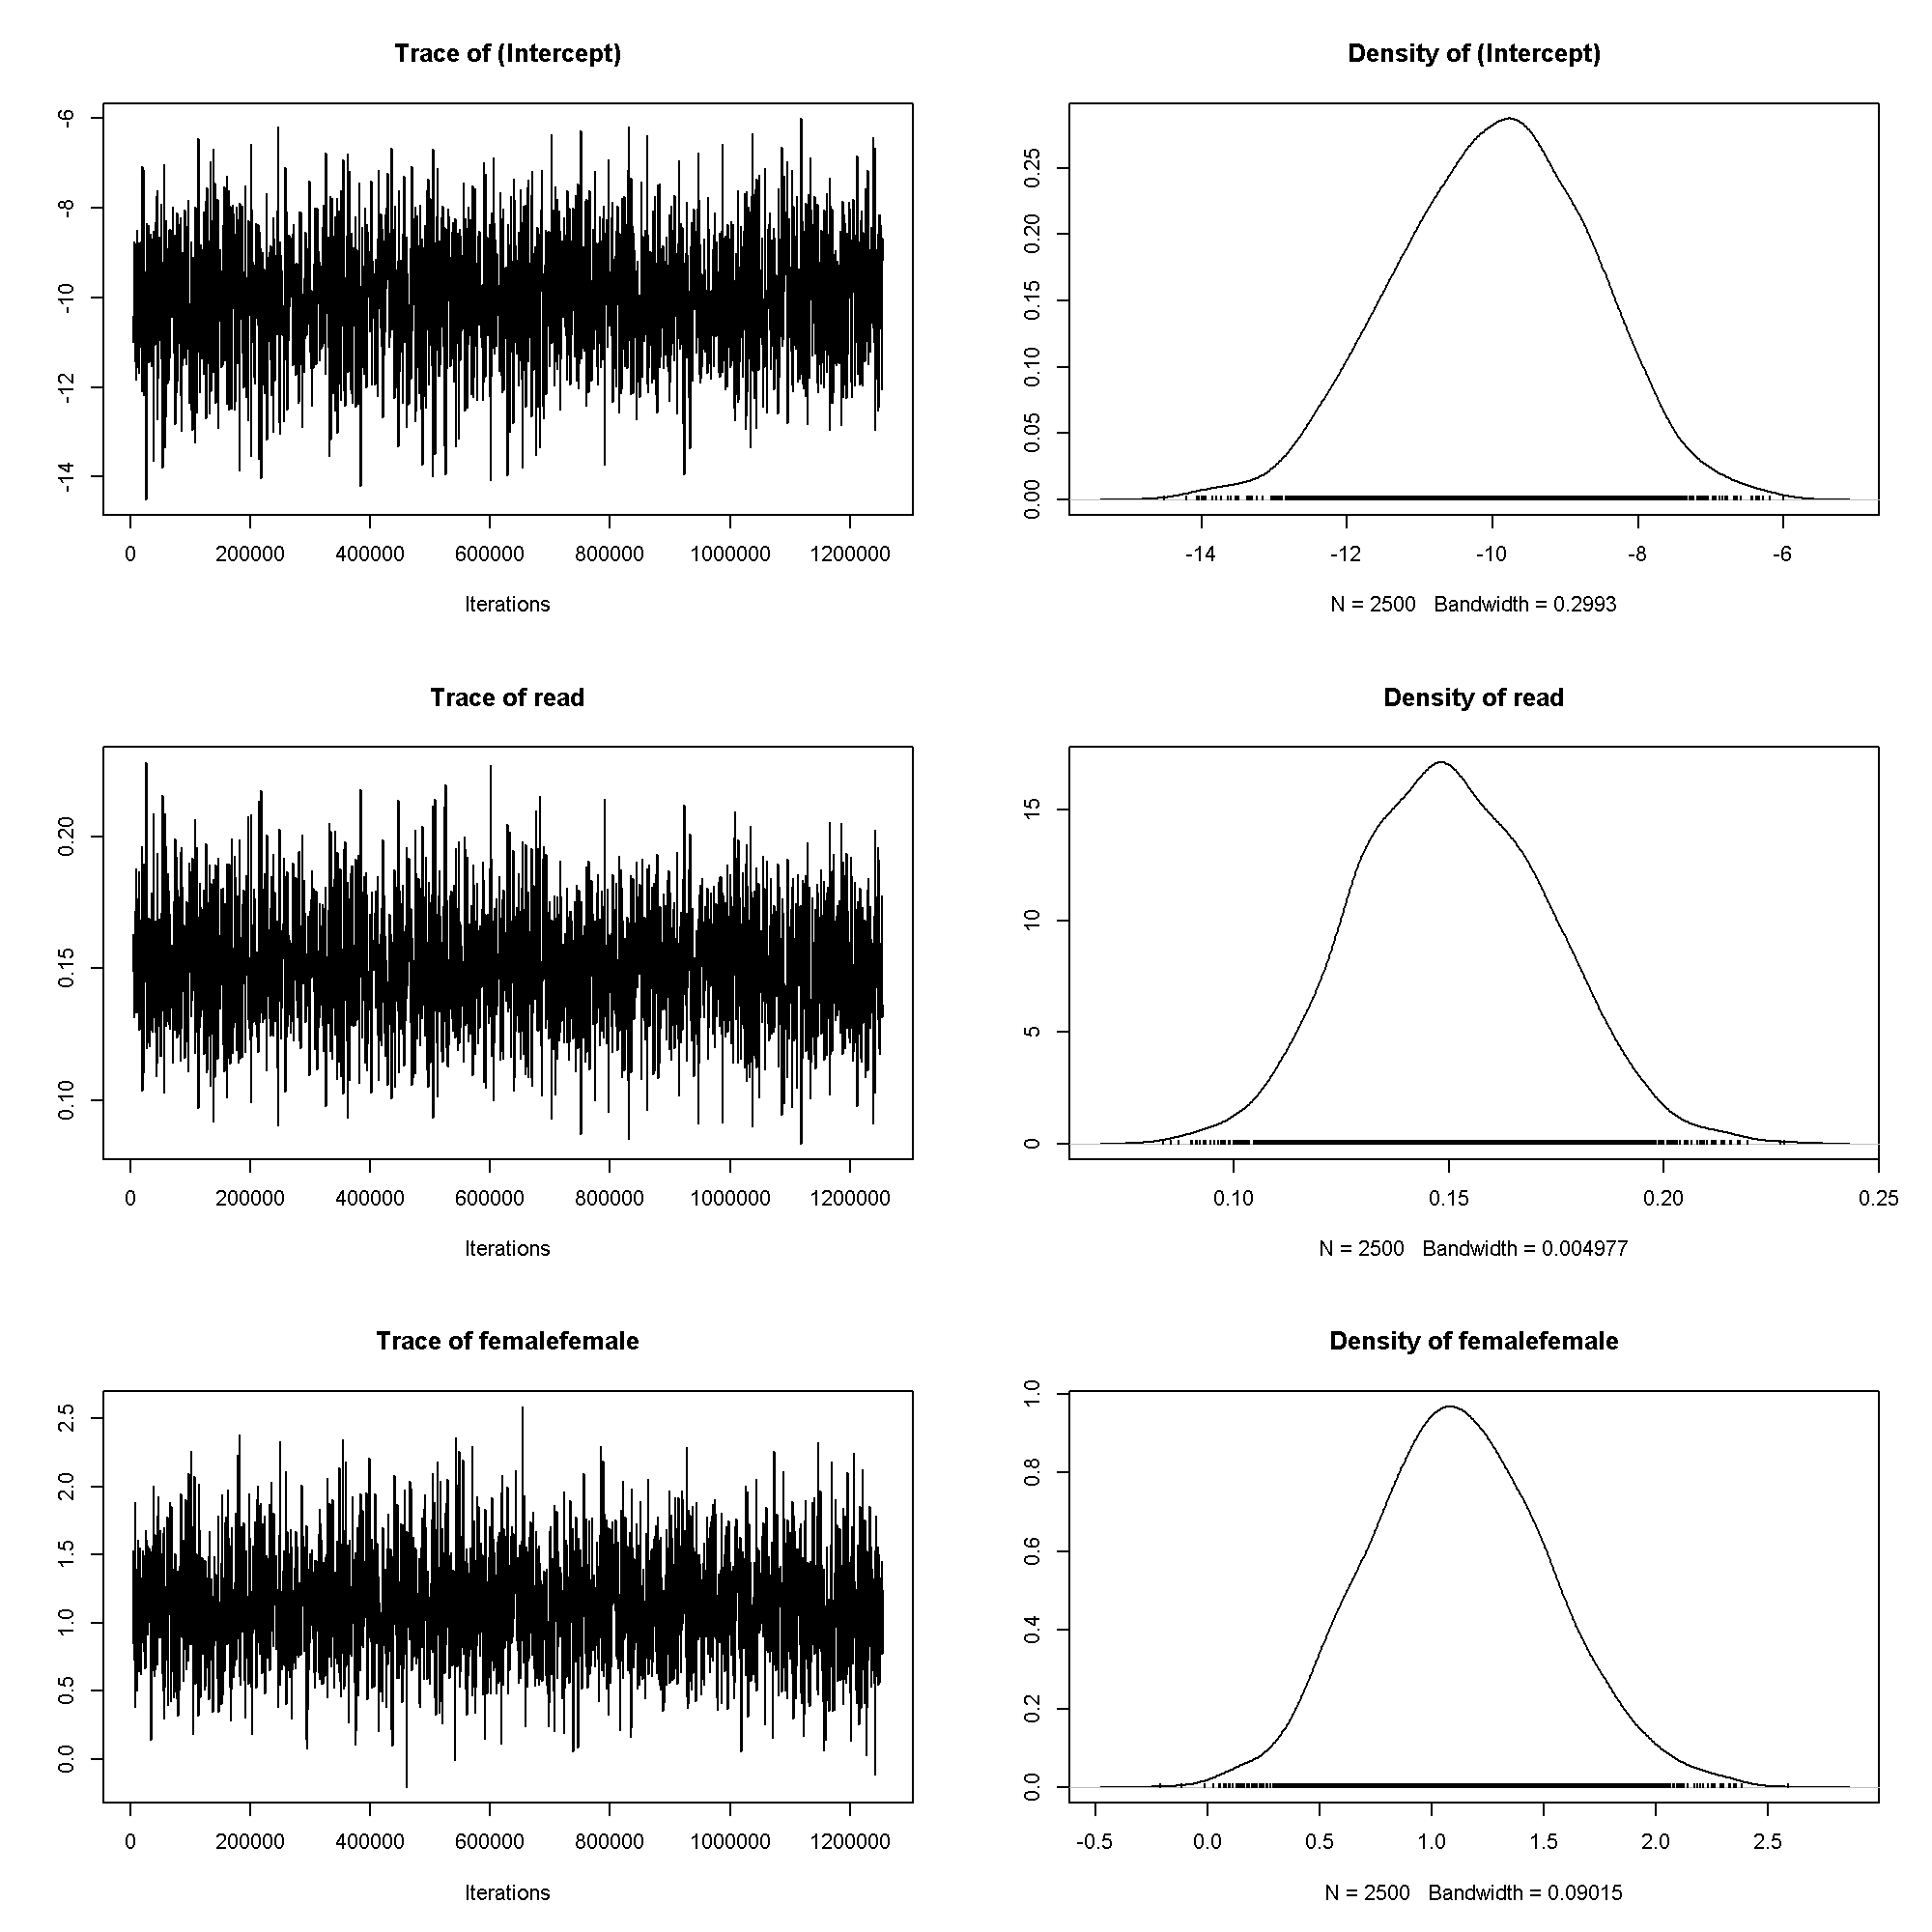
summary(m4)
##
##  Iterations = 5001:1254501
##  Thinning interval  = 500
##  Sample size  = 2500
##
##  DIC: 174
##
##  R-structure:  ~units
##
##       post.mean l-95% CI u-95% CI eff.samp
## units     0.743    0.743    0.743        0
##
##  Location effects: honors ~ read + female
##
##              post.mean l-95% CI u-95% CI eff.samp  pMCMC
## (Intercept)     -9.990  -12.600   -7.448     2500
Hierarchical Models
start <- proc.time()
m5 <- MCMCglmm(honors ~ read + female, data = dat, family = "categorical",
  random = ~ cid,
  prior = list(
    B = list(mu = c(0, 0, 0), V = diag(3) * c(1e6, 10, 10)),
    R = list(V = sigma2, fix = 1),
    G = list(
      G1 = list(V = 1, nu = .002)
    )), pr=TRUE, pl=TRUE,
  nitt = 500*5000 + 10000, thin = 500, burnin = 10000, verbose=FALSE)
end <- proc.time()

# time in minutes
(end - start)/60
##    user  system elapsed
##  7.8442  0.0005  7.8458
m5$Sol <- m5$Sol/k
m5$VCV <- m5$VCV/(k^2)

plot(m5$VCV)
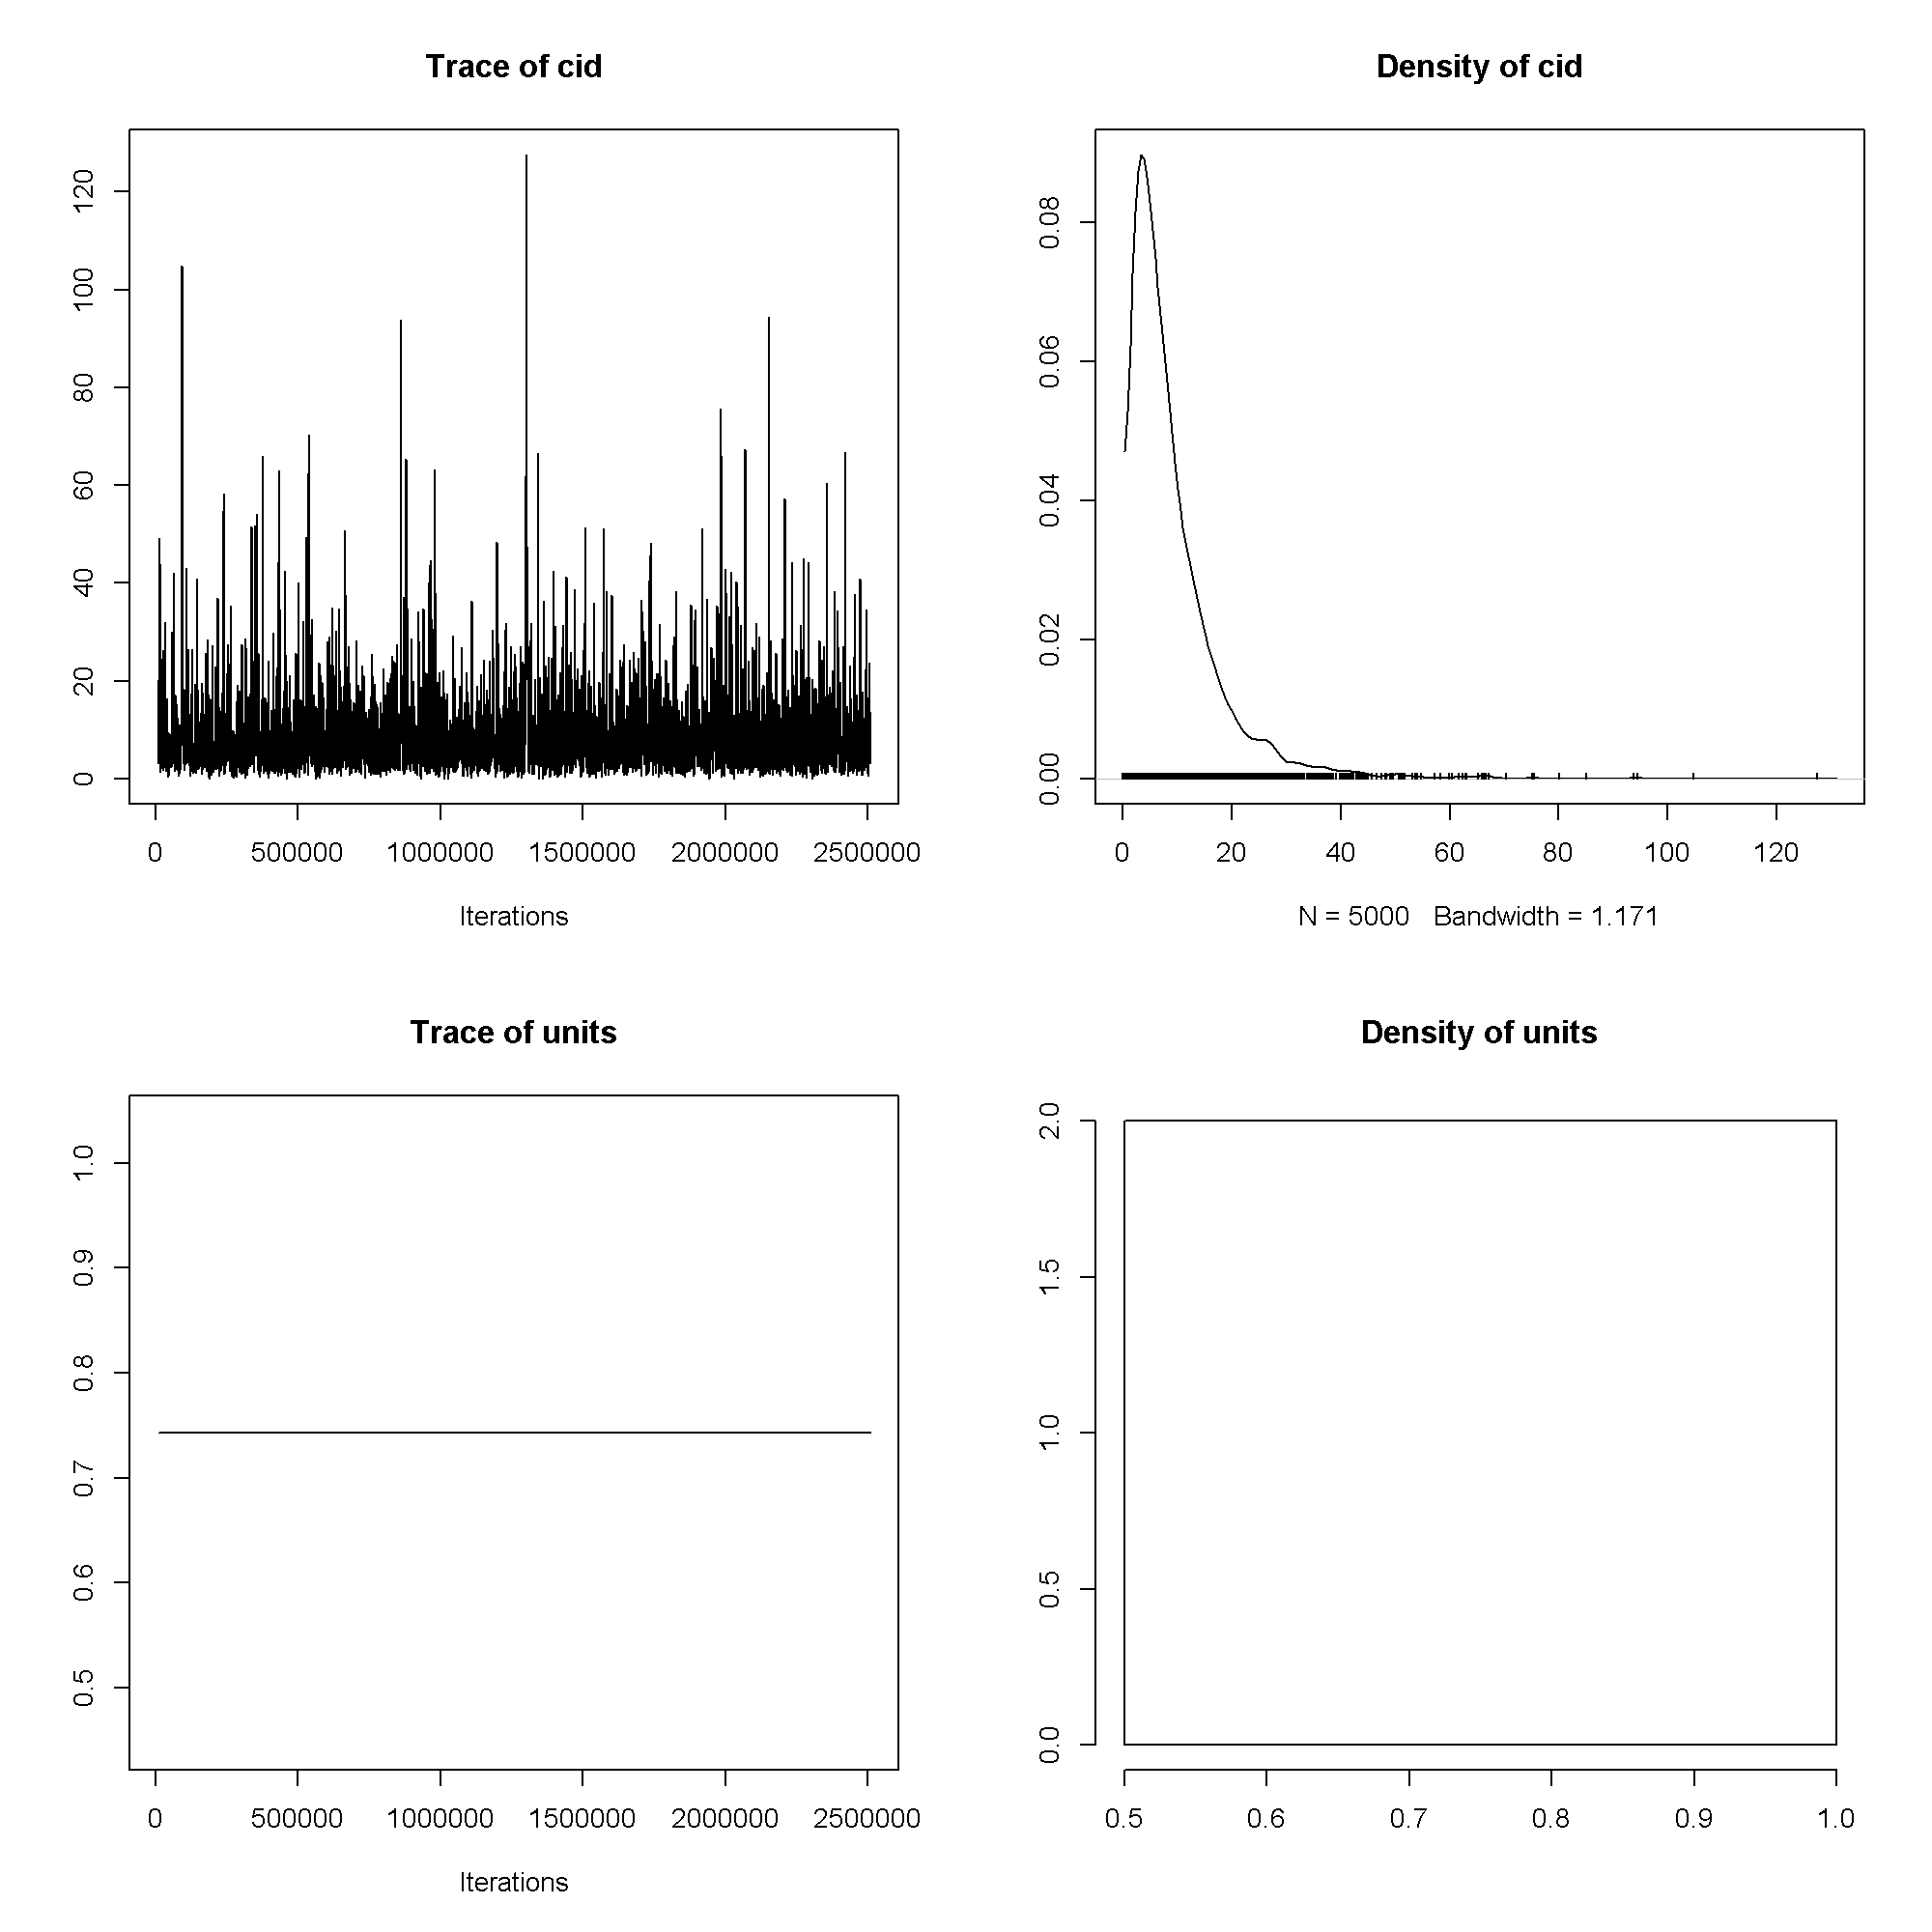
plot(m5$Sol[, 1:3])
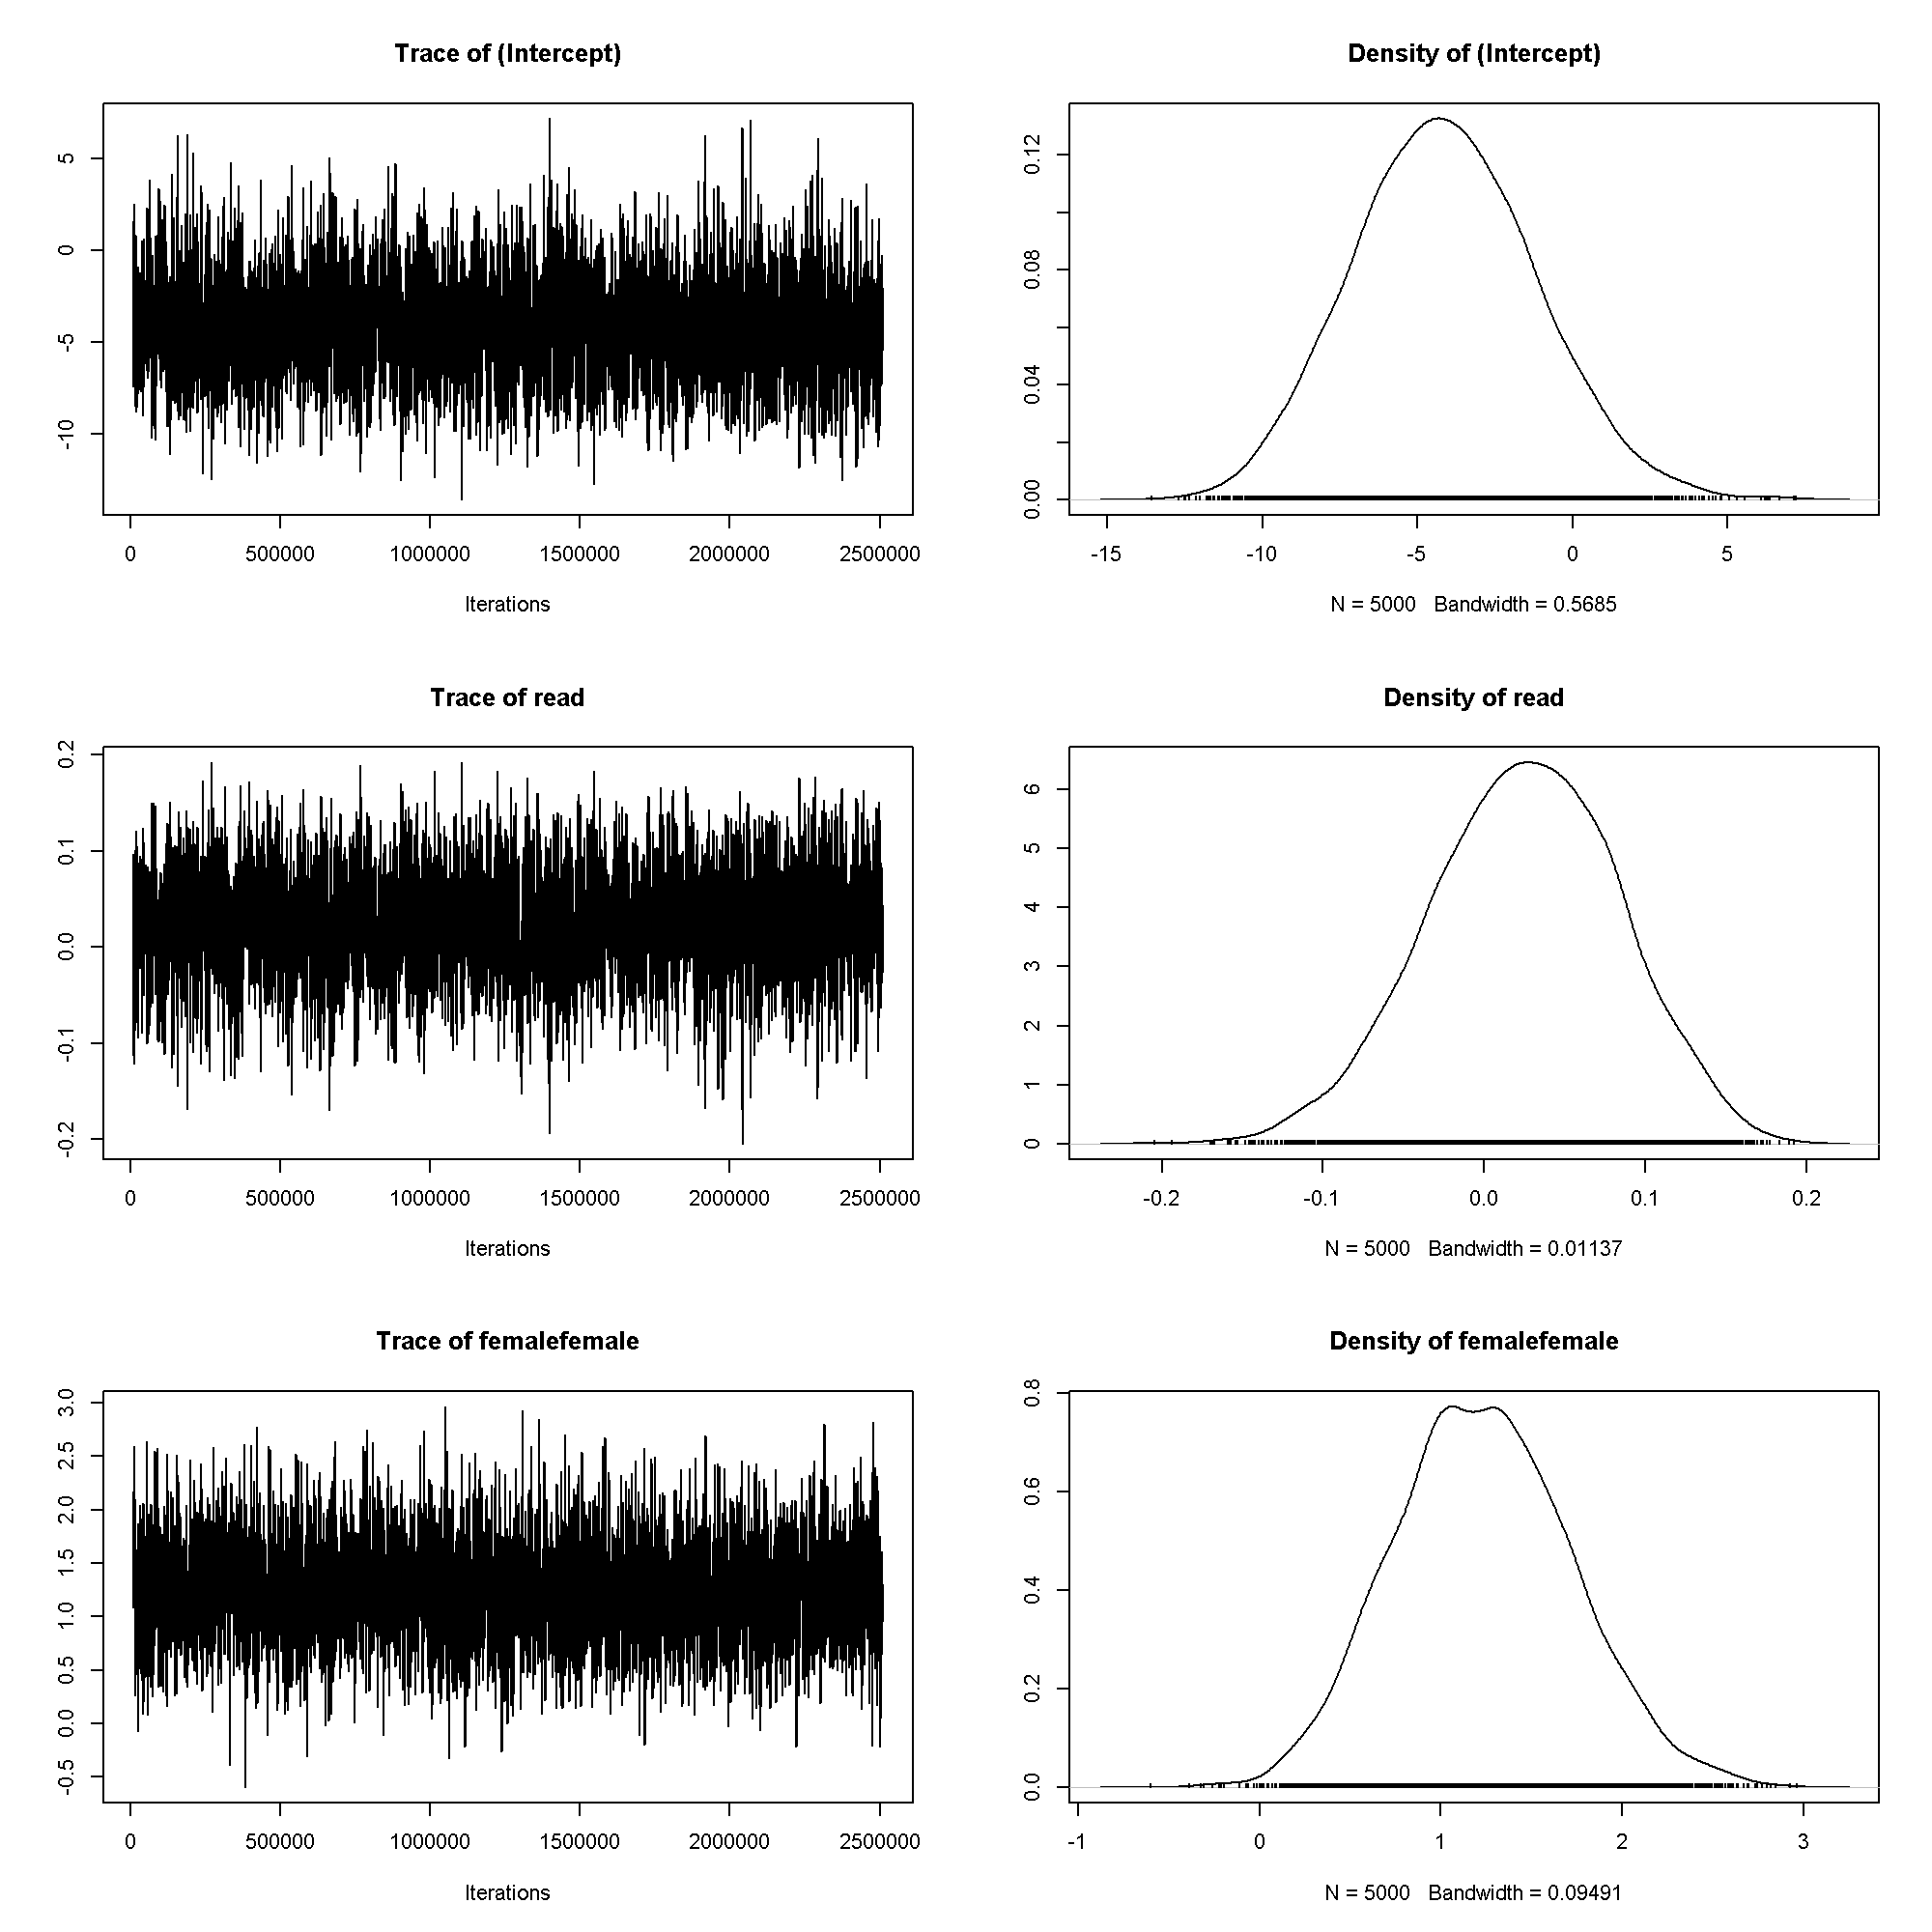
summary(m5)
##
##  Iterations = 10001:2509501
##  Thinning interval  = 500
##  Sample size  = 5000
##
##  DIC: 143
##
##  G-structure:  ~cid
##
##     post.mean l-95% CI u-95% CI eff.samp
## cid      9.18  0.00244     25.9     1516
##
##  R-structure:  ~units
##
##       post.mean l-95% CI u-95% CI eff.samp
## units     0.743    0.743    0.743        0
##
##  Location effects: honors ~ read + female
##
##              post.mean l-95% CI u-95% CI eff.samp  pMCMC
## (Intercept)    -4.1265 -10.1146   1.3013     3805 0.1680
## read            0.0242  -0.0858   0.1420     3045 0.6736
## femalefemale    1.2305   0.2780   2.1819     4800 0.0068 **
## ---
## Signif. codes:  0 '***' 0.001 '**' 0.01 '*' 0.05 '.' 0.1 ' ' 1
# predicted probabilities
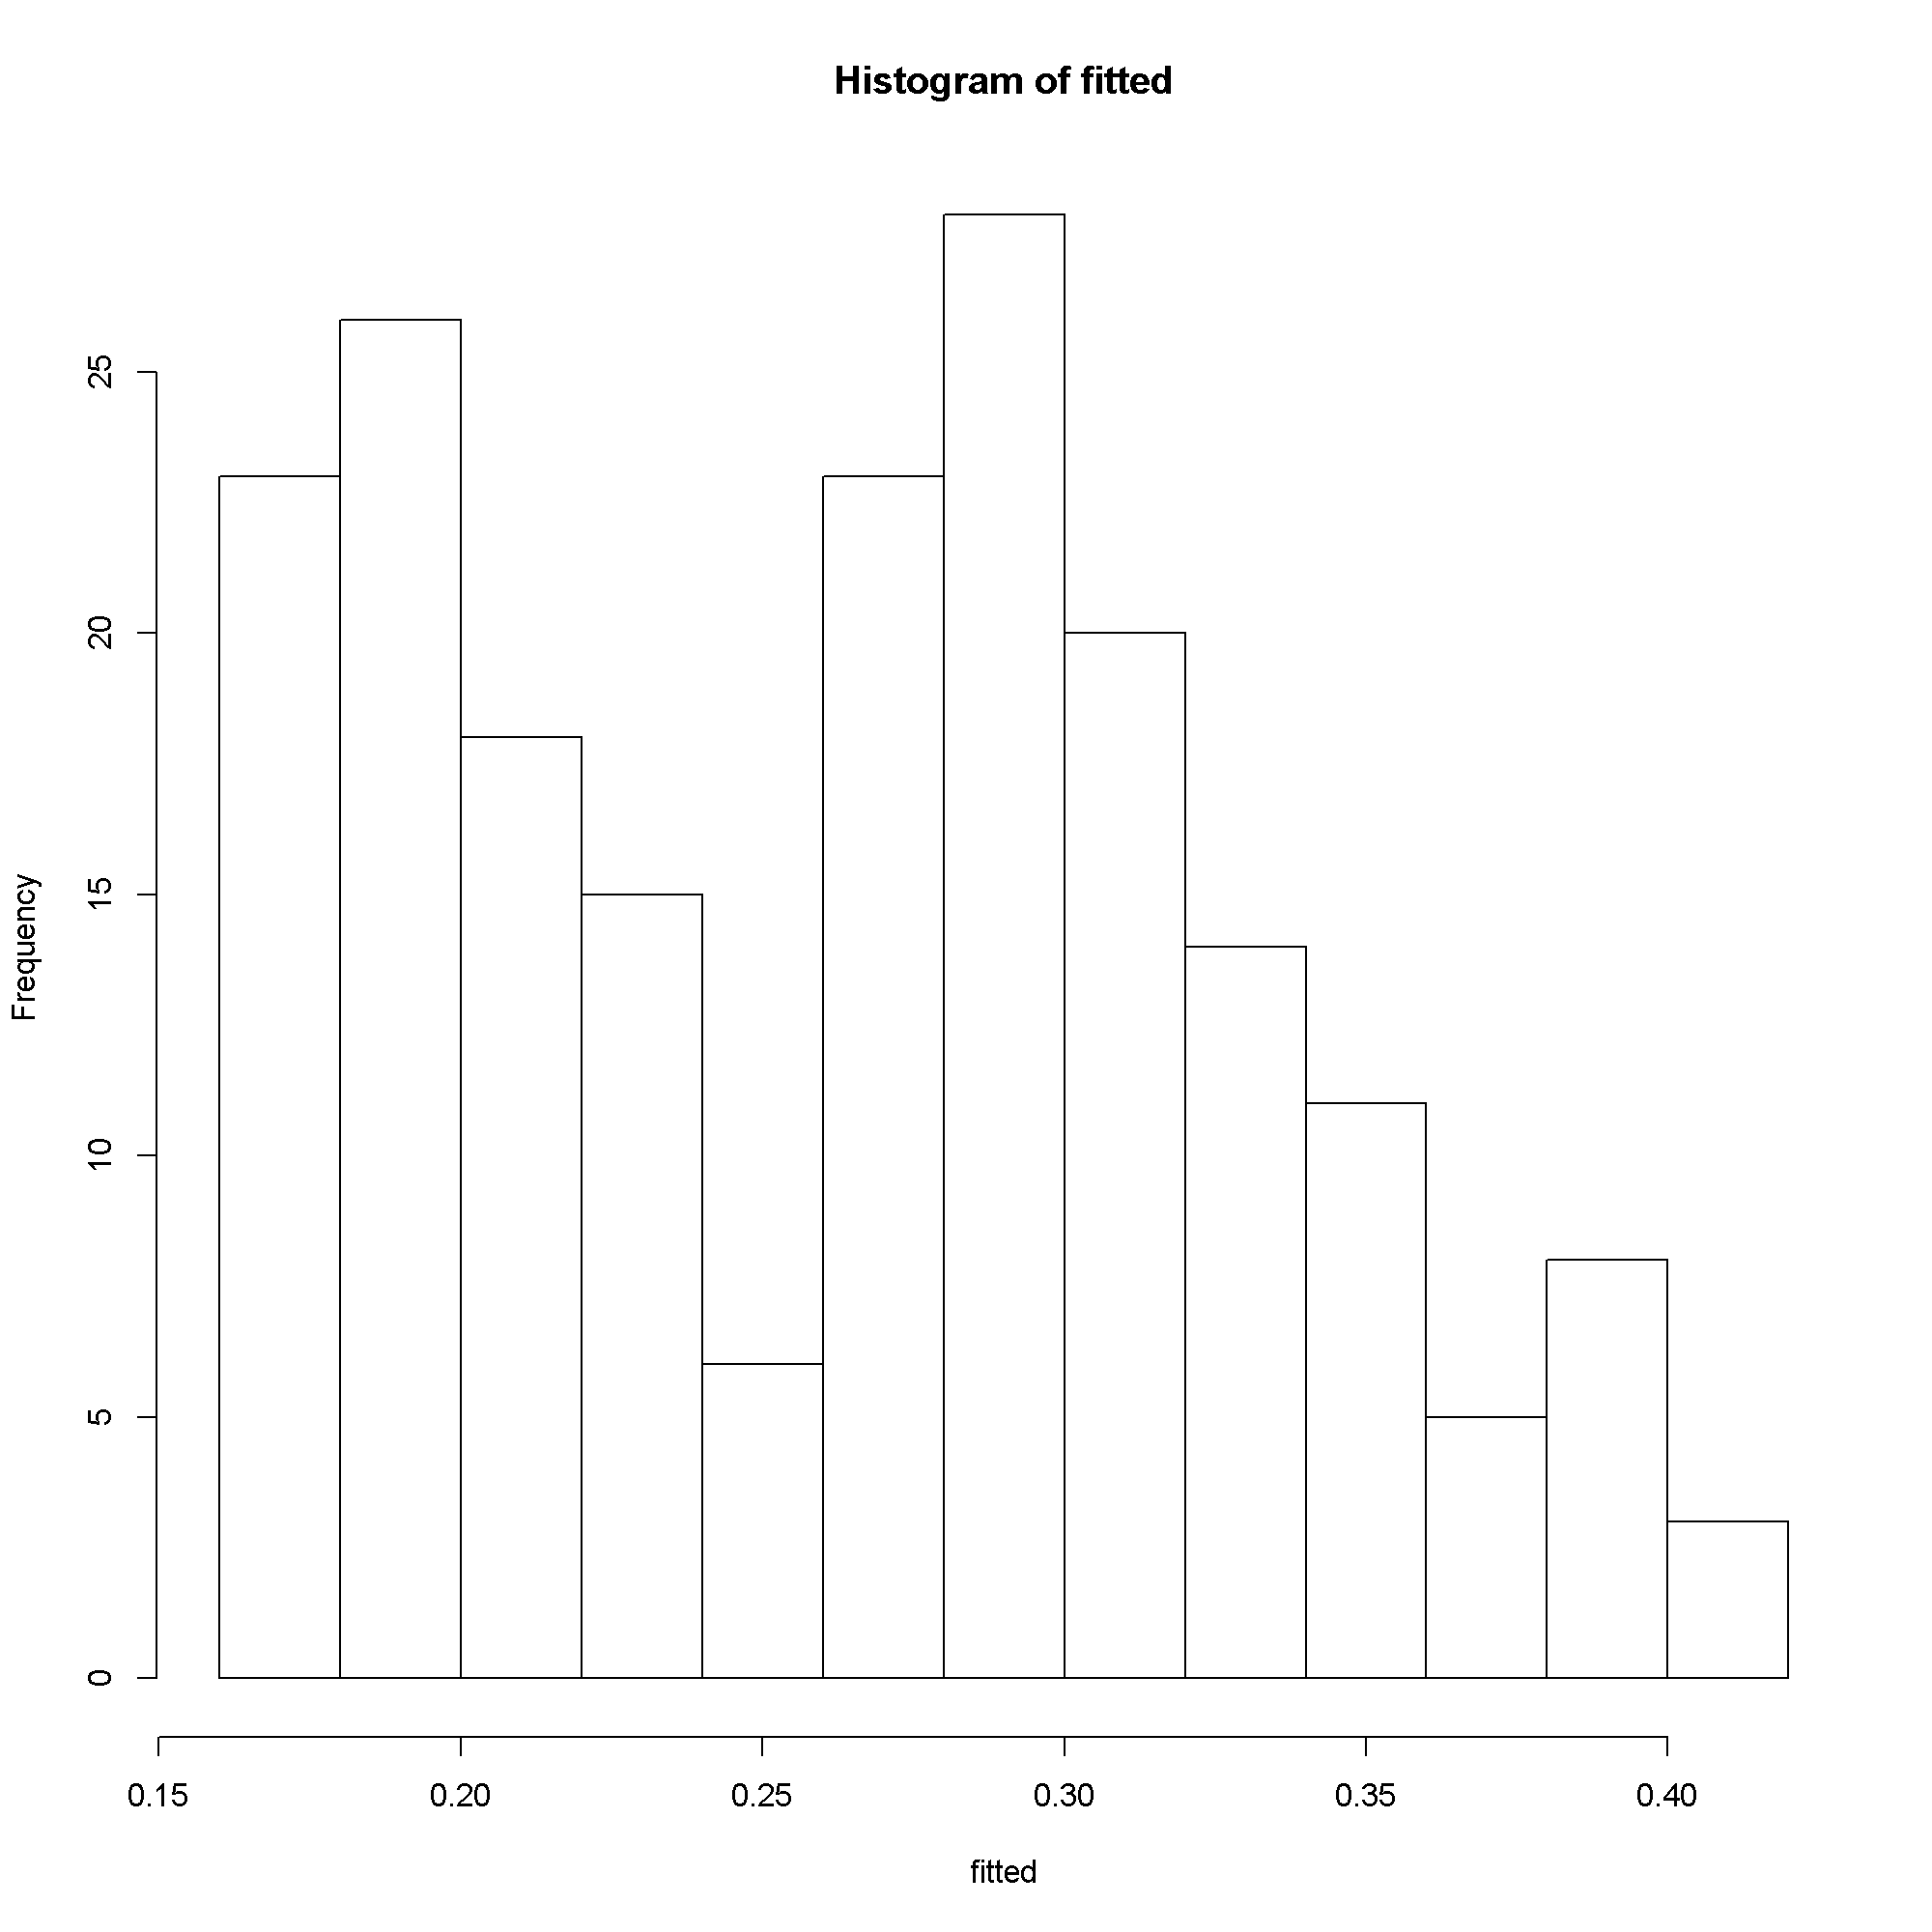
fitted <- predict(m5)
hist(fitted)
# example using a frequentist approach
lme4:::glmer(honors ~ read + female + (1 | cid), data = dat, family = "binomial", nAGQ = 20)
## Generalized linear mixed model fit by the adaptive Gaussian Hermite approximation
## Formula: honors ~ read + female + (1 | cid)
##    Data: dat
##  AIC BIC logLik deviance
##  167 181  -79.7      159
## Random effects:
##  Groups Name        Variance Std.Dev.
##  cid    (Intercept) 4.44     2.11
## Number of obs: 200, groups: cid, 20
##
## Fixed effects:
##              Estimate Std. Error z value Pr(>|z|)
## (Intercept)   -4.8057     2.1187   -2.27    0.023 *
## read           0.0422     0.0367    1.15    0.251
## femalefemale   1.2044     0.4894    2.46    0.014 *
## ---
## Signif. codes:  0 '***' 0.001 '**' 0.01 '*' 0.05 '.' 0.1 ' ' 1
##
## Correlation of Fixed Effects:
##             (Intr) read
## read        -0.955
## femalefemal -0.285  0.147
Count Outcomes
m6 <- MCMCglmm(awards ~ read, data = dat, family = "poisson",
  prior = list(
    B = list(mu = c(0, 0), V = diag(2) * c(1e8, 1e8)),
    R = list(V = sigma2, nu = .002)),
  nitt = 500*2500 + 5000, thin = 500, burnin = 5000, verbose=FALSE)

autocorr(m6$Sol)
## , , (Intercept)
##
##           (Intercept)     read
## Lag 0        1.000000 -0.98186
## Lag 500      0.000592  0.00699
## Lag 2500    -0.018182  0.01213
## Lag 5000     0.003021 -0.00752
## Lag 25000   -0.001521  0.00619
##
## , , read
##
##           (Intercept)      read
## Lag 0        -0.98186  1.000000
## Lag 500       0.00382 -0.011260
## Lag 2500      0.02018 -0.014407
## Lag 5000      0.00498 -0.000221
## Lag 25000     0.00577 -0.010563
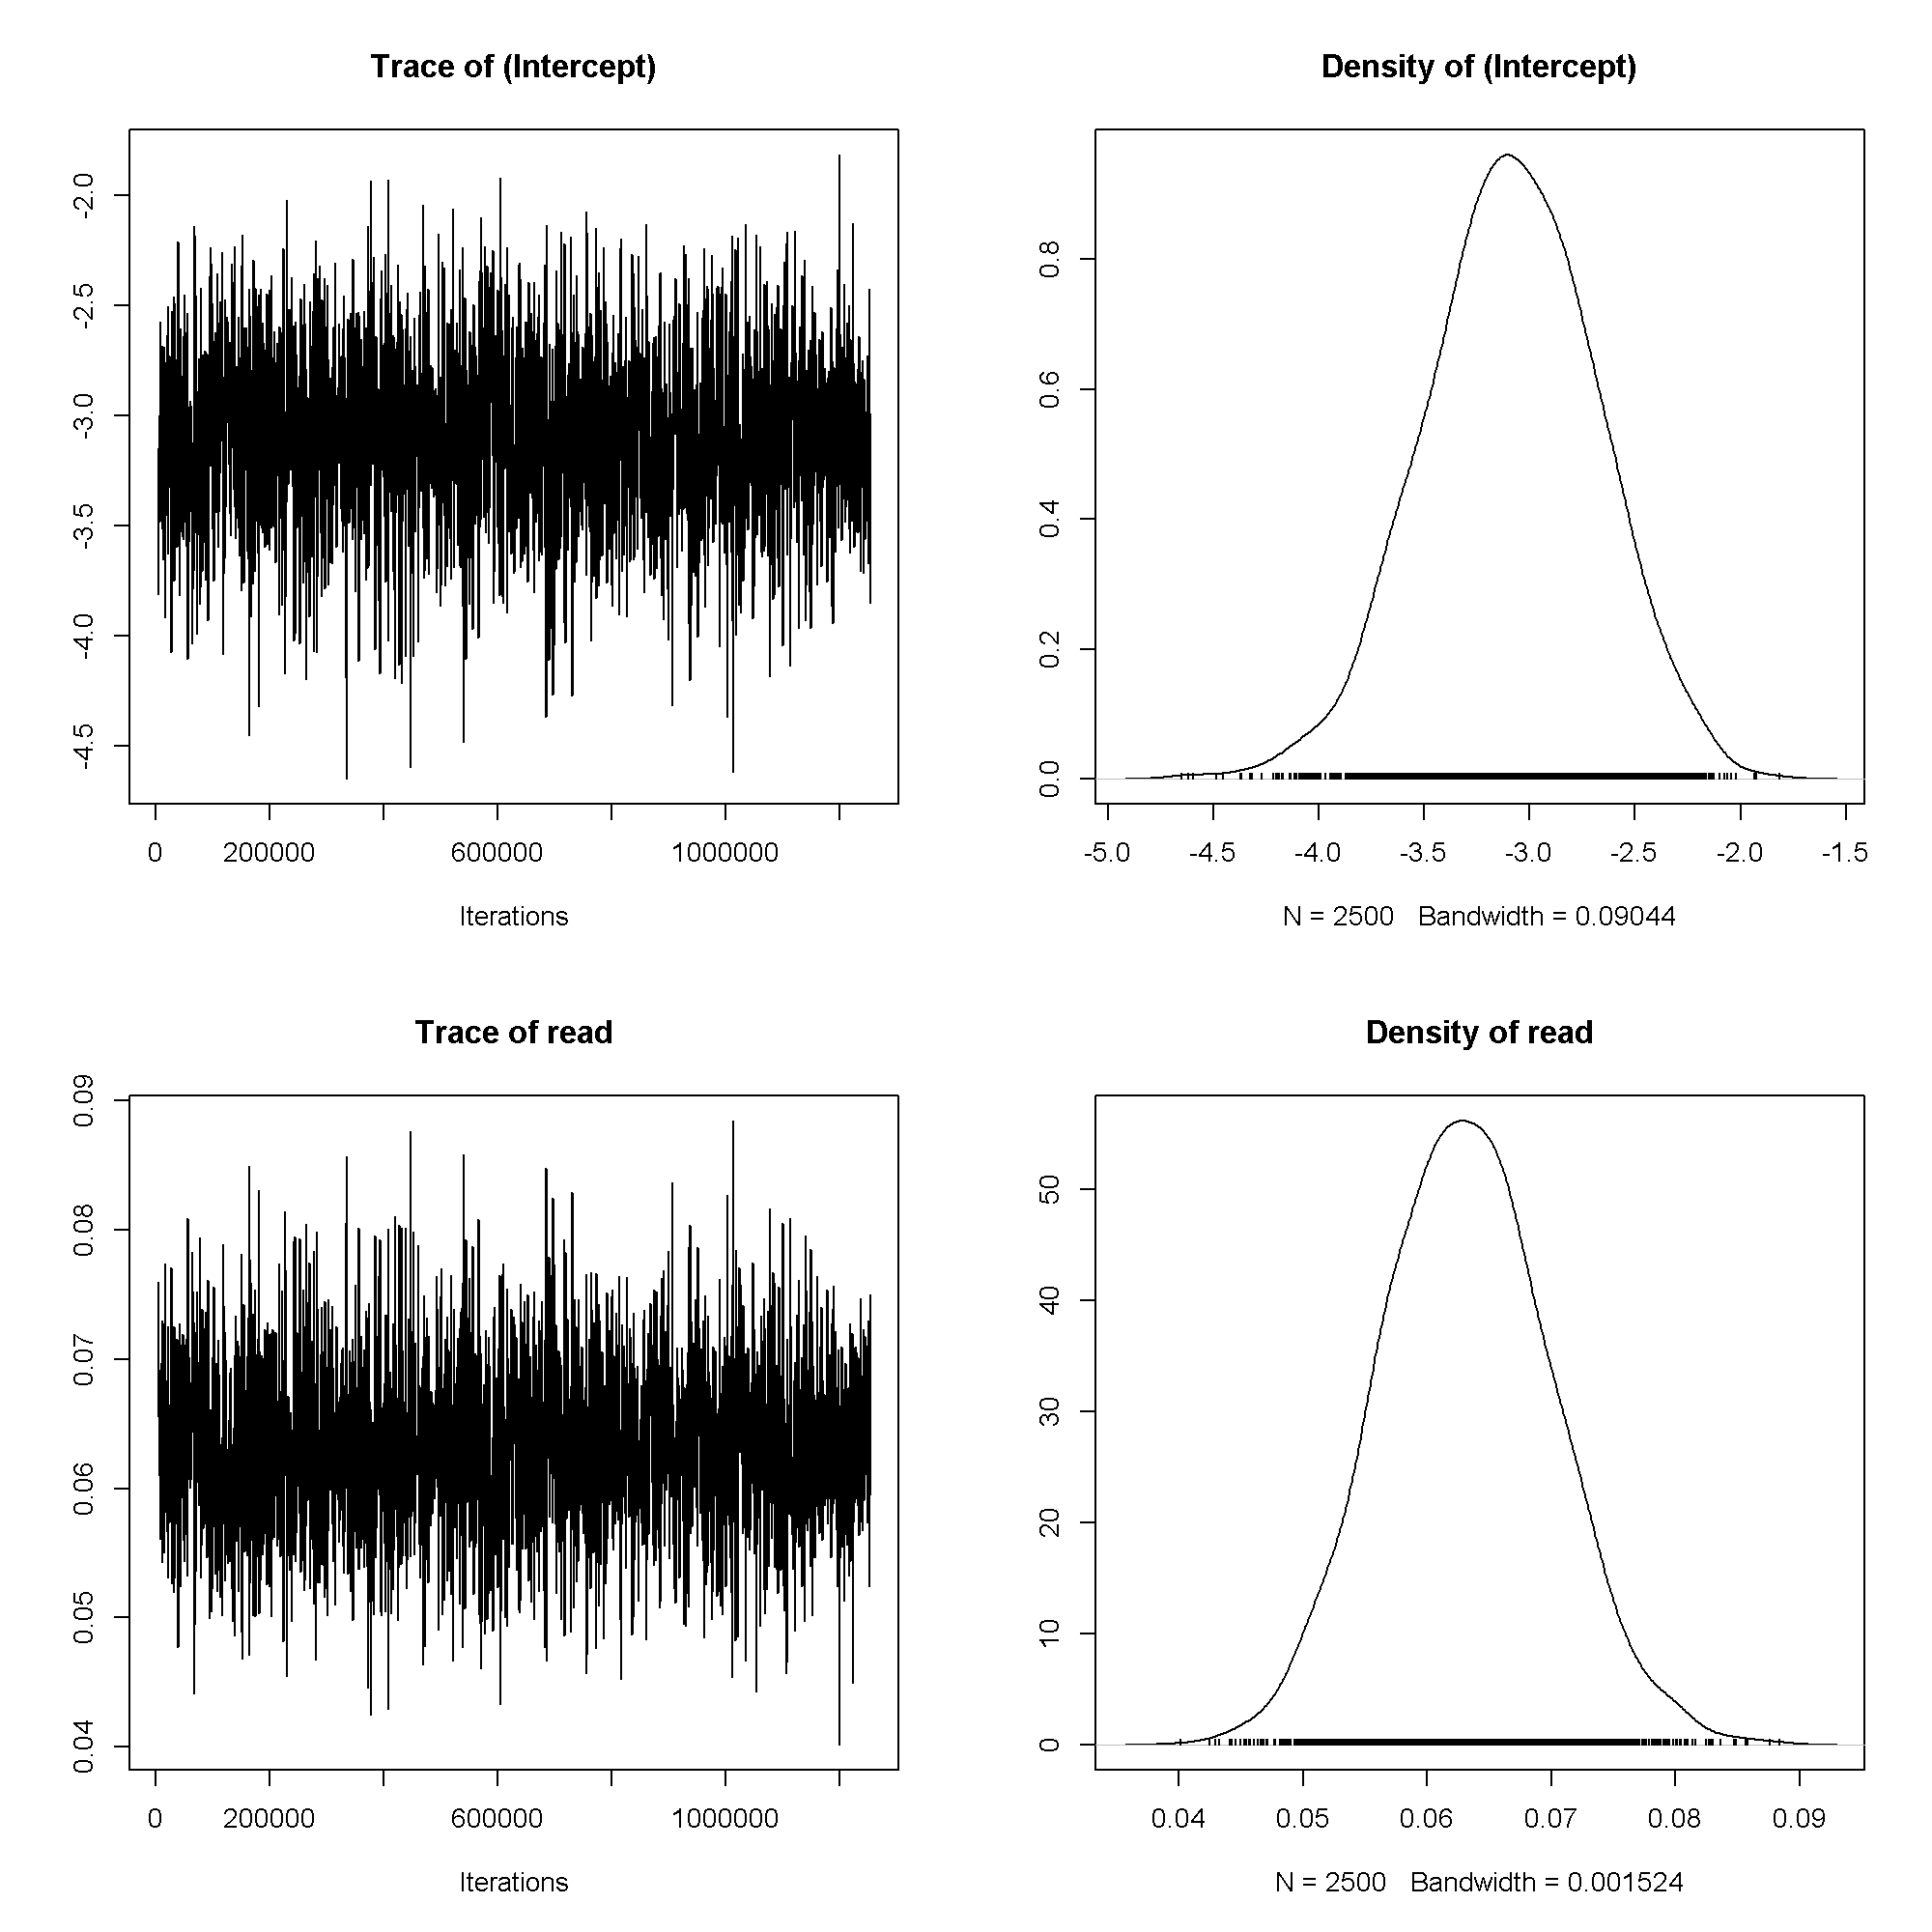
plot(m6$Sol)
summary(m6)
##
##  Iterations = 5001:1254501
##  Thinning interval  = 500
##  Sample size  = 2500
##
##  DIC: 625
##
##  R-structure:  ~units
##
##       post.mean l-95% CI u-95% CI eff.samp
## units     0.219   0.0393    0.407     2132
##
##  Location effects: awards ~ read
##
##             post.mean l-95% CI u-95% CI eff.samp  pMCMC
## (Intercept)   -3.0900  -3.8709  -2.2905     2500
