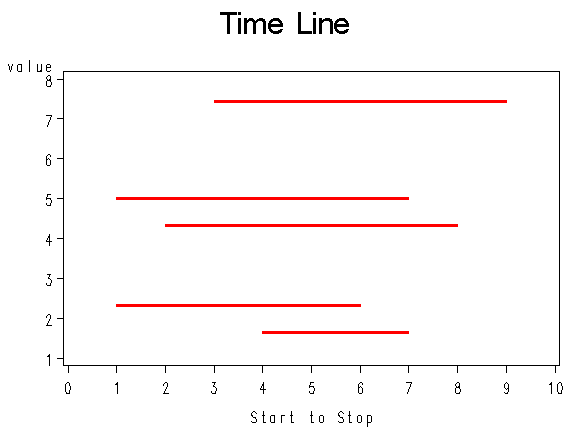
This page shows how to use SAS annotate facility to plot a timeline plot.
data a;
  input start stop value;
cards;
4 7 1.65
1 6 2.32
3 9 7.43
2 8 4.32
1 7 5.01
;
run;
data anno;
  length function color $8;
  retain xsys ysys '2' size 2 color 'red';
  set a;
  function='move'; x=start; y = value; output;
  function='draw'; x=stop;  y = value; output;
run;
axis1 order=(0 to 10) label=('Start to Stop') minor=none;
axis2 minor = none;
symbol1 i=none;
title1 'Time Line';
proc gplot data=a;
plot value*stop / anno=anno haxis=axis1 vaxis=axis2;
run;
quit;

