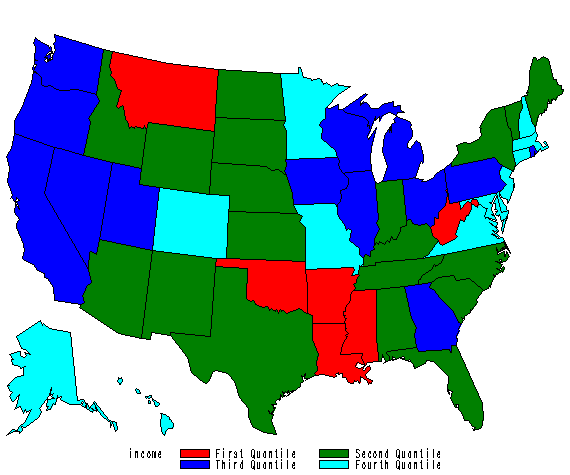
The following data set contains the median income of each state from census data. It is based on a page provided by U.S. Census Bureau. We want to create a U.S. map with median income information on it. This can be done easily in SAS by using proc gmap. The first example is done using all the default options from the procedure, and the second example has customized categories and is done using the format statement and the discrete option.
data income2000; input statename $20. state income ; datalines; Maryland 24 51695 Alaska 2 50746 New Jersey 34 51032 Connecticut 9 50360 Minnesota 27 50865 Colorado 8 48506 New Hampshire 33 48928 Virginia 51 50069 Delaware 10 50154 Illinois 17 46435 Utah 49 45230 Washington 53 42024 Michigan 26 46181 Massachusetts 25 46947 Hawaii 15 48026 Wisconsin 55 45349 California 6 46802 Missouri 29 47462 Rhode Island 44 42973 Nevada 32 44755 Ohio 39 43894 Oregon 41 42440 Iowa 19 42993 Georgia 13 42887 Pennsylvania 42 43742 Indiana 18 39717 Vermont 50 38150 New York 36 41605 Maine 23 41597 Arizona 4 41456 Texas 48 39842 Nebraska 31 38574 North Carolina 37 38829 Kansas 20 37705 Wyoming 56 39026 District of Columbia 11 38752 Idaho 16 37462 Florida 12 37998 Kentucky 21 37186 South Carolina 45 37119 Alabama 1 33105 South Dakota 46 36172 Tennessee 47 33885 New Mexico 35 35254 Oklahoma 40 32445 North Dakota 38 35349 Montana 30 32045 Louisiana 22 30219 Mississippi 28 31528 Arkansas 5 30293 West Virginia 54 29052 ; run; proc gmap data = income2000 map=maps.us; id state; choro income; run; quit;proc univariate data = income2000; var income; run; 100% Max 51695 99% 51695 95% 50865 90% 50154 75% Q3 46802 50% Median 41605 25% Q1 37186 10% 32445 5% 30293 1% 29052 0% Min 29052 proc format; value income low-32445 = 'First Quantile' 32445-41605 = 'Second Quantile' 41605-46802 = 'Third Quantile' 46802 -high = 'Fourth Quantile'; run; proc gmap data = income2000 map=maps.us; id state; choro income /discrete; format income income.; run; quit;

