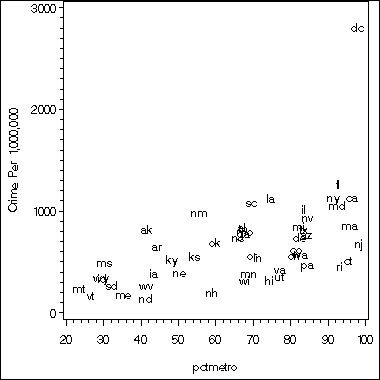
Example 1 using the pointlabel option. You can get the sample data set crime here.
goptions reset=all;
axis1 label=(a=90 'Crime Per 1,000,000');
symbol1 pointlabel = ("#state" h=3 font=swiss)  value=none;
proc gplot data=crime;
  plot crime*pctmetro = 1 / vaxis=axis1;
run;
quit;
Example 2 of setting up the output file type, labeling, etc.
data set1;
  do group = 1 to 3;
  do x = -50 to 50;
 if group =1 then  dv = 9.09 + .09*x;
 if group =2 then  dv = 7.02 - .08*x;
 if group =3 then  dv = 4.94 - .26*x;
output;
  end;
  end;
 run;
 proc sql noprint;
   select max(dv) into :y1-:y3
   from set1
   where set1.x = 48
   group by group
   ;
quit;
%put _user_;
 data anno;
   length function color text $8;

   function = 'label';
   size     =  1;
   xsys     = '2';
   ysys     = '2';
   when     = 'a';
   x= 45 ; /*the x-coordinate for the text*/
   y= &y1+1; /*the y-coordinate*/
   text=left("GROUP1");
   color = 'black';
output;
   x= 45 ;
   y= &y2+3;
   text=left("GROUP2");
   color = 'red';
output;
   x= 45 ;
   y= &y3+3;
   text=left("GROUP3");
   color = 'blue';
output;
run;

goptions reset = all;

goptions  ftext = swiss htitle = 5 htext = 3 gunit = pct
border cback = white hsize = 4in vsize = 4in;
filename outgraph 'e:tempmygraph.gif';
*goptions gsfname = outgraph dev = gif373 ;
/* The size is about 3.93in by 2.95in. */
goptions gsfname = outgraph dev = gif570;
/* The size is about 6in by 4.5in. */

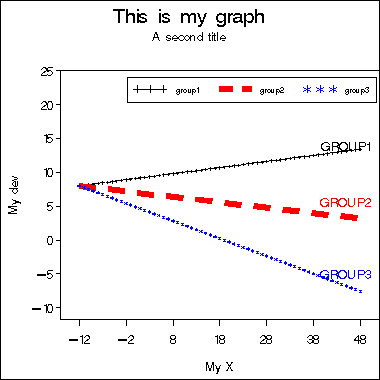
title "This is my graph";
title2 "A second title";
axis1 order = (-10 to 25 by 5) offset = (3,0) label = (a=90 'My dev') minor=none;
axis2 order = (-12 to 52 by 10) offset = (5,5) label=('My X') minor = none;

symbol1 i = join c = black l=5 v = plus ;
symbol2 i = join c = red l= 3 w = 5;
symbol3 i = join c = blue ;

legend label=none value=(h=2 font=swiss 'group1' 'group2' 'group3')
       position=(top right inside) mode=share cborder=black;

proc gplot data = set1;
  plot dv*x=group / vaxis = axis1 haxis=axis2 legend = legend1 anno = anno;
run;
quit;
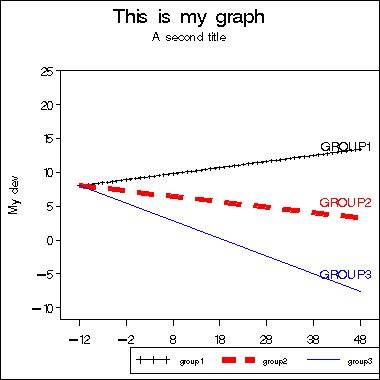
Example 3, a variation of example 2.
legend label=none value=(h=2 font=swiss 'group1' 'group2' 'group3')
       position=(bottom right outside) mode=protect cborder=black;

proc gplot data = set1;
  plot dv*x=group / vaxis = axis1 haxis=axis2 legend = legend1 anno = anno;
run;
quit;
Example 4 show how to save multiple graphs to multiple files all at once. Instead of specifying the file name for a single graph, we specify a location, that is a file folder for all the graphs. The best way of saving the graphs is to create a new folder and save all the graphs to the new folder. In this example, the variable schtyp takes two values. We first create a folder called "schtyp" in d:temp. Then after running the code below, we will have two graphs, plot.gif and plot1.gif located in d:tempschtyp.
filename grafout 'd:tempschtyp';
goptions reset=all gsfname=grafout
         dev = gif373 gsfmode=replace;
proc sort data = hsb2;
  by schtyp;
run;
proc gplot data = hsb2;
  by schtyp;
  plot math*write;
run;
quit;


