Table 10.1 on page 327.
Life table describing the number of years in teaching for a sample of 3,941 special educators.
The following code gives us the results in the columns with the heading “Number…”
proc freq data='c:\alda\teachers';
  tables t*censor/nopercent norow nocol;
run;

T         CENSOR

Frequency|       0|       1|  Total
---------+--------+--------+
       1 |    456 |      0 |    456
---------+--------+--------+
       2 |    384 |      0 |    384
---------+--------+--------+
       3 |    359 |      0 |    359
---------+--------+--------+
       4 |    295 |      0 |    295
---------+--------+--------+
       5 |    218 |      0 |    218
---------+--------+--------+
       6 |    184 |      0 |    184
---------+--------+--------+
       7 |    123 |    280 |    403
---------+--------+--------+
       8 |     79 |    307 |    386
---------+--------+--------+
       9 |     53 |    255 |    308
---------+--------+--------+
      10 |     35 |    265 |    300
---------+--------+--------+
      11 |     16 |    241 |    257
---------+--------+--------+
      12 |      5 |    386 |    391
---------+--------+--------+
Total        2207     1734     3941
The following code give the results in the columns with the heading “Proportion of…”
data one;
  input period ;
datalines;
 0
;
run;
*using the out options to capture the results in a data set called summary;
proc freq data='c:\alda\teachers_pp' ;
  tables period*event/nopercent nocol out=summary outpct;
run;
*Here we do the actual calculations to compute the hazard and survival functions;
*for each period;
data two;
  set one summary;
  if event=1 or period = 0;
  hazard=pct_row/100;
  retain survivor 1;
  if period > 0 then survivor=survivor*(1-hazard);
  keep period hazard survivor;
run;
proc print data=two noobs;
run;

period     hazard    survivor
   0       .          1.00000
   1      0.11571     0.88429
   2      0.11019     0.78686
   3      0.11577     0.69576
   4      0.10759     0.62091
   5      0.08909     0.56559
   6      0.08255     0.51890
   7      0.06015     0.48769
   8      0.04811     0.46423
   9      0.04220     0.44464
  10      0.03692     0.42822
  11      0.02469     0.41765
  12      0.01279     0.41231
Fig. 10.1 on page 333.
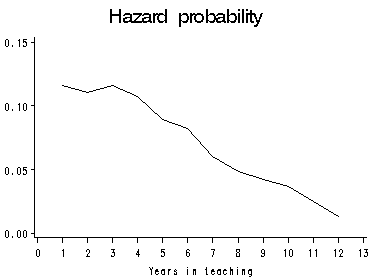
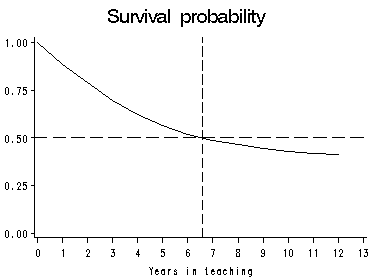
The first graph presents the estimated hazard function and the second graph presents the estimated survival function.
goptions reset=all;
symbol color=black i=join value=none height=2 ;
axis1 label=none order=(0 to .15 by .05) minor=none;
axis2 label=("Years in teaching") order=(0 to 13 by 1) minor=none ;
axis3 label=none order=(0 to 1 by .25) minor=none;
proc gplot data=two uniform;
  title 'Hazard probability';
  plot hazard*period/vaxis=axis1 haxis=axis2 noframe;* nolegend ;
  title 'Survival probability';
  plot survivor*period/ vaxis=axis3 haxis=axis2 noframe href=6.6 vref=.5 lhref=21 lvref=21;
run;
quit;
title;
Fig. 10.2–panel A, page 340
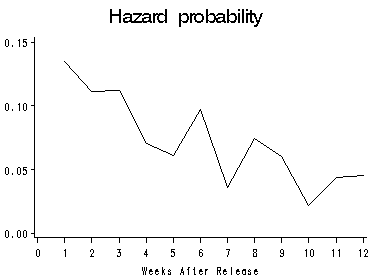
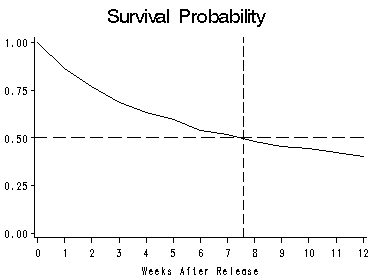
Plots of the hazard function and the survival function for the cocaine relapse data.
proc freq data='c:\alda\cocaine_relapse_pp' noprint;
  tables period*event/nopercent nocol out=summarya outpct;
run;
*Calculating the hazard and survivorship function;
*Use the data set one create before;
data twoa;
  set one summarya;
  if event=1 or period = 0;
  hazard=pct_row/100;
  retain survivor 1;
  if period > 0 then survivor=survivor*(1-hazard);
  keep period hazard survivor;
run;
goptions reset=all;
symbol color=black i=join value=none height=2 ;
axis1 label=none order=(0 to .15 by .05) minor=none;
axis2 label=("Weeks After Release") order=(0 to 12 by 1) minor=none ;
axis3 label=none order=(0 to 1 by .25) minor=none;
proc gplot data=twoa uniform;
  title2 'Hazard probability';
  plot hazard*period/vaxis=axis1 haxis=axis2 noframe;
  title2 'Survival Probability';
  plot survivor*period/ vaxis=axis3 haxis=axis2 noframe;
run;
quit;
title;
Fig. 10.2–panel B, page 340
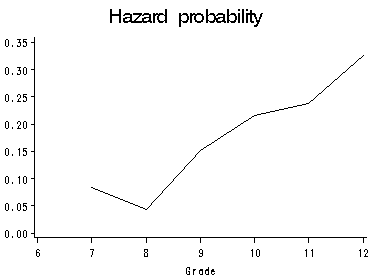
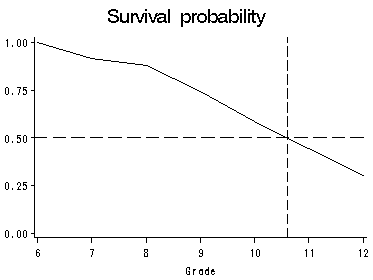
Plots of the hazard function and the survival function for the first intercourse data.
proc freq data='c:\alda\firstsex_pp' noprint;
  tables period*event/nopercent nocol out=summaryb outpct;
  run;
*Using the data set one created earlier;
*Calculating the hazard and survivorship function;
data twob;
  set one summaryb;
  if event=1 or period = 6;
  hazard=pct_row/100;
  retain survivor 1;
  if period > 6 then survivor=survivor*(1-hazard);
  keep period hazard survivor;
run;
goptions reset=all;
symbol color=black i=join value=none height=2 ;
axis1 label=none order=(0 to .35 by .05) minor=none;
axis2 label=("Grade") order=(6 to 12 by 1) minor=none ;
axis3 label=none order=(0 to 1 by .25) minor=none;
proc gplot data=twob uniform;
  title 'Hazard probability';
  plot hazard*period/vaxis=axis1 haxis=axis2 noframe;
  title 'Survival probability';
  plot survivor*period/ vaxis=axis3 haxis=axis2 noframe href=10.6 vref=.5 lhref=21 lvref=21;
run;
quit;
title;
Fig. 10.2–panel C, page 340
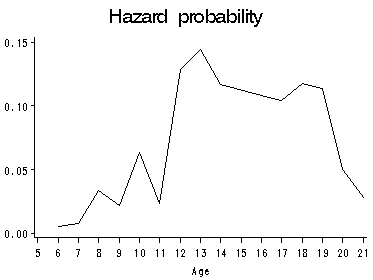
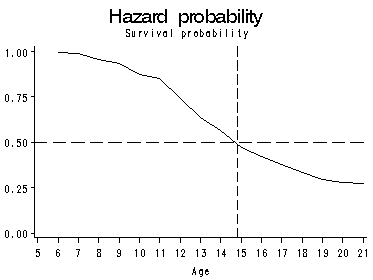
Plots of the hazard function and the survival function for the suicide data.
proc freq data='c:\alda\suicide_pp' noprint;
  tables period*event/nopercent nocol out=summaryc outpct;
  run;
*Using the data set one created earlier;
*Calculating the hazard and survivorship function;
data twoc;
  set one summaryc;
  if event=1 or period = 0;
  hazard=pct_row/100;
  retain survivor 1;
  if period > 0 then survivor=survivor*(1-hazard);
  keep period hazard survivor;
run;
goptions reset=all;
symbol color=black i=join value=none height=2 ;
axis1 label=none order=(0 to .15 by .05) minor=none;
axis2 label=("Age") order=(5 to 21 by 1) minor=none ;
axis3 label=none order=(0 to 1 by .25) minor=none;
proc gplot data=twoc uniform;
  title 'Hazard probability';
  plot hazard*period/vaxis=axis1 haxis=axis2 noframe;
  title2 'Survival probability';
  plot survivor*period/ vaxis=axis3 haxis=axis2 noframe href=14.8 vref=.5 lhref=21 lvref=21;
run;
quit;
title;
Fig. 10.2–panel D, page 340
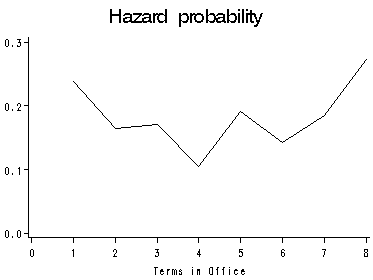
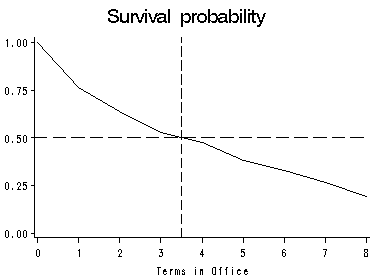
Plots of the hazard function and the survival function for the congress data.
*creating a data set called summary which contains the cell count for the ;
*table period by event;
proc freq data='c:\alda\congress_pp' noprint;
  tables period*event/nopercent nocol out=summaryd outpct;
run;
*Using the data set one created earlier;
*Calculating the hazard and survivorship function;
data twod;
  set one summaryd;
  if event=1 or period = 0;
  hazard=pct_row/100;
  retain survivor 1;
  if period > 0 then survivor=survivor*(1-hazard);
  keep period hazard survivor;
run;
goptions reset=all;
symbol color=black i=join value=none height=2 ;
axis1 label=none order=(0 to .3 by .10) minor=none;
axis2 label=("Terms in Office") order=(0 to 8 by 1) minor=none ;
axis3 label=none order=(0 to 1 by .25) minor=none;
proc gplot data=twod uniform;
  title 'Hazard probability';
  plot hazard*period/vaxis=axis1 haxis=axis2 noframe;
  title 'Survival probability';
  plot survivor*period/ vaxis=axis3 haxis=axis2 noframe href=3.5 vref=.5 lhref=21 lvref=21;
run;
quit;
title;
Table 10.2 on page 349. The middle column for the survival function is based on the formula (10.8) on page 350.
proc lifetest data = 'c:\alda\teachers';
   time t*censor(1);
   ods output ProductLimitEstimates = t;
run;
data ta;
  retain myn;
  set t;
  if censor = 1 then myn = left;
  if survival ~=.;
 run;

data table10_2;
  set ta;
  lags = lag(survival);
  if myn = . then lagleft = lag(left);
  else lagleft=myn;
  hazard = 1 - survival/lags;
  se_h = sqrt(hazard*(1-hazard)/lagleft);
  s_sqrt=stderr**2/survival**2;
  drop lags left stratum;
  if t>=1;
run;
options nocenter nodate;
proc print data = table10_2 noobs;
  format t 2.0 hazard se_h survival s_sqrt stderr 9.7;
  var  t lagleft hazard se_h survival s_sqrt stderr;
run;
T lagleft hazard se_h Survival s_sqrt StdErr
 1      3941     0.1157067    0.0050954    0.8842933    0.0000332    0.0050954
 2      3485     0.1101865    0.0053041    0.7868561    0.0000687    0.0065235
 3      3101     0.1157691    0.0057455    0.6957625    0.0001110    0.0073288
 4      2742     0.1075857    0.0059173    0.6209084    0.0001549    0.0077283
 5      2447     0.0890887    0.0057588    0.5655925    0.0001949    0.0078958
 6      2229     0.0825482    0.0058290    0.5189038    0.0002353    0.0079590
 7      2045     0.0601467    0.0052576    0.4876935    0.0002665    0.0079622
 8      1642     0.0481121    0.0052812    0.4642295    0.0002973    0.0080048
 9      1256     0.0421975    0.0056727    0.4446402    0.0003324    0.0081067
10       948     0.0369198    0.0061243    0.4282242    0.0003728    0.0082687
11       648     0.0246914    0.0060962    0.4176508    0.0004119    0.0084765
12       391     0.0127877    0.0056822    0.4123100    0.0004450    0.0086981
Figure 10.4, page 353
Demonstrating the difference between the person-oriented data set teachers and the person-period data set teachers_pp.
proc print data='c:\alda\teachers' noobs;
  where id=20 or id=126 or id=129;
run;
proc print data='c:\alda\teachers_pp' noobs;
  where id=20 or id=126 or id=129;
  var id period event;
run;

 ID     T    CENSOR
 20     3       0
126    12       0
129    12       1

 ID    PERIOD    EVENT
 20       1        0
 20       2        0
 20       3        1
----------------------
126       1        0
126       2        0
126       3        0
126       4        0
126       5        0
126       6        0
126       7        0
126       8        0
126       9        0
126      10        0
126      11        0
126      12        1
----------------------
129       1        0
129       2        0
129       3        0
129       4        0
129       5        0
129       6        0
129       7        0
129       8        0
129       9        0
129      10        0
129      11        0
129      12        0
Table 10.3, page 355
Cross-tabulation of event indicator (event) and time-period indicator (period) in the person-period data set to yield components of the life table.
proc freq data='c:\alda\teachers_pp' noprint;
  tables period*event/  nocol nopercent out=percent outpct;
run;
data percent1;
  set percent;
  if event=0 then levent=count;
  if event=1 then event1=count;
  event0 = lag(levent);
  drop event percent pct_col count levent;
run;
data percent2;
  set percent1;
  if event1 = . then delete;
  total  = event1 + event0;
  proportion = event1 / total;
run;
proc print data=percent2 noobs;
run;

PERIOD    event1    event0    total    proportion
   1        456      3485      3941      0.11571
   2        384      3101      3485      0.11019
   3        359      2742      3101      0.11577
   4        295      2447      2742      0.10759
   5        218      2229      2447      0.08909
   6        184      2045      2229      0.08255
   7        123      1922      2045      0.06015
   8         79      1563      1642      0.04811
   9         53      1203      1256      0.04220
  10         35       913       948      0.03692
  11         16       632       648      0.02469
  12          5       386       391      0.01279

